Introduction
The diagnosis of apical root resorption is usually based on routine radiographs. However, these methods are limited because the images reflect the superimposition of the whole root structure and can lead to underestimation of the extent of apical root resorption. In this study, we aimed to determine the lengths of the labial and lingual surfaces of incisors with apical root resorption and compare them with the longest radicular length obtained on sagittal images of cone-beam computed tomography, and to create a qualitative visual scale of the different patterns of apical root resorption.
Methods
Eighty-two incisors with apical root resorption from 25 patients had their labial and lingual root surfaces and the longest radicular lengths determined in the sagittal plane and compared. Five orthodontists, at 2 times, classified the images of each incisor according to a visual scale developed by the authors.
Results
There was no significant difference between the labial and lingual surfaces; however, the longest radicular length was significantly greater than the shortest surface length. The visual scale showed intraobserver agreement of 0.615 and interobserver agreements of 0.74 and 0.52 at both times, respectively.
Conclusions
The difference between the longest and shortest root lengths suggests that radiographic superimposition underestimates the extent of the resorption lesion. The proposed visual scale showed a frequency of agreement above 65% and a coefficient of reproducibility varying from moderate to substantial.
Apical root resorption is an undesirable effect, common in orthodontic treatment, that leads to permanent loss of dental structure. The clinical diagnosis of this condition is predominantly based on routine radiographic procedures such as periapical or panoramic radiographs. However, these methods are limited because they produce bidimensional images of a tridimensional structure, leading to labiolingual superimposition of the whole root structure. This limitation can jeopardize the diagnosis of root resorption because radiographic images might underestimate the extent of the apical root resorption lesion.
The advent of tridimensional images brought about the perspective of a precise quantitative evaluation that permits differentiating the levels of root resorption in various root surfaces.
Cone-beam computed tomography (CBCT) is an efficient technique to obtain data of dental structures. This method provides images in slices of the dental roots that eliminate superimposition of structures and show different levels of resorption on the labial and lingual surfaces, demonstrating it to be a precise tool in the diagnosis of root resorption lesions. In addition, it has the advantage of a much lower radiation burden to the patient when compared with conventional computed tomography.
In 1982, Malmgren et al created a quantitative evaluation index of apical root resorption made up of the following scores: irregular apical contour, apical root resorption less than 2 mm (minor resorption), apical root resorption from 2 mm to a third of the original root length (severe resorption), and apical root resorption exceeding a third of the original root length (extreme resorption). However, qualitative or quantitative classifications applicable to sagittal radiographic images of apical root resorption lesions could not be found in the literature.
Since the visualized images on periapical radiographs reflect the superimposition of the whole root structure, underestimating the extent of the resorption lesion, in this study, we aimed to determine, in sagittal images of CBCT, the lengths of the labial and lingual surfaces of the incisors with a diagnosis of apical root resorption by comparing them with the longest root length, and to create a qualitative visual scale for the classification of the images of apical root resorption.
Material and methods
The sample comprised 82 incisors with apical root resorption from 25 patients (14 female, 11 male; age range, 13-41 years; mean age, 20.4 years) having orthodontic treatment with fixed edgewise appliances and selected based on the diagnosis of apical root resorption in at least 1 maxillary incisor by means of follow-up periapical radiographs. In the pretreatment records, these patients did not have maxillary incisors with apical root resorption, root morphologic alterations, or history of trauma. This study was approved by the Human Research Ethics Committee of Juiz de Fora Federal University in Brazil.
The images were obtained with CBCT (i-CAT; Imaging Sciences International, Hatfield, Pa), operated at 120 kVp and 3-8 mA, voxel size of 0.4 mm, and a field of view of 160 × 100 mm, and analyzed with the software i-CAT Vision (Imaging Sciences International) with 0.5-mm-thick slices on the multiplanar reconstruction visualization mode.
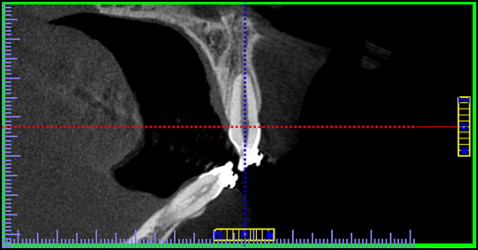
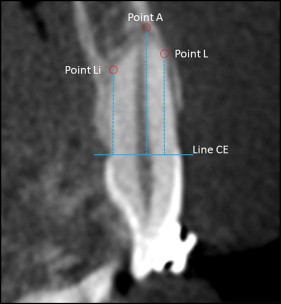
The sagittal image selected for the analysis of each incisor was the one obtained from the sagittal cut of the mesiodistal center of the root and perpendicular to the incisal border ( Fig 1 ). Three points of reference were determined: L, the most apical point of the labial surface of the root from which apical root resorption begins; Li, the most apical point of the lingual surface of the root from which apical root resorption begins; and A, the most apical point of the tooth root. A horizontal line (line CE) was drawn passing through the median point of the labial and lingual cementoenamel junctions and perpendicular to the long axis of the tooth root. The lengths of the labial and lingual surfaces were determined, respectively, by the distance between points L and Li and their orthogonal projections on line CE. In the same way, the longest root length was determined by the distance between point A and its orthogonal projection on line CE ( Fig 2 ). The shortest root length was determined by the dimension of the shortest of either the labial or the lingual root surface.
All root measurements of 15 randomly selected incisors were evaluated at 2 times in a 3-week interval and compared for determination of the average errors.
We created a qualitative visual scale for classifying the sagittal appearance of the apical root resorption lesions ( Fig 3 ), and its reproducibility was then determined. Sagittal cut images of the 82 incisor were selected, and the apical root resorption lesions were classified by 5 orthodontists according to a visual scale at 2 times, with an average interval of 30.6 days between them. The observers received no additional information or previous training and did not participate in the construction of the visual scale and the measurement of the incisors. During the second evaluation, the order of the radiographs was randomly changed in relation to the first one.

Statistical analysis
The average error of measurement of the root length was calculated by the intraclass correlation coefficient. The distribution pattern (normal or nonnormal) of the variables was determined by the Kolmogorov-Smirnov and Shapiro-Wilks tests. Root lengths were compared by using paired Student t and Wilcoxon tests. The reproducibility of the visual scale for the apical root resorption lesions was evaluated by the kappa coefficient for the interobserver and intraobserver analyses. The level of significance of 0.05 was used for all statistical analyses. Tests were made with SPSS software (version 17.0.0; SPSS, Chicago, Ill).
Results
The intraclass correlation coefficient for the root lengths was 0.986, indicating excellent agreement.
Among the 82 incisors evaluated, 9 (11%) were mandibular central incisors, 10 (12.2%) mandibular lateral incisors, 36 (32.9%) maxillary central incisors, and 27 (43.9%) maxillary lateral incisors. Table I shows the values of the normality tests of the lengths of the labial and lingual surfaces and the longest and shortest root lengths for each group of incisors. All variables had normal distributions, except the length of the labial surface of the maxillary lateral incisors.
| Incisors | n | Labial | Lingual | LRL | SRL | ||||
|---|---|---|---|---|---|---|---|---|---|
| Test | P | Test | P | Test | P | Test | P | ||
| Maxillary | |||||||||
| Central incisors † | 37 | 0.122 | 0.177 | 0.141 | 0.177 | 0.087 | 0.200 | 0.124 | 0.162 |
| Lateral incisors † | 26 | 0.176 | 0.038 ∗ | 0.112 | 0.200 | 0.140 | 0.200 | 0.160 | 0.087 |
| Mandibular | |||||||||
| Central incisors ‡ | 9 | 0.930 | 0.482 | 0.908 | 0.302 | 0.843 | 0.062 | 0.922 | 0.411 |
| Lateral incisors ‡ | 10 | 0.981 | 0.968 | 0.877 | 0.120 | 0.924 | 0.390 | 0.961 | 0.793 |
| Total † | 82 | 0.055 | 0.200 | 0.075 | 0.200 | 0.067 | 0.200 | 0.066 | 0.200 |
Table II shows the average lengths of the labial and lingual surfaces and the longest and shortest root lengths in each group of incisors. There was no statistically significant difference between the labial and lingual surfaces. However, the longest root length was significantly longer than the shortest root length in all groups of incisors.
| Incisors | Labial | Lingual | P | LRL | SRL | P | ||||
|---|---|---|---|---|---|---|---|---|---|---|
| Mean | SD | Mean | SD | Mean | SD | Mean | SD | |||
| Maxillary | ||||||||||
| Central incisors | 10.89 | 2.25 | 10.93 | 1.73 | 0.876 | 11.78 | 1.85 | 10.37 | 1.93 | 0.000 |
| Lateral incisors | 11.06 | 2.08 | 10.64 | 2.12 | 0.059 | 11.68 | 1.90 | 10.32 | 2.10 | 0.000 |
| Mandibular | ||||||||||
| Central incisors | 9.69 | 1.75 | 10.22 | 1.82 | 0.372 | 10.58 | 1.67 | 9.33 | 1.69 | 0.007 |
| Lateral incisors | 10.50 | 1.43 | 10.70 | 1.65 | 0.528 | 11.27 | 1.15 | 10.00 | 1.66 | 0.007 |
| Total | 10.77 | 2.07 | 10.73 | 1.85 | 0.807 | 11.55 | 1.79 | 10.20 | 1.93 | 0.000 |
Table III demonstrates the absolute and relative distributions of the incisors evaluated according to the length of the labial and lingual surfaces and their relationships with the longest root length.
| Incisors | L and Li = LRL | Li < LRL | L < LRL | L and Li < LRL | Total | ||
|---|---|---|---|---|---|---|---|
| L > Li | L < Li | L = Li | |||||
| n (%) | n (%) | n (%) | n (%) | n (%) | n (%) | ||
| Maxillary | |||||||
| Central incisors | 3 (8.1) | 9 (24.3) | 12 (32.4) | 6 (16.2) | 5 (13.5) | 2 (5.4) | 37 |
| Lateral incisors | 2 (7.6) | 10 (38.4) | 7 (26.9) | 3 (11.5) | 0 (0.0) | 4 (15.3) | 26 |
| Mandibular | |||||||
| Central incisors | 0 (0.0) | 2 (22.2) | 7 (77.7) | 0 (0.0) | 0 (0.0) | 0 (0.0) | 9 |
| Lateral incisors | 1 (10.0) | 2 (20.0) | 6 (60.0) | 0 (0.0) | 0 (0.0) | 1 (10.0) | 10 |
| Total | 6 (7.3) | 23 (28.0) | 32 (39.0) | 9 (10.9) | 5 (6.1) | 7 (8.5) | 82 |
As for the evaluation of the reproducibility of the visual scale for classification of apical root resorption, the frequencies of agreement between the first and second evaluations are shown in Table IV . Of the 410 evaluations, 285 were coincident, corresponding to 69.5% of agreement. Additionally, the intraobserver reproducibility was calculated with the kappa coefficient ( Table V ), showing an average reproducibility of 0.615.


