Introduction
Our objective was to assess the effects of miniscrews on interproximal alveolar bone density and adjacent gingival tissue health.
Methods
Forty-four titanium miniscrews were inserted between maxillary second premolars and first molars on both sides of the dentition in 22 consecutive patients (15 female, 7 male; ages, 14-24 years). A control area (between the maxillary first and second premolars) was also assessed. Both miniscrew (study) and control areas were monitored clinically and radiographically at different time points: before insertion of the miniscrews and at 1 month, 3 months, and 6 months after insertion. Software associated with a digital intraoral radiography machine was used to assess changes in alveolar bone density. Clinical gingival parameters of the study and control areas were also recorded. A repeated-measures analysis of variance and the Bonferroni post-hoc pairwise comparison tests were used to assess the changes at the different time points.
Results
Thirty-nine miniscrews were successful for the study duration. Male subjects had significantly ( P <0.001) higher alveolar bone density than did the females at baseline. Alveolar bone density around the miniscrews increased significantly ( P <0.001) between 3 and 6 months after insertion upon loading. Alveolar bone density of the control area did not change significantly during the experiment ( P >0.05). The width of keratinized gingiva increased significantly ( P <0.001) in the study and control areas after insertion of miniscrews and remained with no significant change throughout the study.
Conclusions
Miniscrews increased the alveolar bone density significantly after 3 months of insertion and were not associated with detrimental effects on the adjacent gingival tissues.
Management of an anchorage problem during orthodontic treatment can be challenging, especially in adults and noncompliant patients. Skeletal anchorage devices such as miniscrews are a newly available addition to the orthodontist’s armamentarium. They are now becoming a reality, and studies have suggested that they have a value in managing patients with challenging anchorage demands.
Miniscrews, however, should remain successful and stable enough to withstand the required forces. Miniscrew mobility has been considered as a sign of failure. However, Park et al suggested that minimal mobility of miniscrews after insertion might not indicate failure. They found that of 45 minimally mobile miniscrews, 34 remained successful 5 to 8 months after insertion. This might indicate that in the absence of infection, the stability of minimally mobile miniscrews has improved over the time, and this could be related to the response of the alveolar bone, which can be represented by its density.
In animal studies, it was found that bone density around miniscrews increased upon force loading. In another animal study, 12 weeks of force loading resulted in a significantly higher mineralized bone fraction around the dental implants than at 6 weeks.
However, to our knowledge, the effects of miniscrews on alveolar bone density and the adjacent gingivae have not been mentioned before in the literature in a prospective clinical study. Therefore, in this study, we aimed to determine in a prospective way whether interproximal alveolar bone density will change after insertion of miniscrews upon loading and to observe the changes in the gingival tissues around the miniscrews during orthodontic treatment.
Material and methods
This prospective clinical study was conducted with patients whose orthodontic treatment required miniscrews for distalization of the maxillary first molars. These patients received their orthodontic treatment at the Dental Teaching Clinics of Jordan University of Science and Technology in Irbid, Jordan. Ethics approval for the study was obtained from the institution of research board at this university.
Forty-four titanium miniscrews were inserted in the interproximal alveolar bone between the maxillary second premolars and first molars on both sides of the dentition (1 per side) in 22 consecutive patients (15 female, 7 male; ages, 14-24 years; average age, 17 years 8 months).
All patients included in this study were selected according to the following inclusion criteria: minimum age of 14 years, no history of orthodontic treatment, no extracted or missing teeth, no active periodontal disease, adequate oral hygiene, average or increased overbite, medically and mentally fit, half-unit Class II molar relationship, treatment planned without extractions and with distalization of the maxillary first molars, and signed consent forms for participation in this study.
Titanium miniscrews (Abso-anchor, Dentos, Daegu, Korea), 1.3 mm in diameter and 8 mm in length ( Fig 1 ), were inserted in the buccal interproximal alveolar bone between the maxillary second premolars and first molars on both sides by a specialist orthodontist (E.A.M.) using a standardized methodology with a self-drilling technique. The sequence of insertion of the miniscrews was as follows.
- 1.
Take a preliminary periapical radiograph to estimate the angulations of the roots of the adjacent teeth.
- 2.
Localize the start point of insertion.
- 3.
Anesthetize the area with a few drops of local anesthesia (xylestesin-A 2%; 3M ESPE, Seefeld, Germany).
- 4.
Ask the patient to rinse the area with chlorhexidine 0.02% (Oraxin Mint, Amman Pharmaceutical Industries, Amman, Jordan).
- 5.
Insert the miniscrews (self-drilling technique).
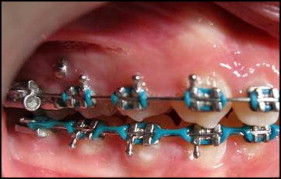
To ensure that the miniscrews would be away from the roots, they were inserted in the attached gingivae just below the mucogingival junction with the insertion angle directed apically (about 45°), so that each miniscrew would approach a wider area of the alveolar bone, since the roots diverge apically. The angle of insertion was assessed visually with the intent to standardize it for all patients.
To prevent any effect on the alveolar bone and the adjacent gingiva from the fixed orthodontic appliance and tooth movement, control areas between the maxillary first and second premolars on both sides were also included in the measurements.
Data were collected in a prospective way and involved 2 aspects of periodontal health: (1) gingival clinical parameters of the study area (between the maxillary second premolars and first molars) and the control area (between the maxillary first and second premolars), and (2) alveolar bone densities of the study and control areas assessed on digital periapical radiographs by using Digora for Windows software (version 2.5; Soredex, Tuusula, Finland) associated with the Digora Optime system of digital intraoral radiography machine.
Digital periapical radiographs were taken, and clinical gingival parameters were recorded at 4 time points: T0, before insertion of the miniscrews (baseline data); T1, 1 month after insertion of the miniscrews; T2, 3 months after insertion of the miniscrews; and T3, 6 months after insertion of the miniscrews.
The following clinical gingival parameters were recorded at these time points by a trained examiner (A.A.M.S.).
- 1.
Probing depth: the distance from the gingival margin to the depth of the gingival sulcus on the mesiobuccal and distobuccal surfaces of the teeth around the miniscrews on each side, measured to the nearest millimeter with a Williams periodontal probe.
- 2.
Gingival enlargement: the distance from the gingival margin to the cementoenamel junction when the level of the gingival margin is coronal to the cementoenamel junction.
- 3.
Width of the attached gingiva: the distance from the free gingival groove to the mucogingival junction measured to the nearest millimeter with a Williams periodontal probe.
- 4.
Width of the keratinized gingiva: the distance from the gingival margin to the mucogingival junction measured to the nearest millimeter with a Williams periodontal probe.
- 5.
Presence or absence of plaque or calculus around the miniscrews.
- 6.
Presence or absence of redness or gingival overgrowth in the tissues directly surrounding the miniscrews.
- 7.
Vitality of the adjacent teeth by using ethyl chloride.
To overcome the effect of the fixed orthodontic appliances on gingival health, both the attached and keratinized gingivae were measured. Since the gingival groove is difficult to locate clinically, the attached gingiva was measured according to the following equation: attached gingiva (mucogingival junction to the gingival groove) = keratinized gingiva (mucogingival junction to the free gingival margin) – probing depth.
Standardized digital periapical radiographs at right angles to the area between the maxillary second premolars and first molars were taken at T0, T1, T2, and T3 during the orthodontic treatment period. The periapical radiographs were taken by a technician using the Digora Optime system of digital intraoral radiography.
The technical parameters of exposure were the same in all included radiographs: 60 kV(p), 4 mA, and 0.22 seconds on speed 5 films and a standardized film holder (paralleling technique with an XCP device; DENTSPLY Rinn, Elgin, Ill).
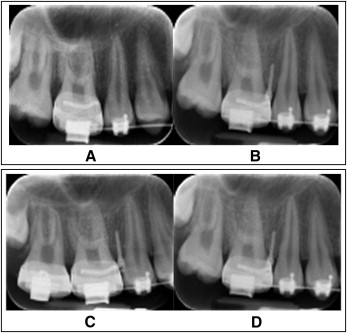
Eight digital periapical radiographs were taken for each patient (4 on each side), and the geometric alignment was reproduced as accurately as possible ( Fig 2 ).
In the study area, 7 (3 at each side of the miniscrew and 1 apical to it) fields of view around the miniscrews were selected by using the Digora software with the Digora Optime system of digital intraoral radiography machine ( Fig 3 ).
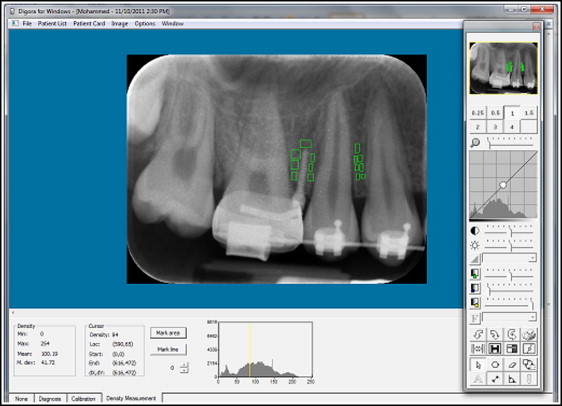
This analyzing software gives measurements of bone density on a scale from 0 to 255, where 0 represents the most black and 255 represent the most white. In the control area, 7 fields of view were also selected in the interproximal alveolar bone between the maxillary first and second premolars ( Fig 3 ). The mean density of each field of view was recorded, and then the mean density of the alveolar bone was calculated as the mean of the 7 means of the fields of view. This was performed for the study and control areas at the 4 time points (T0-T3).
All patients had maxillary and mandibular fixed orthodontic appliances (0.022 × 0.028 in) (Roth system; GAC International, Bohemia, NY). Oral hygiene was controlled for all patients by frequent instructions and referral to a hygienist when required. Two weeks after miniscrew insertion, an initial force of 200 g was applied with an elastic chain (3M Unitek, Monrovia, Calif) between the miniscrew and the maxillary canines to induce distalization of the maxillary first molars. To ensure that the force was equal for all patients, the initial force was measured with a force gauge (dial-type tension gauge; Dentaurum, Ispringen, Germany) at 200 g.
Before the study, the investigator (A.A.M.S.) was calibrated for 3 weeks by a specialist periodontist (R.S.A.) for measurement of the clinical gingival parameters. Also, during the study, the clinical gingival parameter measurements were performed under the supervision of the specialist periodontist.
To assess the reproducibility of the alveolar bone density measurements, 40 digital periapical radiographs were selected randomly and reanalyzed 2 weeks later.
To ensure that the technical parameters of radiographic exposure were the same for all radiographs, a reference point (molar tube of the band on the maxillary first molar) was selected, and its density was measured in all included periapical radiograhs. Molar bands from the same manufacturer (GAC International) were used in all patients and assumed to have the same density.
Statistical analysis
Statistical advice was obtained, suggesting that a sample of 35 miniscrews would be sufficient to detect changes in alveolar bone density at a significance level of 0.05 and a power of 0.85. Dropouts were expected, and 44 miniscrews were included in this study. Statistical analysis was performed by using SPSS computer software (version 20.0; SPSS, Chicago, Ill).
Descriptive statistics (means, standard deviations, and 95% confidence intervals [CIs]) were calculated for all measured variables. A repeated-measures analysis of variance (within-subjects ANOVA) test was conducted to detect the differences between the measured variables for the same subject at different time points. Significance was predetermined at the 0.05 level. The Bonferroni post-hoc pairwise comparison test was conducted to define differences in the measured variables among the time intervals.
The independent-samples Student t test was conducted to compare alveolar bone density between the sexes at T0.
The differences between the first and second measurements of alveolar bone density were assessed by paired-samples t tests and the Pearson coefficient of correlation for the reliability of the measurements.
Results
Error testing was conducted. A significant correlation was found between the first and second readings (0.935), and there were no significant differences between the first and second readings, with a significance level of P = 0.752.
The density of the reference point (molar tube of the maxillary first molar band) was the same for all radiographs.
Thirty-nine of 44 miniscrews placed were successful (success rate, 88.6%) for the entire study duration. Five miniscrews (11.4%) failed within a month of placement.
Based on the independent-samples t test, there was a significant difference in bone density between the male and female subjects ( P <0.001) at T0 in both the study and the control areas ( Table I ).
| Sex (n) | Mean (SD) | Mean difference (M − F) | Significance ( P value) | |
|---|---|---|---|---|
| ABD of control area | F (n = 29) | 75.23 (1.85) | ||
| M (n = 10) | 77.96 (1.56) | 2.73 | 0.000 ∗ | |
| ABD of study area | F (n = 29) | 78.06 (1.18) | ||
| M (n = 10) | 80.70 (1.25) | 2.64 | 0.000 ∗ |
Table II shows means, standard deviations, and 95% CIs of alveolar bone density in the study area at the 4 time points. Based on repeated-measures ANOVA (pairwise comparison) of bone density at the study area, changes from T1 to T2 show a minimal increase in bone density, but this increase did not reach statistical significance ( P >0.05). However, the increase in bone density from T2 to T3 was statistically significant ( P <0.001) ( Table III ; Fig 4 ).
| Time point | Alveolar bone density of study area | ||
|---|---|---|---|
| Mean ± SD | 95% CI | ||
| Lower boundary | Upper boundary | ||
| T0 | 78.73 ± 1.66 | 78.24 | 79.23 |
| T1 | 78.72 ± 1.67 | 78.23 | 79.22 |
| T2 | 78.76 ± 1.65 | 78.25 | 79.25 |
| T3 | 78.82 ± 1.66 | 78.28 | 79.28 |
| ABD | Mean difference (2 − 1) | Significance ( P value) | 95% CI of mean difference | ||
|---|---|---|---|---|---|
| 1 | 2 | Lower boundary | Upper boundary | ||
| T0 | T1 | −0.01 | 0.646 | −0.059 | 0.037 |
| T2 | 0.03 | 0.070 | −0.001 | 0.029 | |
| T3 | 0.09 | 0.000 † | 0.032 | 0.065 | |
| T1 | T0 | 0.01 | 0.646 | −0.037 | 0.059 |
| T2 | 0.04 | 0.328 | −0.026 | 0.076 | |
| T3 | 0.10 | 0.017 ∗ | 0.011 | 0.108 | |
| T2 | T0 | −0.03 | 0.070 | −0.029 | 0.001 |
| T1 | −0.04 | 0.328 | −0.076 | 0.026 | |
| T3 | 0.06 | 0.000 † | 0.019 | 0.050 | |
| T3 | T0 | −0.09 | 0.000 † | −0.065 | −0.032 |
| T1 | −0.10 | 0.017 ∗ | −0.108 | −0.011 | |
| T2 | −0.06 | 0.000 † | −0.050 | −0.019 | |
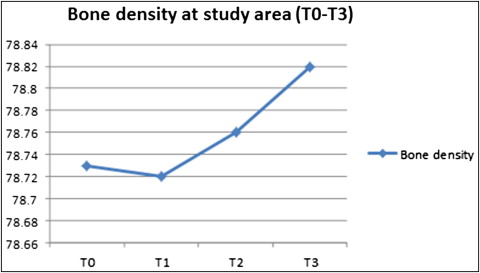
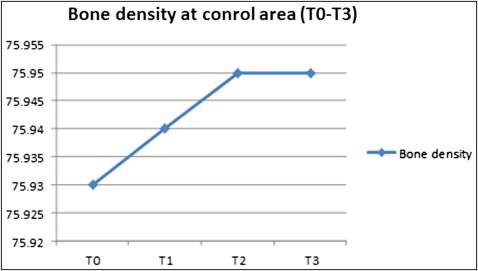
Table IV shows means, standard deviations, and 95% CIs of alveolar bone density of the control area at the 4 time points. No statistically significant change in bone density from T0 to T3 was detected ( Table V ; Fig 5 ).
| Time point | Alveolar bone density of control area | ||
|---|---|---|---|
| Mean ± SD | 95% CI | ||
| Lower boundary | Upper boundary | ||
| T0 | 75.93 ± 2.13 | 75.27 | 76.60 |
| T1 | 75.94 ± 2.12 | 75.28 | 76.61 |
| T2 | 75.95 ± 2.12 | 75.29 | 76.61 |
| T3 | 75.95 ± 2.12 | 75.29 | 76.61 |
| ABD | Mean difference (2 − 1) | Significance ( P value) | 95% CI of mean difference | ||
|---|---|---|---|---|---|
| 1 | 2 | Lower boundary | Upper boundary | ||
| T0 | T1 | 0.012 | 0.146 | −0.004 | 0.028 |
| T2 | 0.015 | 0.243 | −0.011 | 0.041 | |
| T3 | 0.016 | 0.223 | −0.010 | 0.041 | |
| T1 | T0 | −0.012 | 0.146 | −0.028 | 0.004 |
| T2 | 0.003 | 0.757 | −0.019 | 0.026 | |
| T3 | 0.004 | 0.726 | −0.019 | 0.027 | |
| T2 | T0 | −0.015 | 0.243 | −0.041 | 0.011 |
| T1 | −0.003 | 0.757 | −0.026 | 0.019 | |
| T3 | 0.001 | 0.932 | −0.014 | 0.015 | |
| T3 | T0 | −0.016 | 0.223 | −0.041 | 0.010 |
| T1 | −0.004 | 0.726 | −0.027 | 0.019 | |
| T2 | −0.001 | 0.932 | −0.015 | 0.014 | |
Stay updated, free dental videos. Join our Telegram channel
VIDEdental - Online dental courses


