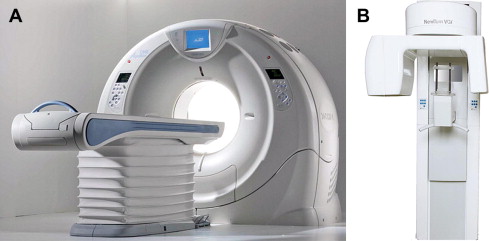
In 1972, the independent findings of Hounsfield and Cormack revolutionized diagnostic imaging with the invention of the computed tomography (CT) scanner . For the first time, practitioners had access to x-ray devices that could generate narrow cross-sectional images, usually perpendicular to the long axis of the human body, hence, the term computed axial tomography or CAT scan. This technology, fan-beam CT, was the first practical electronic application of the tomographic principal in diagnostic imaging and provided images that eliminated the superimposition of adjacent anatomic structures inherent in conventional plain projection radiography and the blur of analog tomography. The availability of CT images facilitated new perspectives in imaging diagnosis by reducing much of the guesswork that was often interlaced with projection imaging. CT is now an essential imaging modality of the diagnostic algorithm for an increasing variety of clinical applications . CT acquisition has subsequently been refined to incorporate a helical or spiral synchronous motion, fan-shaped beam, and multiple detector acquisition (MDCT), which enables fast scan times that provide high-quality images that can be integrated to produce a volumetric dataset. Although CT has been available for more than 4 decades, its clinical applications in dentistry have been limited because of the high equipment cost, limited access because of the certificate-of-need requirements in some jurisdictions, and radiation dose considerations ( Fig. 1 A).
Cone-beam computed tomography (CBCT) presents as a separate evolutionary arm to CT imaging. An early volumetric CT predecessor of CBCT, the Dynamic Spatial Reconstructor, was developed in the late 1970s by the Biodynamics Research Unit at the Mayo Clinic . Subsequently applied for vascular imaging , CBCT prototypes based on C-arms were demonstrated as early as 1983. CBCT provided an alternate method of cross-section image production to fan-beam CT using a comparatively less-expensive radiation detector than conventional CT. The technology transfer of CBCT to dentistry first occurred in 1995. Italian co-inventors, Attilio Tacconi and Piero Mozzo, developed a CBCT system for the maxillofacial region that was designed and produced by QR, Inc of Verona, Italy. This unit, the NewTom DVT 9000 became the first commercial CBCT unit marketed specifically to the dental market, initially introduced in Europe in 1999. Although with little more than a decade of application in dentistry, CBCT has revolutionized oral and maxillofacial imaging.
Similarities exist between technologies; however, differences in the image acquisition beam shape, as well as the x-ray generator and detecting system used, make CBCT stand independently as a simple and inexpensive approach to the concept of electronic sectional imaging focusing mostly on the maxillofacial region. This development has resulted in the clinical availability of a cross-sectional technology capable, for the most part, of providing members of the dental profession with a comparatively inexpensive 3-dimensional (3D) imaging modality, both in terms of cost and radiation burden. Although the first CBCT generation was similar to fan-beam CT in that image acquisition was achieved with patients supine, subsequent design evolutions have transitioned to a smaller and smaller footprint, with units acquiring images with patients seated or standing. Hybrid units are also available that incorporate traditional 2-dimesnional (2D) panoramic or cephalometric functions (see Fig. 1 B).
The purpose of this article is to describe the important differences between fan-beam CT and CBCT technologies regarding beam geometry, image acquisition, image detection, image reconstruction, radiation dose, and more. It also analyzes and discusses in detail the effect of the previously mentioned parameters to the fundamental issue of image quality.
Throughout this article, the acronym CT signifies fan-beam geometry using any number of detector rows and inclusive of linear and helical motion. CBCT signifies cone-beam CT and refers to units designed specifically for use in maxillofacial applications inclusive of dentistry or otorhinolaryngology.
Evolutions in CT
The introduction of CT heralded 2 firsts in medical diagnostic imaging: (1) data acquisition and image display were both digital in nature, with images viewed on special monitors and (2) a series of single, discrete, contiguous cross-sectional image slices of complete body sections in parallel to the image acquisition geometry were generated instead of planar projection images, which resulted in the superimposition of anatomic structures .
A fan-beam CT scanner images a region of interest (ROI) using an x-ray tube rigidly linked to a detector located on the other side of the patients. Together the tube and the detector initially scan across, but in later generations around, patients on a fulcrum, sweeping a narrow x-ray beam through one thin slice at a time. Contiguous image slices are acquired from multiple x-ray projections around the object. The reconstruction of the transmitted x-ray attenuation data by specific software algorithms produces adjacent image slices of the individual’s imaged volume . This concept is better understood if the human body (part thereof under examination) is made up of a stack of contiguous transverse slices. Each scan aims to determine the composition of one transverse section. This slice or section can be imagined as composed of discrete blocks of tissue known as volume elements or voxels . As different tissue densities are arranged as particular structures in a section, the numerous voxels belonging in these tissues will attenuate the x-ray beam differently; the attenuation capacity of the various tissues can be calculated and is expressed by a numerical value know as the attenuation coefficient or linear attenuation coefficient, μ . The linear attenuation coefficient characterizes how much a medium or material can attenuate an x-ray beam. A large μ indicates that the beam is more attenuated, whereas a small μ means the beam is less attenuated. An attenuation measurement represents the fraction of the x-ray intensity absorbed as the x-ray beam passed through a medium (or tissue) of a certain density ( μ ) and thickness. When the x-ray beam passes through different layers of tissues, the transmitted x-ray intensity will be the result of the added individual attenuations (sum) of the various voxels that lie in the specific straight path of the x-ray beam. Different rays from many different angles around the area of interest will derive an average attenuation coefficient value for each voxel in the section. Calculating the attenuation value of each voxel provides the capability to differentiate between various tissues in a slice based on their computed attenuation values. Determining the voxel attenuation values is possible by multiple x-ray projections from all possible angles that cross the voxels . This determination requires a large number of computations using the added attenuation data from each of the incident x-ray beams that cross these voxels.
Data acquisition in CT has continued to evolve over the last 4 decades, with advances directed at faster image acquisition and better spatial and contrast resolution. Current CT units are fourth-generation scanners as defined by their primary motion and geometric configuration between the x-ray source and the detector. Superimposed on this are advances over the past 10 to 15 years, incorporating the introduction of spiral tube-head motion and the multi-detector or multichannel acquisition system.
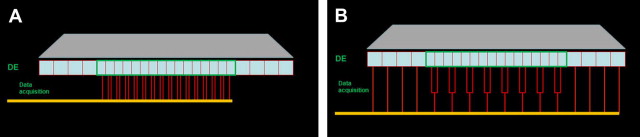
The first generation of CT scanner in the early 1970s incorporated a pencil-like x-ray beam and single detector that acquired data in a translate-rotate motion: The x-ray source and detector gradually scanned across patients in a linear movement (translation) and then, after a secondary rotational movement of the apparatus, the translation was performed again. After completing a 360° rotation, supine patients were translated slightly through the apparatus on a gantry such that a new section was exposed. In 1972, second-generation scanners were introduced that incorporated various efficiencies in image geometry acquisition. Although the motion remained a combination of translation followed by rotation, the shape of the x-ray beam changed from a narrow pencil beam to fan shaped, with gradual widening of the fan. The number of the detector elements also increased from a single to a linear array of detectors. Scan times, however, remained long, partly because of the use of stationary anodes. In 1976, the third generation of CT scanners, known as rotate-rotate, was introduced. The linear array of detectors was modified to an arc and their number increased to several hundred. In addition, the x-ray beam shape was wide and divergent enough to cover the arc. Finally the linear motion of the x-ray tube was abandoned and a circular motion was adopted with a fulcrum centered through the middle of patients. During a single scan, the x-ray tube/arc-shaped detector array combination continuously rotated around the patients while the patients were translated on the gantry. This design facilitated the incorporation of rotating anodes, which resulted in higher generator output and reduced scan times. In fourth-generation scanners, introduced in 1978, multiple detectors (up to a few thousand) are used and form a stationary ring around the patients. In this design, only the x-ray tube rotates around the patients inside the detector ring. During scanning, a wide fan-shaped beam exposes only a portion of the detectors, which is different for the various projections.
The 4 generations of CT design incorporated innovations designed to increase efficiency and reduce single-image scan times; however, the resulting data set was a compilation of single scans interposed by a stop/start action necessary for table translation. In addition, extra time was required for hardware adjustments during scanning (eg, cable unwinding). Both factors contributed in slowing down the overall acquisition process and resulted in increased examination time . These geometries produced anisotropic datasets whereby voxel dimensions in the X and Y dimensions were the same and could be reduced because of the advances in detector size, but dimensions in the Z plane were usually larger and related to slice thickness and section overlap. Although reducing slice thickness and increasing the overlap of adjacent sections provided some solution to the problem, these methods extended the scan time and radiation dose to patients. It is only with the introduction of the spiral or helical CT acquisition in 1989 that image data would finally become isotropic. Unlike in sequential CT, the technique involves the continuous acquisition of projection data through a 3D volume of tissue by the continuous rotation of the x-ray tube and detectors and simultaneous translation of the patients through the gantry opening . Of course the x-ray tube continues to travel on a circular arc; however, relative to moving patients, it seems that it follows a spiral or helical trajectory . The tightness or spread of the spiral between the contiguous revolutions of the x-ray source and, therefore, voxel dimensions in the Z direction is determined by the table movement and its speed. Table feed is the distance traveled by the patient table of the CT scanner in 360° revolution of the x-ray source. This information is a determinant of another important scanning parameter specific to spiral CT scanners, the pitch factor. The pitch factor represents the ratio of table feed to the total slice collimations or the total number of sections that can be acquired by the scanner in one rotation. This definition is applicable for single-section and multi-detector row CT. Its value indicates whether data acquisition occurs with gaps ( P >1) or with overlap ( P <1) between sections .
The spiral motion of CT acquisition has been facilitated by mechanical innovations, such as slip ring technology, which prevents the winding and unwinding of cables, and electrical advances, including increased heat capacity of the x-ray generators. Moreover, different reconstruction algorithms (interpolation algorithms) were developed that provided single-plane reconstructions despite the fact that the projections were acquired in a spiral rather than planar motion . Spiral scanning provided volumetric data with isotropic voxels such that image reconstruction planes could be placed in any position along the scanned volume. As a result, sections could be overlapping along the scan axis, improving data sampling and making volumetric reconstructions practical. Moreover, the overlapping reconstructed sections were the result of mathematical computations and not the result of overlapping projections, thus, it was achieved without increasing the radiation dose to patients .
The most recent technological advance in CT acquisition occurred in 1998 with the incorporation of multiple rows of detectors (initially 4) instead of a single row. MDCT has revolutionized the versatility of CT data with the partitioning of the information received from the incident beam into multiple small segments . Adding rows of detectors along the long axis of the human body increased the width of the acquisition volume by each rotation and resulted in more efficient use of the x-ray beam. The rows of detectors are frequently referred to as channels. Current detector configurations range from 16 to 64 and now 256 and even 512 channel systems. In most MDCT systems, the central channels may be narrower to accomplish a higher resolution along the longitudinal axis or may be combined (binned) by the acquisition system at the level of the detector array to increase the effective section thickness. Detector configuration refers to the number of data collection channels and the effective section thickness determined by the acquisition system. Different settings may affect both the size and the geometry of the x-ray beam .
CBCT acquisition
The geometric configuration and acquisition mechanics for the CBCT technique are theoretically simple . CBCT imaging is performed using a rotating platform to which an x-ray source and detector are fixed. A divergent pyramidal- or cone-shaped source of ionizing radiation (similar in shape to the divergent beam of traditional 2D transmission imaging) is directed through the middle of the ROI and the transmitted, attenuated radiation is projected onto an area x-ray detector on the opposite side. The x-ray source and detector rotate around a fulcrum, fixed within the center of the ROI. Unlike CT, the subject to be imaged does not move. This fulcrum acts as the center of the final acquired volume imaged. During the rotation, multiple sequential planar projection images covered by the detector or the field of view (FOV) are acquired in an arc of 180° or greater. These single projection transmission images constitute the raw primary data and are individually referred to as basis, frame, or raw images. Basis images seem similar to cephalometric radiographic images, only each is slightly offset from the next. There are usually several hundred projection-basis images that are integrated by software to construct an image volume. The complete series of images is referred to as the projection data or volumetric dataset. Only one rotational sequence of the gantry of 180° or greater is necessary for CBCT to acquire enough data for volumetric image construction because the FOV is irradiated simultaneously.
CBCT is not a modality specific to dentistry. The technology was initially applied to vascular imaging and subsequently used in other clinical fields (eg, otorhinolaryngology, radiotherapy, mammography) . Four technological developments converged to facilitate the construction of affordable CBCT units small enough to be used in the dental office: the introduction of x-ray detectors capable of rapid acquisition of multiple basis images, the development of suitably resilient x-ray generators, the evolution of suitable image acquisition and integration algorithms , and the availability of computers powerful enough to process the enormous amount of acquired image data. Fast data acquisition of the maxillofacial region with a single revolution, shorter examination time, and the fairly simple and inexpensive detection system are obvious advantages of CBCT that have propelled the technology for clinical applications in dentistry. Early devices were unimodal, capable of CBCT image acquisition only, and performed scanning with patients either supine or seated. These units were specifically designed on a robotic platform capable of achieving a 180° or greater rotation arc for CBCT x-ray generator/detector geometry. More recently, manufacturers have produced hybrid, multimodal systems, including additional dental panoramic capabilities.
One major advantage of most CBCT units in comparison with CT is the ability to reduce the FOV to the ROI. Reduction in the FOV usually can be accomplished mechanically or, in some instances, electronically. Mechanical reduction in the dimensions of the x-ray beam can be achieved by either preirradiation (reducing primary radiation dimensions) or postirradiation (reducing the dimensions of the transmitted radiation before it is detected) collimation. Currently most units use adjustable lead shields as primary collimation at the radiation source. Electronic collimation involves the elimination of data recorded on the detector that is peripheral to the area of interest. In this case, there is no physical reduction in irradiation of the ROI by physical means: the full FOV is exposed, but only the selected region is recorded. Both techniques reduce the amount of data for computational purposes and reduce reconstruction time; however, only preirradiation physical collimation of the x-ray beam limits x-ray radiation exposure to the ROI and results in reduced patient irradiation. The fairly limited field in comparison with CT usually eliminates the need for translational movement of the imaging volume (patients) during the scan, which is an integral feature of the CT image acquisition. This factor has liberated CBCT technology from the burden of fine coordination between the x-ray source and the translational hardware (patient table) and reduced the cost of these devices significantly. Exceptionally, some maxillofacial CBCT systems do have offset motion or vertical translation to permit extended fields of view.
Technology Comparisons: CBCT Versus CT
The similarities and differences between CBCT and CT can be compared in all 4 steps of the image-acquisition process: x-ray generation, x-ray detection, image reconstruction, and display.
X-ray generation
CT systems rely on high-power x-ray generators to acquire large volumes of data at high speeds. CT has always demanded high x-ray energy. Typically, operating voltage ranges from 80 to 140 kV(p) (kilovolt [peak]),with a maximum power of 20 to 100 kW. These systems can only be operated at maximum power for a limited time, approximately 30 to 60 seconds. These capabilities are defined by the properties of the anode and the generator, which allows for adequate pauses for cooling necessary when examining large volumes in single-slice CT. Spiral CT systems demanded longer exposures; to reduce power, the tube current had to be reduced to avoid overheating the tube. Innovations in x-ray tube design, like the rotating envelope vacuum vessel (eg, Straton tube [Siemens Healthcare, Erlangen, Germany]), have also enabled longer exposures. Contemporary tubes also have significantly improved heat dissipation. The size of the focal spot in CT tube heads is in the range of 0.5 mm to 1.2 mm. Often, CT systems use x-ray tubes with variable focal spot sizes. This variability makes sense because volumes for which good low-contrast resolution is essential need to be scanned with a large focal spot and high power, whereas high-resolution images with thin slices require a small focal spot. Most recently, tube innovations, like the flying focal spot, producing oscillation between 2 locations in the anode not only reduced the chance of overheating but have also allowed for double sampling (double data acquisition/rotation), improving image resolution .
The x-ray generators used in CBCT machines use an operating voltage of 80 to 120 kV(p), with most units operating toward the lower end of this range, which does not differ substantially from operating parameters in panoramic radiographic machines. Although the focal spot size is no different than CT (0.5–0.8 mm nominally), unlike CT, the anode is stationary in many CBCT systems. The tube current is generally much lower than CT, which reduces the power of the generator and the production of heat. Finally, in most CBCT systems, x-ray generation is pulsed to coincide with the detector activation. Pulsed x-ray beam generation is preferable because it markedly reduces total scan time and, therefore, heat production with less radiation dosage to patients. However, the low power used in this type of x-ray generator provides limitations in image quality (see later).
X-ray detection
The detection system of both CT and CBCT scanners is responsible for recording incident x-ray photons and converting the x-ray energy to a corresponding electrical signal. This signal is represented visually as a shade of gray on the monitor display, the intensity of which should be proportional to the intensity of the incident photons at a specific point. These functions are performed by completely different detector technologies in CT and CBCT units.
CT scanners use a series of small detector elements arranged linearly in a single row in an arc (third generation) or a circular (fourth generation) configuration around patients and opposite to the x-ray source. More recently, CBCT systems have several rows of detector elements placed adjacent to one another. Detector efficiency is a measure of the ability of the detector to detect incident rays measured as the fraction of incident photons recorded divided by the total number of incident photons reaching the surface of the detector. In an ideal detection system, all incident photons are recorded and converted to a proportional electrical signal. The actual sensitivity of the detector (also known as quantum efficiency) and the geometric features of the detector (eg, the total active area in comparison with its physical dimensions) are determinants of the overall detector efficiency.
There are 2 types of detectors commonly used in CT. The first type is the xenon gas detector, which is a gas ionization chamber containing a noble gas (xenon in this case) under pressure. Its function is based on ionization events caused by the incident photons in the chamber. The ionization events generate a collective charge on the opposite end of the detector proportional to the energy of the incident photons. The main disadvantage of the gas detector is its lower sensitivity. The second type of detector comprises a solid-state scintillation arrangement. This arrangement consists of 2 main components: a scintillation medium and a photon detector. The incident photon energy is initially converted to visible light as it hits the scintillation layer, with the light photons being recorded by the photon detector and converted to an electrical signal proportional to the incidental radiation. The typical scintillator material used includes cesium iodide, cadmium tungstate, and ceramic materials, such as gadolinium oxysulfide . The sensitivity of the scintillator detectors is higher than that of gas chambers; however, geometric efficiency is considered their most substantial disadvantage. The general detector configuration of an MDCT system is illustrated in ( Fig. 2 ). Multi-detector CT systems combine several arrays of detectors (usually 64 or 128, with some devices now at 256). Initially the detector arrangement was subdivided into equal elements referred to as uniform, mosaic, or matrix, with each element being a uniform size. Several manufacturers incorporate different sizes of detector elements in the detector arrangement. These sizes are referred to as nonuniform or variable detectors. Usually the central rows of detector elements are narrower in comparison with the peripheral detector rows, which usually increase in size or may be uniform. The latter arrangement is referred to as hybrid and a popular configuration on most 16-channel CT scanners . In these configurations, when a high-resolution scan is required, the x-ray beam is collimated so that only the central rows of detectors are activated, which results in thinner slices of the acquisition volume. When larger acquisition volumes are required at less resolution, a wider collimation is selected and all rows of the detector are used for data sampling. In this case, data collected from the central thinner elements are combined in pairs and result in thicker slices (see Fig. 2 ). This flexibility in the slice-thickness selection permits data sampling from slices ranging in thickness from narrow (0.5 mm–0.625 mm) to much thicker, based on the required resolution, diagnostic task, and size of the imaging volume. In this manner, the radiation dose to patients and scanning time are minimized .
CBCT technology uses an x-ray detection system that is mostly dictated by the spread of the cone-beam radiation. Therefore, all CBCT units use an area detector. Two systems are currently used.
Detectors were initially produced using a configuration of image intensifiers and charge-coupled-device (II/CCD) detectors. II/CCD detectors, still used by some manufacturers, are large and bulky and most frequently result in circular circular-basis image areas (spherical volumes) rather than rectangular ones (cylindrical volumes). They consist of an x-ray image intensifier, proper optics, and complimentary metal oxide semiconductor (CMOS) or charge coupled device (CCD) camera. The incident x-ray beam is converted to an optical signal (light) on the input phosphor screen of the detector and to an electron beam by the photocathode inside the detector. Next the electron beam is converted to light once again (after being accelerated) at the output phosphor screen. The intensity of the light generated is adjusted by the optical iris, an integral part of the intensifier tube. Finally, the light is registered by the CMOS or CCD camera and converted to an electrical signal. The read-out image includes geometric distortion and blurring generated by the image intensifier; however, correction algorithms are applied to remedy the distortion in the reconstructed image .
Now most, but not all, CBCT devices use flat panel detectors (FPD) comprising an array of hydrogenated amorphous silicon thin-film transistors or, in some cases, CMOS arrays. The silicon matrix is covered by an x-ray scintillator layer , which results in an indirect x-ray detection process. In both FPD circumstances, x-rays are detected indirectly by means of a scintillator, such as thallium-doped cesium iodide or terbium-activated gadolinium oxysulfide, converting them to visible light that is registered in the photodiode array. The photodiodes produce an electrical charge proportional to the incident x-ray energy. The electrical charge is integrated and stored in the detection elements, which also acts as a capacitor. The actual readout process is initialized by the thin-film transistor, which switches the charge to the read-out electronics via the data link . FPDs are less complicated, less bulky, and offer greater dynamic range than II/CCD detectors.
For each basis image, the detector records incident x-ray photons, collects a charge, and sends a signal to the computer. Because rotation is usually performed within times equivalent or less compared with panoramic radiography (from 5s to approximately 20s), each basis image is acquired and sent within milliseconds, and this occurs many hundreds of times within a single exposure rotation. The speed with which a detector performs this acquisition is called the frame-rate. FPDs unfortunately have limitations in their performance, including linearity of response to the radiation spectrum, lack of uniformity of response throughout the area of the detector, and bad-pixels. The effects of these on image quality are most noticeable at lower and higher exposures. To overcome this, detectors should be recalibrated periodically.
The resolution and, therefore, detail of CBCT imaging is determined by the individual voxels produced in formation of the volumetric dataset. Voxel dimensions are primarily dependent on the pixel size on the area detector not, as with CT, on slice thickness. However, not all of the area of the detector is taken up by the photodiode; as a result, only a portion of the surface of the detector element is active in the collection and registration of the incident radiation. The percentage of the active area of the detector elements over the total surface of the detector is referred to as the fill factor. The fill factor may be small (approximately 35%). Detectors with smaller pixels capture less x-ray photons and result in more image noise. Consequently CBCT imaging using higher resolutions may be designed to use greater exposures to achieve a reasonable signal-to-noise ratio (SNR) for diagnostic image quality . Unfortunately this results in a higher patient exposure dose .
The main disadvantages of IIT-CCD detectors are geometric distortion and blurring (both inherent processes during x-ray detection). In addition, the circular FOV may limit the ROI in some cases. FDPs also have limitations in their performance related to the linearity of response to the radiation spectrum, the uniformity of the response throughout the area of the detector, and bad pixels, the effects of which on image quality are most noticeable at lower and higher exposures . Baba and colleagues, found FDPs to demonstrate a higher spatial resolution in comparison with the IIT/CCD or IIT/CMOS systems.
Image reconstruction
The image reconstruction stage is similar for CT and CBCT technologies. Image reconstruction in CT is a mathematical operation that converts attenuation values per voxel from x-ray projection data to gray-scale images. The method used in this process has a fundamental impact on image quality and, therefore, on the radiation dose to patients. There are essentially 2 categories of reconstruction methods: analytical reconstruction and iterative reconstruction.
Operations based on filtered back projection (FBP) are one type of analytical reconstruction that is currently widely used on clinical CT scanners because of their computational efficiency and numerical stability. Different FBP-based methods have been developed for all generations of CT data-acquisition geometries, including multi-detector and for CBCT large area detectors. In FBP, x-ray photons are collected in a large set of x-ray projections, each related to a particular pixel on the detector. These projections are made across patients in a particular direction, usually axially, in the section plane. There may be several hundred elements in each set of x-ray projections. To reconstruct an image from the ray measurements, each voxel must be viewed from multiple offset x-ray projections . A complete dataset requires many projections at rotational intervals of 1° or less around the section. Currently, CT scanners typically measure 800 to 1500 projections. Back projection effectively reverses the attenuation process by adding the attenuation value of each ray in each projection back through the reconstruction matrix. Because this process generates a blurred image, the data from each projection are mathematically altered (filtered) before back projection, eliminating the intrinsic blurring effect. Currently, there are several advanced reconstruction techniques that are used in CT image reconstruction . In a way, the collected attenuation data are converted to shades of gray through complicated computations and filtration processes, which in turn are spatially distributed to the corresponding voxels; these will be displayed as pixels (picture elements) or 2D data (on screen) elements that form the sectional images.
Iterative reconstruction techniques have recently been introduced in CT imaging because they have many advantages compared with conventional FBP techniques. Important physical factors, including focal spot and detector geometry, photon statistics, x-ray beam spectrum, and scattering, can be more accurately incorporated into iterative reconstruction, yielding lower image noise and higher spatial resolution compared with FBP . In addition, iterative reconstruction can reduce image artifacts, such as beam hardening, windmill, and metal artifacts. Iterative reconstruction may also show a significant dose reduction. However, the high computation load associated with its use has prevented its adoption in clinical CT imaging.
The reconstruction process differs somewhat in spiral CT scanners. The continuous spiral motion of the x-ray source in these scanners may induce image artifacts. For these artifacts to be corrected, an additional preprocessing step is required: this is known as z-interpolation. Z interpolation is used to correct the inconsistencies present in the data set caused by the spiral motion and to create planar images from the spiral data at any random plane along the imaging volume .
In a similar fashion, CBCT attenuation data from the multiple projections around the image volume result in the formation of the basis images, which in essence compose the volumetric data set. The number of these images ranges from approximately 100 to 600, each one of them with more than one million pixels, which results in a complex reconstruction process, computationally. This process can be accomplished on a personal computer in contrast to CT whereby data processing requires special workstations .
In CBCT scanners, no control over the reconstruction method is provided to the operator. However, in contrast, users of MDCT scanners can select a reconstruction kernel, also referred to as filter or algorithm by some vendors, based on specific clinical applications. Generally there is a tradeoff between spatial resolution and noise for each kernel. A smooth kernel generates images with lower noise but with reduced spatial resolution. These kernels are usually used in brain examinations or liver tumor assessment to reduce image noise and enhance low contrast detectability. A sharp kernel generates images with higher spatial resolution but increases the image noise. These kernels are used to assess bony structures caused by the clinical requirement of better spatial resolution. Lower radiation dose can be used in these examinations because of the inherent high contrast of the structures.
Image display
The volumetric data produced by both technologies is displayed soon after data acquisition and can be viewed interactively. The default presentation offered by most visualization software is usually as a series of 2D contiguous inter-relational images at a thickness defaulted to the native resolution in 3 orthogonal planes (axial, sagittal, and coronal). Regarding MDCT display, data are usually transferred from the acquisition workstation to a separate console where it is formatted. However, in CBCT, imaging acquisition and visualization are usually performed on the same computer.
Display software provides an almost infinite and perhaps bewildering number of visualization options, each directed toward highlighting specific components of the volumetric dataset. Protocols incorporating display modes should be applied selectively to highlight anatomic features or functional characteristics within a specific diagnostic task. This area is where differences exist between CT and CBCT software. CT software requires high-end graphic capabilities on the dedicated special workstations to render volumetric images, such as virtual endoscopy and angiography. Although CBCT software requirements are, for the most part, simple, they are usually specific to dentistry and are not commonly available on CBCT software. These software requirements include nonaxial 2D planar images referred to as multi-planar reformations (MPR). In addition, the thickness of such planar images can be increased. MPR modes include oblique, curved planar reformation providing simulated distortion-free panoramic images, and serial transplanar reformation (providing cross sections), all of which can be used to highlight specific anatomic regions and facilitate diagnostic tasks. Without doubt, CBCT scanners and related applications have surpassed their medical counterparts as far as availability of task-specific diagnostic applications of importance to dentistry.
Stay updated, free dental videos. Join our Telegram channel
VIDEdental - Online dental courses


