Population Health
Jane E.M. Steffensen, RDH, BS, MPH, CHES
Upon completion of this chapter, the student will be able to:
• Describe the current status of oral health in the United States.
• Discuss oral health trends in the United States.
• Compare the indicators for oral health included in the national oral health objectives for Healthy People 2010 and Healthy People 2020.
• Identify oral health disparities and inequities among population groups.
• Discuss the factors that influence oral health in populations.
Opening Statement
The Burden of Oral Diseases in the United States1–3
• Of young children 2 to 4 years of age, 24% have already experienced dental caries and 19% have untreated tooth decay.
• Of children 6 to 8 years of age, 53% are affected by dental caries, and 56% of 15-year-old adolescents are affected by dental caries as well.
• Nearly one third (29%) of school children 6 to 8 years of age have untreated tooth decay.
• Only 32% of children 8 years of age and 21% of adolescents 14 years of age have received dental sealants.
• Nearly 70% of the population served by public water systems received optimally fluoridated water and the benefits for prevention of dental caries.
• Of adults 35 to 44 years of age, 16% have destructive periodontal disease.
• Oral diseases continue to burden older adults, and 24% of seniors (65 to 74 years of age) are edentulous and no longer have their natural teeth because of dental caries or periodontal disease.
• Approximately 36,540 Americans are found to have oral and pharyngeal cancer, and approximately 7880 people die of these cancers each year.
• More than two thirds (66%) of children and adults had dental insurance coverage; 35% had no dental insurance coverage.
• Nearly two thirds (55%) of children (>2 years of age) and adults have not had a dental visit in the past year.
• Only 25% of edentate adults 18 years and older had an annual dental visit in the preceding year.
Part One: Oral Health Status and Trends
Global Burden of Oral Diseases
Oral health has a profound effect on general health and is an important indicator of quality of life. Oral health problems still persist in countries around the globe despite great improvements in the oral health among some populations.4 Significant oral disease burdens exist among different age groups, especially for people with lower incomes and educational levels and for certain racial and ethnic groups in developing and developed countries.5 Oral diseases, such as dental caries, periodontal diseases, tooth loss, oral mucosal lesions and oropharyngeal cancers, oral diseases associated with human immunodeficiency virus (HIV)/acquired immunodeficiency disease (AIDS), oral and craniofacial injuries, and noma (cancrum oris), are major public health problems worldwide.4,5
Communities throughout the world face dental public health problems as individuals experience preventable oral diseases, in particular, vulnerable and disadvantaged groups in developing countries.4–9 Different oral disease patterns, as well as development trends between countries, reflect the impact of the application of effective evidence-based preventive oral health programs.4–9 The important role of behavioral, social, cultural, and environmental factors in oral health and disease has been shown in epidemiologic surveys and data systems supported by the World Health Organization (WHO) Global Oral Health Program.7–9
In 1969, the WHO began building the Global Oral Data Bank.9 Based on standard methods for data collection published in the WHO Oral Health Surveys Basic Methods manual, oral health indicators were surveyed and oral health data were submitted for comparisons between nations. In 1995, the WHO Oral Health Country/Area Profile Program (CAPP) was developed to organize and present data for various countries and regions so that oral health status and services could be described on the Internet. The CAPP was established in collaboration with the WHO Noncommunicable Diseases and Mental Health Cluster, several WHO Collaborating Centers, organizations, and individuals around the world. Today, 130 countries contribute oral health data to the Oral Health CAPP.6,9
These resources are now being integrated into the WHO Global Oral Health Databases and developed as part of the WHO Global InfoBase.6,9 The expected results of the integrated data system will be oral health indicators mapped for target population groups at the global level to depict the oral disease burden. Also, a newly available resource, the Global Oral Health Atlas, has mapped oral health across the world. The publication describes oral health status, as well as key factors influencing trends in oral diseases, on a global level.10
National oral health indicators from the United States are included in the global and regional oral health surveillance systems. Selected oral health indicators are tracked by the 39 nations in the Americas, including those reported by the United States. The Pan American Health Organization (PAHO) serves as the WHO Regional Office for the Americas (AMRO) and leads this regional oral health surveillance effort on an international level.6,9
Oral Health in the United States
In the United States, progress has been made in reducing the extent and severity of common oral diseases.1,11,12 Over the past half century, major strides in oral health have been seen nationally for many Americans, yet oral diseases remain common and widespread in the United States.1,11–16 Oral diseases and conditions still afflict most people at some time throughout their lifespan.1,13
Factors that contribute to this burden of oral disease include poverty, literacy levels, limited oral health education and promotion efforts, and lack of access to timely and affordable clinical oral health services.* In addition to poor living conditions, major risk factors relate to unhealthy lifestyles (e.g., poor diet and nutrition, oral hygiene, use of tobacco and alcohol, etc.) and limited availability and accessibility of clinical oral health services. Several oral diseases are linked to noncommunicable chronic diseases primarily because of common risk factors. Moreover, general diseases often have oral manifestations (e.g., diabetes or HIV/AIDS). Furthermore, many communities lack dental public health programs, face limited capacity for oral health services, and have inadequate facilities and an inequitable distribution of dental professionals.†
Safe and effective disease prevention measures do exist to improve oral health and prevent oral disease.† These preventive measures include population-based measures (e.g., community water fluoridation, tobacco cessation programs, and school-based dental sealant and fluoride programs), self-care (e.g., daily oral hygiene, healthy diets), and personal oral health services (e.g., clinical dental visits, examination for oral cancer).18–27 However, these measures are not consistently used by individuals or promoted by professionals and communities. In addition, several nations have not assured universal access to community preventive services such as community water fluoridation, salt fluoridation, school-based dental sealants, or oral health promotion in schools. For example, 31% of persons on public water supplies do not receive fluoridated water in the United States.28 Furthermore, 68% of 8-year-old children and 86% of 14-year-old adolescents have not received any dental sealants on a permanent molar tooth in the United States, according to the 1999–2004 National Health and Nutrition Examination Survey (NHANES).1,13 Preventive measures need to be adopted and applied by communities, individuals, and professionals to ensure marked improvements of the nation’s oral health.†
Social Impact of Oral Diseases
Oral diseases are progressive and cumulative and become more complex over time.11,12,23 These diseases can jeopardize physical growth, development, self-concept, and the capacity to learn. They influence eating and communicating.29 Oral diseases affect economic productivity and compromise a person’s ability to work at home or on the job or to concentrate in school.30,31
The social impact of oral disease is substantial.30,31 More than 51 million school hours are lost each year as a result of dental problems.11 Poor children experience nearly 12 times more restricted activity days than their counterparts from higher income families. Among those who lost school time, youngsters from low-income families, members of minority communities, and families without insurance missed more hours.30 Children with early childhood caries—often a severe and painful form of dental caries—can demonstrate failure to thrive and be underweight.32 Serious lifetime functional, aesthetic, and social consequences can be outcomes for children and adults with severe developmental and acquired oral and facial conditions.11 The Centers for Disease Control and Prevention (CDC) estimated that 16.2 years of life were lost per person who died prematurely of oral and pharyngeal cancer.11 This figure exceeds the average 15.4 years lost for all cancer sites.
Dental diseases in adults affect their economic productivity and compromise their ability to get jobs. Employed American adults lose more than 164 million hours of work each year because of dental disease or dental visits.11 Among those who miss work, women, African Americans, low-wage earners, employees with less education, and the uninsured miss the greatest number of hours. Employees of service industries lose from 2 to 3.5 times more hours of work than executives or professional workers.31
Oral diseases influence an individual’s ability to eat, communicate, and interact in society.29 The 2003–2004 NHANES evaluated oral health quality of life for the first time using a subset of seven Oral Health Impact Profile (OHIP) questions (e.g., the NHANES-OHIP among dentate adults aged 18 years and older as shown in Table 5-1).29 The survey found that 6.8% of dentate individuals reported painful aching in mouth fairly often or very often, whereas 12.7% indicated this occurred occasionally.29 Another 6.4% reported being self-conscious or embarrassed because of their teeth or mouth fairly often or very often, and 6.5% responded that this happened occasionally. Among adults, 5.6% reported that eating was uncomfortable fairly often or very often, and 11.2% stated occasional discomfort when eating foods because of problems with their teeth or mouth.
Table 5-1
| Individual Items from OHIP Questions* | Never, Hardly Ever (%) | Occasionally (%) | Fairly Often, Very Often (%) | Rank† |
| Painful aching in mouth | 80.4 | 12.7 | 6.8 | 1 |
| Life less satisfying | 89.7 | 5.7 | 4.6 | 5 |
| Difficulty doing usual job | 96.5 | 1.9 | 1.5 | 7 |
| Taste affected | 96.0 | 2.3 | 1.7 | 6 |
| Avoided particular foods | 84.1 | 9.8 | 6.1 | 3 |
| Uncomfortable to eat | 83.2 | 11.2 | 5.6 | 4 |
| Self-conscious or embarrassed | 87.1 | 6.5 | 6.4 | 2 |
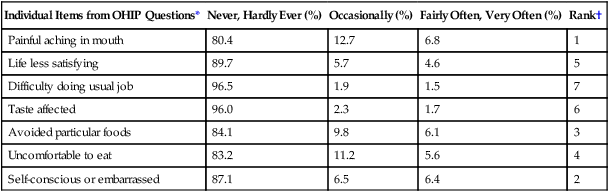
*US National Health and Nutrition Examination Survey (NHANES) 2003–2004 evaluated oral health quality of life for the first time using a subset of seven OHIP questions (e.g., the NHANES-OHIP).
†Presented in rank order of prevalence scores (e.g., percentage of adults reporting one or more items fairly often or very often).
A study supported by the WHO found that among Navajo schoolchildren living in parts of the Navajo reservation in Arizona and New Mexico, 25% avoided laughing or smiling and 20% avoided meeting other people because of the way their teeth looked. Because of dental pain, almost 25% of Navajo adults were unable to chew hard foods, and nearly 20% reported difficulty sleeping.33
Burden of Oral Diseases in the United States
Despite improvements in oral health status, profound oral health disparities remain in specific population groups in the United States.1,13,16 For some oral diseases and conditions, the magnitude of the differences in oral health status among population groups is striking.1,13 Oral health disparities are defined as differences in oral health status among population groups. Many different demographic and social characteristics are associated with oral health disparities. These factors include income, education, race/ethnicity, culture, geography (urban/rural), age, sex, disability status, behavioral lifestyles, and other factors. These factors reflect the diversity of the US population.
The burden of oral diseases is spread unevenly throughout the population.11–13 People who experience the worst oral health are found among the poor of all ages; poor children and poor older Americans are particularly vulnerable. Members of racial and ethnic minorities experience a disproportionate level of oral health problems. People who are medically compromised or who have disabilities are at greater risk for oral disease; in turn, oral diseases further jeopardize their overall health and well-being. This burden of oral disease restricts activities at school, work, and home and often significantly diminishes quality of life.
Oral Health Status and Trends
National benchmarks have been established to assess health in the United States through Healthy People.14,15 Tracking systems have been developed, and regular progress reports are used to monitor the attainment of the national oral health objectives.1,16 Tables 5-2 and 5-3 summarize the progress in reaching the Healthy People 2010 oral health objectives.1,14 The national trends reveal progress for some oral health indicators. Other oral health indicators showed little or no improvement during the 2000s.
Table 5-2
Progress in Meeting Healthy People 2010 Oral Health Objectives
| Number | Oral Health Objective | Age (year) | Baseline Data (%) | Trend Data (%) 2004* | Healthy People 2010 Goal (%) | Summary |
| 21.1 | Reduce dental caries experience in children | |||||
| a. Young children (primary teeth) | 2-4 | 18 | 24 | 11 | Reversed | |
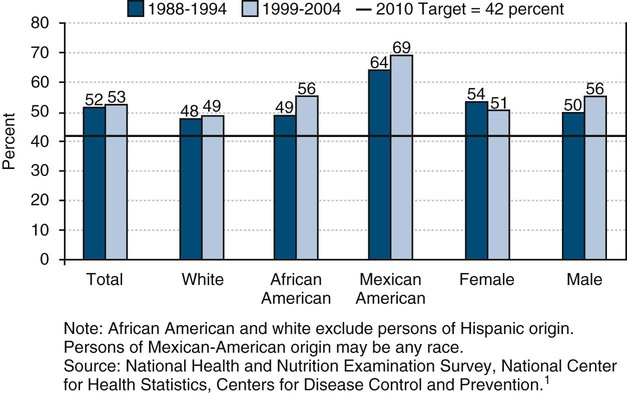
| b. Children (primary or permanent teeth) | 6-8 | 52 | 53 | 42 | Reversed | |
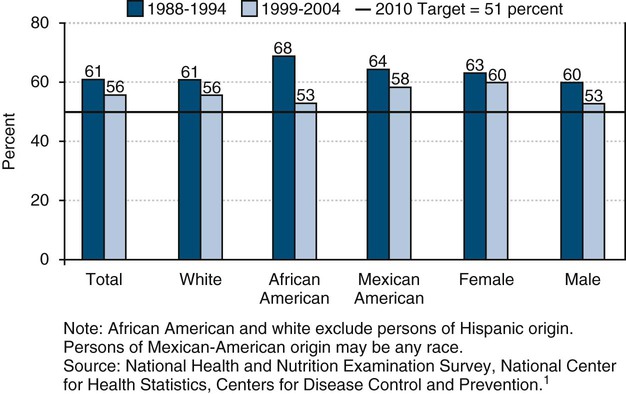
| c. Adolescents (permanent teeth) | 15 | 61 | 56 | 51 | Progress | |
| 21.2 | Reduce untreated dental decay in children and adults | |||||
| a. Young children (primary teeth) | 2-4 | 16 | 19 | 9 | Reversed | |
| b. Children (primary or permanent teeth) | 6-8 | 28 | 29 | 21 | Reversed | |
| c. Adolescents (permanent teeth) | 15 | 20 | 18 | 15 | Progress | |
| d. Adults (permanent teeth) | 35-44 | 27 | 28 | 15 | Progress | |
| 21.3 | Increase adults with teeth who have never lost a tooth as a result of dental caries or periodontal disease | 35-44 | 30 | 38 | 40 | Progress |
| 21.4 | Reduce adults who have lost all their teeth | 65-74 | 29 | 24 | 22 | Progress |
| 21.5 | a. Reduce gingivitis in adults | 35-44 | 48 | Data not analyzed | 41 | No trend available |
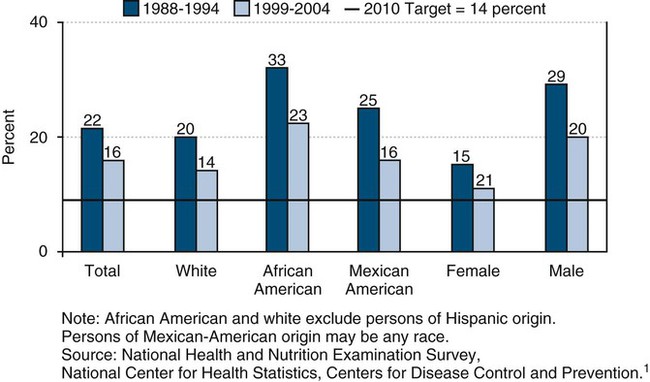
| b. Reduce destructive periodontal disease in adults | 35-44 | 22 | 16 | 14 | Progress | |
| 21.6 | Increase detection of stage 1 oral cancer lesions | All | 36 | 35 | 51 | Reversed |
| 21.7 | Increase number of oral cancer examinations | 40+ | 13 | Data not Available | 20 | No Trend Available |
| 21.8 | Increase dental sealants | |||||
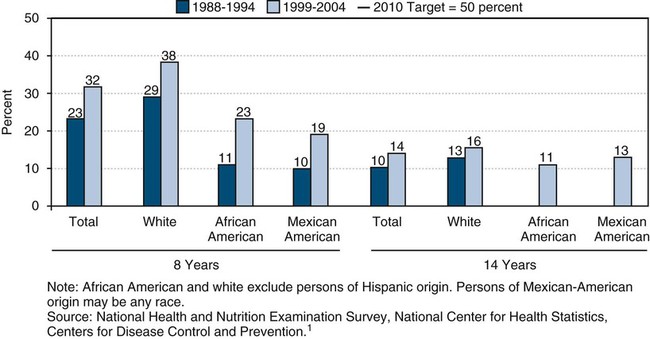
| a. Increase dental sealants for children | 8 (first molars) | 23 | 32 | 50 | Progress | |
| b. Increase dental sealants for adolescents | 14 (first and second molars) | 15 | 21 | 50 | Progress | |
| 21.9 | Increase persons on public water receiving fluoridated water | All | 62 | 69 (2006) | 75 | Progress |
| 21.10 | Increase use of the oral health care system | 2+ | 44 | 45 (2004) | 56 | Progress |
| 21.11 | Increase use of dental services for those in long-term facilities (e.g., nursing homes) | All | 19 | Data not available | 25 | No trend available |
| 21.12 | Increase preventive dental services for low-income youth | <19 | 25 | 31 | 66 | Progress |
| 21.13 | Increase number of school-based health centers with oral health component | |||||
| a. School-based health centers with oral health component: dental sealants | K-12 | 12 | 24 (2008) | 15 | Progress | |
| b. School-based health centers with oral health component: dental care | K-12 | 9 | 10 (2008) | 11 | Progress | |
| 21.14 | Increase number of community-based health centers with oral health components | All | 52 | 70 (2006) | 75 | Progress |
| 21.15 | Increase states with systems for recording and referring of children and youth with cleft lip and palate | All | 16 | 32 (2006) | 51 states | Progress |
| 21.16 | Increase number of states with state-based oral health surveillance systems | All | 0 | — | 51 states | No trend available |
| 21.17 | Increase the number of tribal, state, and local dental programs with public health–trained directors | |||||
| a. Increase the number of state and local dental programs with public health–trained directors | 39 | 51 (2006) | 41 | Progress | ||
| b. Increase the number of Indian Health Service and tribal dental programs with public health–trained directors | 9 | 10 (2006) | 9 | Progress | ||
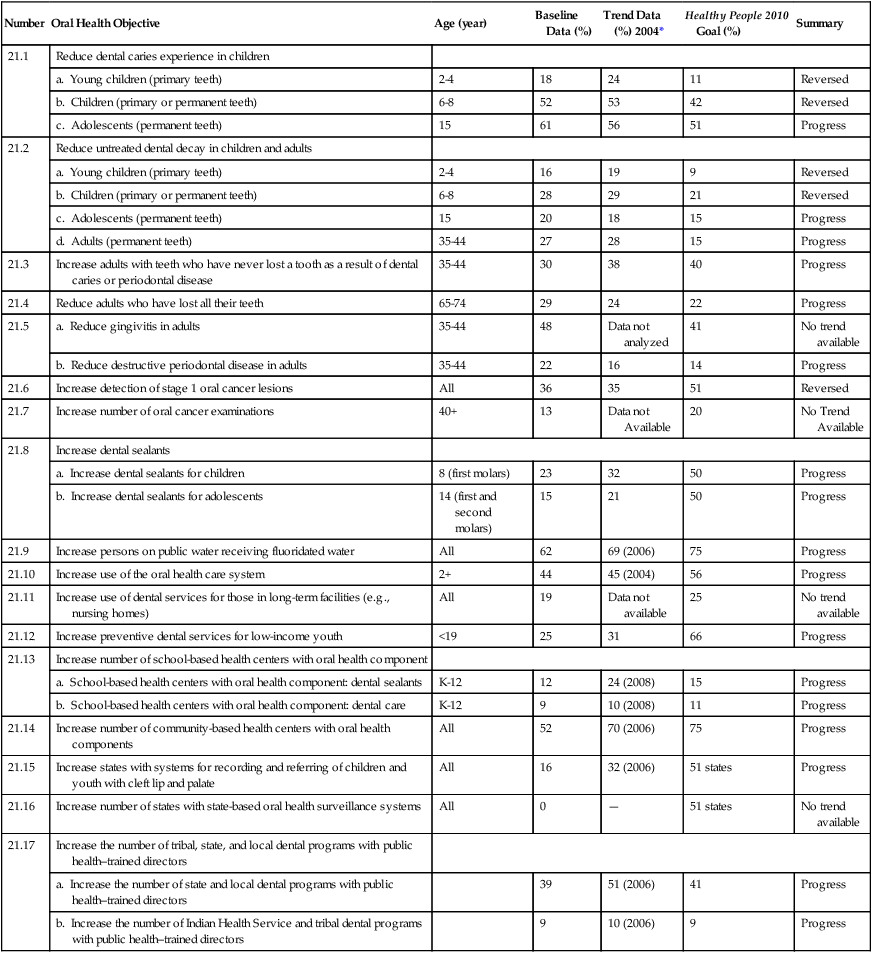
*Trend data from 2004 except where noted.
From Centers for Disease Control and Prevention, National Center for Health Statistics, US Department of Health and Human Services. Data 2010: The Healthy People 2010 Database, January 2010 version. Available at http://wonder.cdc.gov/data2010/. Accessed May 2010.
Table 5-3
Progress in Meeting Selected Healthy People 2010 Objectives Related to Oral Health
| Number | Oral Health Objective | Age (year) | Baseline Data (%) | Trend Data* (%) | Healthy People 2010 Goal | Summary |
| 01-8 | Increase racial and ethnic representation in dental education programs | |||||
| 01-8m. American Indian or Alaska Native | 0.5 | 0.3 | 1.0 | Reversed | ||
| 01-8n. Asian or Pacific Islander | 19.5 | 24.7 | 4.0 | Progress | ||
| 01-8o. Black or African American | 5.1 | 4.5 | 13.0 | Reversed | ||
| 01-8p. Hispanic or Latino | 5.3 | 6.3 | 12.0 | Progress | ||
| 03-6 | Decrease oropharyngeal cancer deaths | 2.7 | 2.7 (2006) | 2.4 | Progress | |
| 03-10 | 03-10c. Increase the number of dentists counseling about cancer prevention and tobacco cessation | 59 | No data available | 85 | No trend available | |
| 05-15 | Increase annual dental examination for persons with diabetes | 2 years and older | 56 | 56 (2008) | 71 | No change |
| 07-11 | 07-11t. Increase the number of local health departments that have established culturally appropriate and linguistically competent community oral health promotion and disease prevention programs | 25 | No data available | 50 | No trend available | |
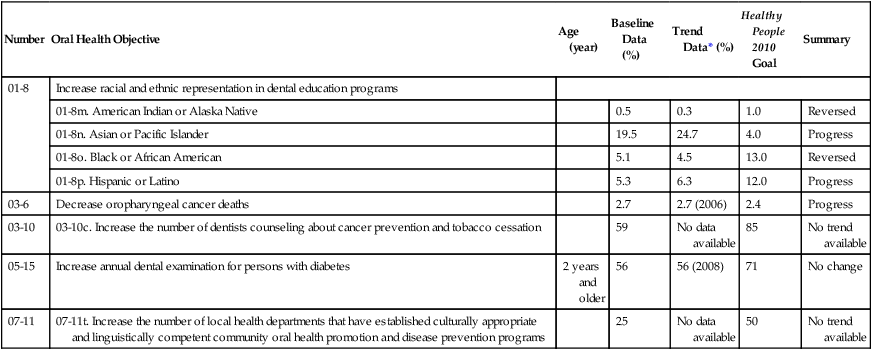
*Trend data from 2004 except where noted.
From Centers for Disease Control and Prevention, National Center for Health Statistics, US Department of Health and Human Services. Data 2010: The Healthy People 2010 Database, January 2010 version. Available at http://wonder.cdc.gov/data2010/. Accessed May 2010.
This chapter provides a broad overview of the status and trends associated with oral health. Status is the current state or condition, whereas a trend is the direction of a condition on a particular course over a period of time. The chapter concentrates on the national oral health indicators for the United States and focuses on the indicators included in Healthy People. Several surveys and data systems in the United States are used to track national oral health indicators.1,34,35 The following national surveys monitor key oral health indicators in the United States:
• National Health and Nutrition Examination Survey (NHANES)
The national oral health indicators used in Healthy People provide a framework for oral health assessments at the state and local levels. Also, states and localities conduct and use several surveys and data collection systems to monitor oral health including the Behavioral Risk Factor Surveillance Survey (BRFSS). State oral health indicators are included in state-based oral health surveillance systems and are integrated into the National Oral Health Surveillance System (NOHSS).36 In addition, national surveys have been conducted to monitor health and wellness indicators at the national and state level for children and children with special health care needs. These resources include the National Survey of Children’s Health and National Survey of Children with Special Health Care Needs.37 Progress in improving oral health will require diligent efforts to assess oral health, mobilize resources, and ensure that necessary oral health policies, programs, and services are in place and are received by individuals and communities across the United States.18–27,38,39
Dental Caries
Children and Adolescents
Despite a tremendous decline in dental caries in children in the United States since the 1950s, tooth decay remains the single most common chronic disease of childhood.11 It is five times more common than asthma and seven times more common than hay fever.11
Early childhood caries affects the primary teeth of infants and young children 1 to 5 years of age.15 Sometimes referred to as baby bottle tooth decay or nursing caries, it can be a devastating condition, often requiring thousands of dollars and a hospital visit with general anesthesia during treatment.40 Substantial pain, psychologic stress, health risks, and expense are associated with restorative care for children affected by early childhood caries.41 Infant feeding practices, in which children are put to bed with formula or other sweetened drinks and fall asleep while feeding, have been associated with this condition.41
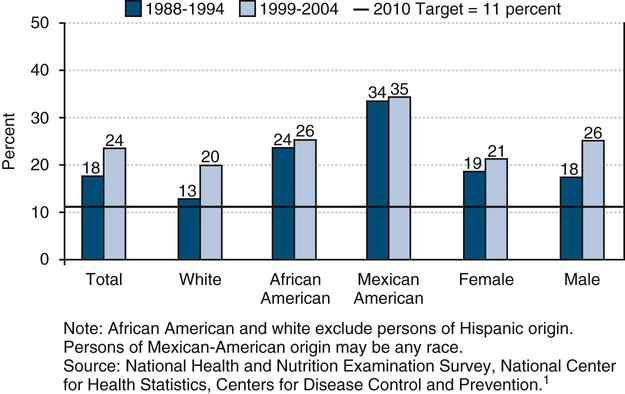
The average number of decayed and filled teeth (DFT) among 2- to 4-year-olds remained unchanged over the 25 years leading to 2000.15 According to the NHANES, 25% of young children 2 to 4 years of age experienced dental caries in their primary dentition during the years 1999–2004, which is an increase from 18% in 1988–1994.1,13 Of these children, 19% had untreated caries in their primary teeth. Eighty-one percent of these children were free of dental caries.
The prevalence of dental caries among school-age children declined within the United States in the 1980s and 1990s. The decline is the result of various preventive measures such as community water fluoridation and increased use of fluoride toothpastes and mouthrinses, as well as the application of dental sealants.11 But these improvements for children seemed to have stalled and for some indicators actually regressed in the 2000s.13 More than half (53%) of children aged 6 to 8 years experienced dental caries in their primary or permanent teeth in 1999–2004, according to the NHANES.1,13 This proportion has increased from 52% in the years 1988–1994.
The proportion of untreated dental caries in school-age children has plateaued overall.13 Twenty-nine percent of 6- to 8-year-olds had untreated dental caries in 1999–2004, up from 28% in 1988–1994.1,13 In the years 1988–1994, by the third grade, 60% of students had experienced tooth decay, and 33% of these third-graders had untreated dental caries.1
Caries experience is cumulative and thus is higher among adolescents than among young children.13 By age 15 years, nearly two thirds (56%) of teenagers had experienced dental caries in their permanent dentition, according to a national survey in 1999–2004.1,13 Forty-four percent of these teens were caries-free. In comparison, 61% of adolescents during the period 1988–1994 had experienced dental caries.1,13 In the years 1999–2004, 18% of teens 15 years of age had untreated tooth decay and were in need of treatment.1,13 This proportion has decreased slightly from 20% of teens with untreated dental caries in the period 1988–1994.13
As with general health, oral health status in the United States tends to vary based on social and demographic factors.42,43 Dental caries, however, remains a significant problem in specific populations, particularly among poor children and adults from certain racial and ethnic groups.1,11,13,44,45 Most tooth decay is experienced by only a few children.46 National data indicate that for those aged 2 to 5 years, 75% of dental caries in the primary dentition was found in 8% of the population.46 Also, for those 6 years and older, 75% of dental caries in the permanent dentition was found in 33% of the population.45
Children from minority racial and ethnic groups (e.g., American Indian, Alaska Native, Asian or Pacific Islander, Mexican American, and black or African American) whose parents have less than a high school education or who have a low income are often markedly at increased risk for dental caries.42–44 Minority children 2 to 4 years of age in the United States are more likely to experience dental caries than white children.1,13 Also, preschool-age African-American and Mexican-American children have more untreated tooth decay compared with their white peers.1,13 America’s youngest and poorest children, aged 2 to 4 years and living below the poverty level, have more than 2 times as much dental caries as children of higher-income families (>200% federal poverty level).1,13
Also, the level of untreated dental caries among African-American children aged 6 to 8 years (37%) and Mexican-American children (41%) was greater than for white children (25%) in the United States in 1999–2004.1,13 A statewide oral health survey in California found 69% of Asian or Pacific Islander children 6 to 8 years of age had dental caries in 1993–1994.15 In 1999, the oral health survey of Native Americans reported that 71% of American Indian or Alaska Native children 6 to 8 years of age had untreated dental caries.15 Oral health disparities for dental caries are also found among adolescents in the United States. Oral health disparities for dental caries among children and adolescents are shown in Figures 5-1 to 5-3.
Young and Older Adults
In 1999–2004, 92% of dentate adults 20 to 64 years of age and 93% of dentate older adults 65 years of age and older had experienced dental caries.1,13 According to NHANES 1999–2004, 32% of persons aged 65 to 75 years with teeth had experienced root caries (decayed or restored).13 Also, 42% of people 75 years and older had root caries.13 Approximately 28% of adults 35 to 44 years of age had untreated dental caries in 1999–2004.1,13
Findings from NHANES 1999–2004 showed disparities in dental caries among adults, with 40% of African-American and 40% of Mexican-American adults 35 to 44 years of age with untreated tooth decay compared with 23% of white adults.1,13 In the same national survey, nearly three times as many young adults (35 to 44 years of age) with less than a high school education (50%) had untreated dental caries than did adults with some college education (16%).1,13 Untreated dental caries can lead to pain, abscesses, extensive dental treatment, extractions of teeth, and costly dental care. As the trends in aging continue, adults will lose fewer teeth as they age but will have more teeth that are at risk for dental caries throughout life.11
Community Preventive Services
Dental Sealants
Dental sealants can be very effective in preventing dental caries on the pit and fissure surfaces of teeth, but few children receive them.1,13,20,24a The percentage of school-age children with dental sealants has risen among specific groups in recent years as the public and private sectors increasingly provide this preventive measure, dental insurance pays for dental sealants, and parents request sealants for their children.20,24a Despite the effectiveness of dental sealants, only 32% of children 8 years of age and 21% of adolescents 14 years of age in the United States received dental sealants in 1999–2004.1,13 Disparities in dental sealants have been shown among children based on race and ethnicity. In 1999–2004, 38% of white children 8 years of age had received sealants compared with 23% of their African-American and 19% of their Mexican-American peers had dental sealants.1,13 This same survey found 23% of white adolescents 14 years of age had a dental sealant compared with 10% of their African-American and 18% of their Mexican-American counterparts.1,13 Also, disparities for dental sealants have been shown for family income and parental education.1,13 As few as 21% of poor 8-year-old children had dental sealants, in contrast to 42% of children from families with higher income levels, according to NHANES 1999–2004.1,13
In 1990, the NHIS found that 23% of adults in the United States reported that dental sealants prevented dental caries.47 Hispanic adults (12%), African-American adults (12%), and adults with less than a high school education were less likely to know the purpose of dental sealants than white adults (25%).47 Figure 5-4 illustrates disparities for dental sealants among children 8 years of age and adolescents 14 years of age.
Community Water Fluoridation
Community water fluoridation is a cornerstone community preventive service in the United States.18,38 During the second half of the twentieth century, a major decline in the prevalence and severity of dental caries resulted from the use of fluorides as an effective method of preventing caries.11 Fluoridation of the public water supply is the most equitable, cost-effective, and cost-saving method of providing fluoride to the community.48 Community water fluoridation is an effective, safe, and inexpensive way to prevent dental caries.48 This method of fluoride provision benefits Americans of all ages and socioeconomic status. Fluoridation, which was started in Grand Rapids, Michigan, in 1945, has been used successfully for half a century in the United States as it benefits both children and adults. Communities with fluoridated drinking water in the United States, Australia, Britain, Canada, Ireland, and New Zealand show striking reductions in tooth decay—those with fluoridated drinking systems have 15% to 40% less tooth decay.48 Because of these results, the CDC identified community water fluoridation as one of the 10 great public health achievements of the twentieth century and signifies it as a major contributor to the dramatic decline in dental caries over the past 55 years.49
A Healthy People 2010 oral health objective is to increase to 75% the proportion of the US population served by community water systems who receive optimally fluoridated water.15 The CDC analyzed fluoridation data for the period 1992 through 2006 from the 50 states and the District of Columbia to update reports on fluoridation in the United States and describe progress toward the Healthy People 2010 oral health objective.28 The results showed that the percentage of the US population served by community water systems who received optimally fluoridated water increased from 62% in 1992, to 65% in 2000, and 69% in 2006, and those percentages varied substantially by state.28 Overall, approximately 184 million persons served by community water systems received fluoridated water; of that number, approximately 8 million persons received water with sufficient naturally occurring fluoride concentrations.28 Approximately 88% of Americans receive their household water through a community system (the rest use well water), yet more than one quarter do not have access to optimally fluoridated water.
Public health officials and policymakers in states with lower percentages of residents receiving optimal water fluoridation should expand their efforts to promote fluoridation of community water systems to prevent dental caries.2,18,28,38 State-specific percentages in 2006 ranged from 8% in Hawaii to 100% in the District of Columbia (median: 77%).28 In 2006, the Healthy People 2010 target of 75% had been met by 25 states and the District of Columbia.28 During 1992–2006, 39 states reported increases in the percentage of their populations served by community water systems who received optimally fluoridated water; percentage-point increases ranged from 0.3 in Alabama to 69.9 in Nevada (median: 6.2).28 Ten states had decreases as percentage-point decreases ranged from 0.2 in Kentucky and North Dakota to 17.0 in Idaho (median: 4.3).
In 2006, 25 states did not meet the national benchmark, based on Healthy People 2010 objectives, of providing fluoridated water to 75 percent of their population on community water systems. In nine states—California, Hawaii, Idaho, Louisiana, Montana, New Hampshire, New Jersey, Oregon and Wyoming—the share of the population with fluoridated water had not reached even 50%.28 The CDC updated its fluoridation statistics recently, and the new data were expected to be published in 2010.50 The newer data should reflect additional progress in the past decade and gaining on the Healthy People 2010 national oral health objective for community water fluoridation. These achievements are because of a state law in California that has produced expansions of community water fluoridation in cities including Los Angeles and San Diego.50 Also, the updated data are expected to show that states, such as Delaware and Oklahoma, close to the national goal in 2006 now have met the 75% benchmark for Healthy People 2010. Of the 50 largest cities in the United States, 42 have community water fluoridation (and two cities have natural fluoride levels that are optimal).48 The largest cities in the United States not benefiting from community water fluoridation include Long Island, NY; San Jose, CA; Honolulu; suburbs of Philadelphia; Bergen and Hudson Counties, NJ; Tucson, AZ; Portland, OR; and Fresno, CA.
The annual cost of fluoridation is approximately 50 cents per person in communities of 20,000 or more to approximately $3.00 per person in communities with 5,000 or less (in 1995 dollars) for all but the smallest water systems. Community water fluoridation saves money for families and the health care system.51 A 2001 CDC study estimated that for every $1 invested in water fluoridation, communities save $38 in dental treatment costs.52 It has been proposed that $1 billion could be saved every year if the remaining water supplies in the United States, serving 80 million persons, were fluoridated in the near future.
According to a national survey of adults in 1998, 70% of respondents indicated that water supplies should be fluoridated in communities.53 In 1990, only 62% of adults had recognized that the primary purpose of water fluoridation is to prevent dental caries. Persons with lower levels of education, Hispanic adults, and African-American adults were less likely to know the purpose of water fluoridation.54 When asked to identify the best method of preventing dental caries, only 7% of adults considered fluoride the correct answer, and 70% indicated toothbrushing and flossing to be the most effective.47
Periodontal Diseases
During the period 1988–1994, nearly half (48%) of adults 35 to 44 years of age had gingivitis (inflammation of the gums).1 This figure represented an increase from the 41% of young adults with gingivitis in 1985–1986.55 Periodontal diseases will probably remain a consideration in the future as tooth loss from dental caries declines and more adults retain their permanent dentition.15
Destructive periodontal disease (defined as loss of attachment of 4 mm or greater) affected 16% of dentate adults 35 to 44 years of age in 1999–2004.1,13 The incidence of this problem declined among young adults from 22% in 1988–1994.1,13 Destructive periodontal disease seemed to increase with age, according to the most recent NHANES.11
Gingivitis occurred frequently among American Indians, Alaska Natives, Mexican Americans, adults with low incomes, and adults with less than a high school education.1,11 Among certain population groups, the prevalence of destructive periodontal disease was higher. In 1999–2004, 23% of African-American, 16% of Mexican-American, 14% of white adults (35 to 44 years of age) had destructive periodontal disease.1,13 In addition, gender differences were found in the same survey, with 12% of female adults and 20% of male adults (35 to 44 years of age) with destructive periodontal disease.1,13 In addition, disparities for destructive periodontal disease have been shown among American Indian and Alaska Native adults, adults with low family incomes, adults with less than a high school education, and individuals smoking currently.1,11 At all ages, more severe periodontal disease is seen among males and adults at the lowest income levels.11 Figure 5-5 describes the disparities for destructive periodontal disease.
Tooth Loss
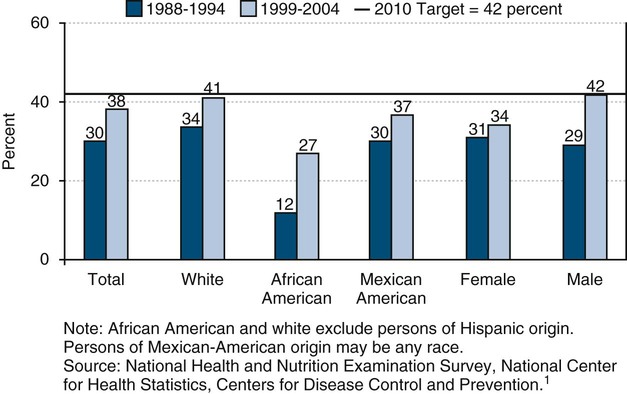
Fewer adults are undergoing tooth extraction because of dental caries or periodontal disease. The percentage of people who have lost all of their natural teeth has been declining over the past half century.11 Of adults 35 to 44 years of age, 38% had never lost a permanent tooth during the period 1999–2004.1,13 Differences were found by gender, as males (42%) were more apt to have permanent tooth loss than females (34%).1,13 White adults (41%) and Mexican-American adults (37%) were less likely to have any loss of permanent teeth compared with African-American (27%) adults (35 to 44 years of age) in 1999–2004.1,13
Approximately 24% of the American population aged 65 to 74 years was edentulous (i.e., have lost all of their natural teeth) in 1999–2004.1,13 Among persons aged 65 to 74 years in 1999–2004, 43% of persons with less than a high school education were edentulous compared with 11% of persons with at least some college.1,13 In this same age group, edentulousness was also higher among older African-American (26%) than among white (23%) and Mexican-American (18%) older adults.5 Disparities related to tooth loss are shown in Figure 5-6.
Oral and Pharyngeal Cancer
Oral and pharyngeal cancers include different malignant tumors that affect the oral cavity and pharynx and are largely a preventable type of cancer.56,57 Most of these tumors are squamous cell carcinomas.56,57 These may include cancers of the lip, tongue, floor of the mouth, palate, gingival and alveolar mucosa, buccal mucosa, and oropharynx.57 The American Cancer Society estimates that in 2010, 36,540 people will be found to have oral and pharyngeal cancers and 7880 persons will die of these cancers in the United States.2 These cancers occur more frequently than Hodgkin lymphoma, and cancers of the brain, cervix, ovary, liver, bone, testis, and stomach.2 Oral cancer accounts for 3% of all cancers diagnosed among males annually in the United States.2
Oral cancer rates have increased approximately 15% from the mid-1970s until 2004, according to the National Cancer Institute (NCI) survey.58 There are significant disparities in some population groups, with higher rates of increase in minority men. Overall, 10.5 adults per 100,000 will develop oral cancer.2 Oral cancer today occurs more often in males than in females with incidence rates more than twice as high in men as in women.2,57,58 Oral cancer rates are significantly higher for males (15.5 per 100,000) than for females (6.1 per 100,000). Incidence has been declining in men since 1975 and in women since 1980, although recent studies have shown that incidence is increasing for those cancers related to human papillomavirus (HPV) infection.2,57,58 Age is also a factor, as oral cancer rates tend to increase with age. The increase becomes more rapid after age 50 and peaks between 60 and 70 years of age.2,57,58
Disparities related to oral and pharyngeal cancers have been shown in national reports.2,57,58 The occurrence of oral and pharyngeal cancers varies by race and ethnicity.2,57,58 Oral cancer rates are higher for specific groups of males. African-American and white males have 17.2 and 15.7 new cases of oral and pharyngeal cancers per 100,000 per year, respectively, whereas Asians or Pacific Islanders, American Indian and Alaska Natives, and Hispanics have 10.9, 9.7, and 9.2 new cases per year, respectively, according to the Surveillance, Epidemiology, and End Results (SEER) Program, 2008.58 In the United States, oral and pharyngeal cancers constituted the ninth most common cancer among all men and sixth most common cancer among African-American men.36
An estimated 7880 deaths from oral cavity and pharynx cancers are expected in 2010.2 Death rates have decreased by more than 2% per year since 1980 in men and since 1990 in women.2 In addition, oral and pharyngeal cancer deaths (per 100,000) differ among population groups.1 In 2006, oropharyngeal cancer deaths for the overall population were 2.5 per 100,000, whereas they were 3.8 for males and 1.4 for females.1 Differences among racial and ethnic groups were shown in 2006, with 3.2 oropharyngeal cancer deaths per 100,000 for African Americans, 2.4 for whites, 2.1 for American Indian and Alaska Natives, 2.0 for Asians and Pacific Islanders, and 1.5 for Hispanics.1 Differences were shown by education level with 4.3 per oral and pharyngeal cancer deaths per 100,000 with less than a high school education compared with 2.5 for high school graduates and 1.0 for individuals with at least some college education.1
The NCI reported that oral cancer survival rates have increased approximately 15% from the mid-1960s until 2003.58 In spite of this improvement, significant disparities remain in some population groups. Disparities in survival rates between white and black males have remained throughout this time period. For all stages combined, about 83% of persons with oral cavity and pharynx cancer survive 1 year after diagnosis.2 Overall, 60% of persons with the diagnosis of oral cancer are alive 5 years after the diagnosis. Oral cancer survival rates are significantly lower for African Americans.58 The 5-year survival rates for oral cancer are 61% for white males, 64% for white females compared with 35% for African-American males and 54% for African-American females.58
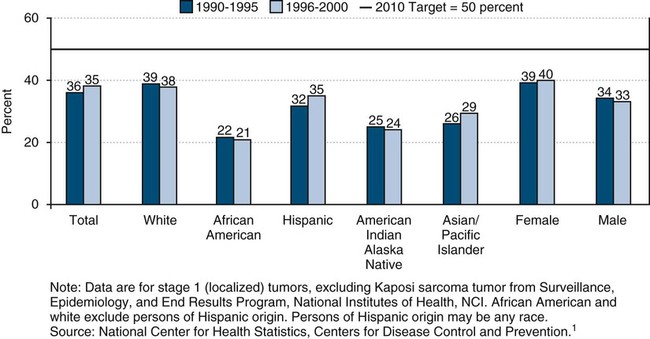
Diagnosing oral cancer at an early stage significantly increases 5-year survival rates. Only 35% of all individuals with oral and pharyngeal cancers were diagnosed at an early stage in 2000.1 The rate is 40% for females and 33% for males.1 Disparities by race and ethnicity have been reported, with only 21% of African Americans and 24% of American Indian and Alaska Natives having their oral cancer detected at the earliest stage compared with 29% of Asians and Pacific Islanders, 35% of Hispanics, and 37% of whites.1 African-American males have experienced increases in both death rates and new case rates, and their 5-year survival rate is much poorer than that for whites (35% versus 61%).58 African-American males have the highest incidence of and the lowest survival rates from oral and pharyngeal cancers. At every stage of diagnosis, the survival rate for African Americans is lower compared with other groups.58
Only 13% of adults (40 years of age and older) in the United States reported ever having an oral cancer examination, according to the most recent data reported from the NHIS in 1998.1 Males (12%) were less likely to receive an annual oral cancer examination compared with females (14%).1 Respondents who were more likely to have had an oral cancer examination included those with at least some college education (19%), whereas those with less than a high school education (5%) and high school graduates (10%) were less apt to report an examination for oral cancer.1 Also, disparities for receipt of an annual oral cancer examination were noted for individuals based on race and ethnicity. Only 6% of Hispanic/Latinos and 7% of African Americans had an oral cancer examination, whereas 12% of Asians and Pacific Islanders and 14% of whites received an oral examination.1
Known risk factors for oral cancer include all forms of smoked and smokeless tobacco products and excessive consumption of alcohol. Combinations of tobacco and alcohol represent substantially greater risk factors than either substance consumed alone. Many studies have reported a synergism between smoking and alcohol use, resulting in a thirtyfold increased risk in individuals who both smoke and drink heavily.51,59 The vast majority of oral cancers are attributed to the use of tobacco (smoked and smokeless tobacco) and alcohol use.2,59 Those who chew tobacco are at high risk for oral lesions that can lead to oral cancer.2,57 In 2005, 21% of adults smoked cigarettes, 2.3% used smokeless (“spit”) tobacco, 2.2% smoked cigars, and 0.5% smoked pipes.1 Twenty-six percent of high school students reported using tobacco in the past month; of these students, 20% smoked cigarettes, 14% smoked cigars, 8% used spit tobacco, and 2.9% smoked bidis in 2006.1 Other factors that can place a person at risk for these cancers are viral infections, immunodeficiencies, poor nutrition, exposure to ultraviolet light (a major cause of cancer to the lips), and certain occupational exposures.2,57 Human papillomavirus (HPV) infection is associated with certain types of oropharyngeal cancer.51,57
Overall, levels of knowledge about risk factors for oral cancer are low. In 2002, a statewide telephone study assessed awareness of oral cancer, knowledge of its major risk factors and clinical signs, and oral cancer examination experiences among Florida adults aged 40 years and older.60 In Florida, 15% of adults 40 years of age and older had never heard of oral cancer and another 40% reportedly knew little or nothing about it.60 About 50% of adults did not think oral white or red patches or bleeding could indicate oral cancer and 28% correctly identified three of the major risk factors for oral cancer.60 After hearing an oral cancer examination described, only 19% of adults reported receiving one within the past year.60 African-American and Hispanic individuals were significantly less likely than white respondents to have received a recent oral cancer examination.60 Persons with low levels of education, those who lacked a regular dentist or source of preventive medical care, and adults who knew few or none of the clinical signs of oral cancer also were less likely to have received a recent oral cancer examination.60
There was extensive misinformation and a general lack of knowledge among adults about the signs, symptoms, and risk factors for oral and pharyngeal cancers in Florida. According to the NHIS in 1990, similar gaps in knowledge were reported among racial and ethnic groups, as well as disparities in frequency of recent visits for dental and medical care were identified nationally.61 This lack of awareness and knowledge in adults regarding oral cancer and low levels of reported examination is a major concern and this is particularly crucial among groups experiencing disproportionately high incidence and late stage diagnosis for oral cancer. Increasing awareness of this disease and promoting primary and secondary prevention is essential to lessen the oral cancer burden and reduce disparities in its outcomes. Consideration needs to be given to income levels, education, availability of proper health care, and use of tobacco and alcohol by different population groups when examining disparities related to oropharyngeal cancers. Figure 5-7 shows a comparison of the disparities related to early detection of oral and pharyngeal cancers based on race and ethnicity.
Other Oral Conditions
Cleft Lip and Cleft Palate
Cleft lip with or without cleft palate is one of the more common birth defects in the United States.62 Cleft lip and/or palate can be isolated or one component of an inherited disease or syndrome.62 Both genetic and environmental factors contribute to oral clefts. Although clefts can be repaired to varying degrees with surgery, researchers are working to understand the developmental processes that lead to clefting and how to prevent the condition or more effectively treat it. The lifetime cost of providing care to children born each year with cleft lip or cleft palate is estimated to be $697 million.58
Currently, there is a lack of national data for cleft lip or palate. The National Birth Defects Prevention Network (NBDPN) collects cleft lip and palate data annually from 11 states (Alabama, Arkansas, California, Georgia, Hawaii, Iowa, Massachusetts, North Carolina, Oklahoma, Texas, and Utah), which provides a means for estimating national data.58 The average prevalence of cleft lip and palate was estimated as 6.39 per 10,000 live births for cleft palate and 10.48 per 10,000 live births for cleft lip with or with cleft palate.58 The annual number of births affected each year in the United States was 2567 with cleft palate and 4209 with cleft lip with or without cleft palate, 1999 to 2001.58
States should have an efficient mechanism in place for identification, recording, referral, and follow-up of infants with oral clefts and craniofacial anomalies for treatment. Of 50 states plus the District of Columbia, 32 reported referral and reporting systems for children and youth with a cleft lip and/or palate in 2006.1 Care by a multidisciplinary team has been shown to be an effective approach in providing services for people across the lifespan with craniofacial anomalies. Thus continued access to an integrated health care system is essential for children and adults to received necessary dental and health care services.
Malocclusion
It was found that 9% of persons 8 to 50 years of age had severe crowding of the anterior incisors and 25% had no crowding in a national survey with the latest published findings.63 Approximately 9% of persons had a posterior crossbite, and this condition was most common in whites. Severe overbite was found in 8%, and a similar percentage had a severe overjet. Fewer than 5% of whites had an open bite. Findings from the NHANES were reported in the literature where children and adults were shown to have different rates and types of malocclusions that may benefit from orthodontic care.64
Craniofacial Injuries
Injuries to the head, face, and teeth are common. A national survey found that of all persons 6 to 50 years of age, 25% had sustained an injury that resulted in damage to one or more anterior teeth.65 Incisal trauma data was collected in NHANES during 1999–2004. Incisal trauma is defined as a traumatic injury affecting either an upper or lower permanent incisor.
A recent report provided summary findings about incisal trauma among children 6 to 19 years of age from NHANES.13 In 1988–1994, 9% of children 6 to 11 years of age had incisal trauma compared with 7% in 1999–2004.13 For these children in 1999–2004, incisal trauma in the maxillary arch (6%) was more likely to occur than incisal trauma in the mandibular arch (1%). Groups indentified to have a greater rate of overall/>
Stay updated, free dental videos. Join our Telegram channel
VIDEdental - Online dental courses


