CHAPTER 3 THE U.S. DENTAL CARE DELIVERY SYSTEM AND MANAGED CARE: AN OVERVIEW
This chapter provides an overview of the U.S. dental care delivery system. It is not intended to be a thorough review of the system but rather a brief description of its main components.
DENTAL EDUCATION
The typical education and training of dentists in the United States consists of (1) a college degree (4-year predental program) and (2) an undergraduate dental education (4-year program with emphasis in basic sciences during the first 2 years and clinical sciences in the last 2 years).1 Graduates of such a program, once they pass a state or regional license examination, are permitted to practice dentistry in specific states.
Progress in biomedical sciences and the desire to effectively meet the ever-changing dental needs of the American people has led to the division of labor in the dental care delivery system. This division of labor, on the one hand, has led to the creation of allied professions (e.g., dental hygienist, dental assistant, laboratory technician) that require fewer years of education and training and, on the other hand, to postgraduate dental training and specialization. More specifically, today only approximately 42% of dental school graduates practice dentistry immediately (general practitioners); 29% receive postgraduate training in general dentistry (Advanced Education in General Dentistry [AEGD], General Practice Residency [GPR]); and the remaining 29% enter one of the eight recognized dental specialties.1
Proposals to correct these and other shortcomings of the dental education system are contained in the Pew Commission report, the Institute of Medicine report, and more recently in the advocacy of the “oral physician.”2–4 A consequence of these proposals would be an increase of at least 1 year in dental education.
ALLIED DENTAL PERSONNEL
The other two major allied dental health professions are dental assisting and dental laboratory technologists. These occupations are not state-licensed professions, but graduates of accredited programs are certified. In 1996 201,400 dental assistants and 54,000 dental laboratory technologists were active in practice. Dental assistants work under the direct supervision of dentists, assisting them with the equipment and materials used in patient care. In contrast, most dental laboratory technologists work in independent dental technology laboratories, constructing prostheses based on dentists’ prescriptions. Some large dental practices employ their own dental laboratory technologists.
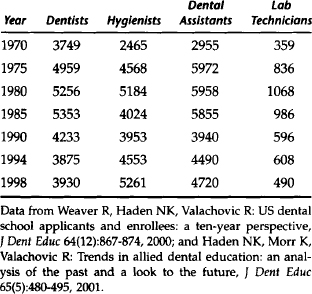
The broader dental education system produces approximately 3900 dentists, 4500 dental hygienists, 4500 dental assistants, and 600 laboratory technicians per year, though these numbers have fluctuated significantly over the years (Table 3-1).
STRUCTURE AND ORGANIZATION OF THE DENTAL CARE DELIVERY SYSTEM
Characteristics of Dentists
The trends in dental education and increases in population and income over time have led to an increase in dental manpower. The most recent available data (Table 3-2) indicate that in 1998 the total number of dentists in the United States was 183,000 whereas the number of active private practitioners was 138,449 (less than 76% of the total). Table 3-2 indicates that the number of people per active private practitioner was 1952. It is estimated that the dentist/population ratio was approximately 58 per 100,000 in 2000 and will be 47 per 100,000 by 2020. According to these estimates, the absolute number of active dentists started to decline in 2001.5
Table 3-2 Number of Dentists, Population, and Population/Dentists Ratio in the United States 1998
| Category of Dentist | Percent | Number |
|---|---|---|
| Total number of dentists | 100.00 | 183,000 |
| Professionally active dentists | 81.61 | 149,350 |
| Active private practitioners | 75.66 | 138,449 |
| Male | 86.36 | 119,565 |
| Female | 13.64 | 18,884 |
| Population | 270,299,000 | |
| Population/active private practitioners | 1,952 |
From American Dental Association: Distribution of dentists in the United States by region and state, 1998, Chicago, 2000, The Association.
Another important trend is the changing gender of the dentist workforce. The number of female dentists is increasing rapidly and accounted for almost 14% of the total number of active private practitioners in 1998.6
Table 3-3 shows the distribution of active dentists in private practice by specialty. General practitioners account for approximately 80% of practitioners. This 80/20 split between general practitioners and specialists is the opposite of that in medicine.
Table 3-3 Distribution of Active Private Practitioners by Specialty in the United States, 1991
| Dental Specialty | Percent | Number |
|---|---|---|
| General practitioner | 81.51 | 112,564 |
| Specialist | 18.49 | 25,530 |
| Oral and maxillofacial surgeon | 3.76 | 5,188 |
| Endodontist | 1.86 | 2,567 |
| Orthodontist | 6.04 | 8,342 |
| Oral pathologist | 0.08 | 108 |
| Public health dentist | 0.18 | 244 |
| Prosthodontist | 1.68 | 2,323 |
| Periodontist | 2.76 | 3,810 |
| Pediatric dentist | 2.13 | 2,948 |
| total | 100.00 | 138,094 |
Data from American Dental Association: Distribution of dentists in the United States by region and state, 1991, Chicago, 1993, The Association.
Table 3-4 presents the distribution of active practitioners across the nine regions of the country. Dentists are in every area, but significant variation in the number of people per dentist among regions exists. The primary determinants of the number of dentists in an area are population and per capita income.7
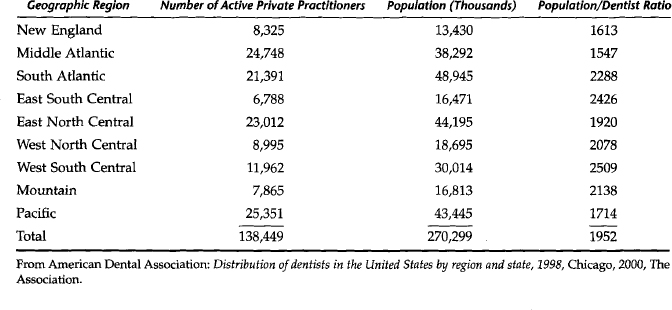
Table 3-5 shows the age distribution of active private practitioners. This table carries an important message regarding the future supply of dental manpower. In the next 10 to 20 years the number of retiring dentists will outpace the new entrants into the profession.
Table 3-5 Age Distribution of Active Private Practitioners in the United States, 1998
| Age of Dentist | Number of Dentists | Percent of Total |
|---|---|---|
| <35 | 18,274 | 13.2 |
| 35–44 | 41,946 | 30.3 |
| 45–54 | 43,054 | 31.1 |
| 55–64 | 22,703 | 16.4 |
| 65+ | 12,459 | 9.0 |
| Total | 138,436 | 100.0 |
From American Dental Association: Distribution of dentists in the United States by region and state, 1998, Chicago, 2000, The Association.
Characteristics of Dental Practices
Table 3-6 indicates that dentists are organized in small-size practices. In fact, almost 96% of all dental practices consist of one-dentist (82.6%) or two-dentist (13.3%) practices. Approximately 4% of all dental practices are considered group practices: three or more dentists who share expenses or revenue. Given that this pattern of dental practice size has persisted for many years, it strongly suggests lack of significant economies of scale with larger practice size. This and additional evidence seem to run contrary to conventional wisdom that larger practices are more efficient than smaller practices.8
Table 3-6 Distribution of Active Private Practitioners and Dental Practices by Size
| Size of Practice | Percent of All Dentists | Percent of All Practices* |
|---|---|---|
| One dentist | 65.8 | 82.6 |
| Two dentists | 21.1 | 13.3 |
| Three or more dentists | 13.1 | 4.1 |
* The total number of practices (110,230) was estimated assuming that the mean number of dentists in the category “three or more dentists” is four.
From the 1998 survey of dental practice, ADA, March 2000.
Table 3-7 offers additional evidence of the relatively small size of dental practices. This table shows the square feet of office space, number of operatories, and number of auxiliary staff members in an average dental practice. It also gives the frequency of use of specific units of equipment. Table 3-8 provides further details regarding the frequency and number of specific types of auxiliary staff members employed by dental practices. Although the average dental practice employs four auxiliaries, the number varies from zero to more than seven auxiliary staff members (Table 3-9).
Table 3-7 Mean Office Space, Number of Operatories, Number of Auxiliaries, and Office Equipment, All Active Private Practitioners, 1998
| Square feet of office space | 1,755 |
| Number of operatories | 4.4 |
| Number of auxiliaries | 4.2 |
| Dental office equipment* | % using |
| 1. Composing light curing unit | 92.6 |
| 2. High speed air handpiece with fiberoptics | 71.2 |
| 3. Panoramic X-ray unit | 54.1 |
| 4. Ultrasonic scaling unit | 86.8 |
| 5. Electrosurgical unit | 45.1 |
| 6. Nitrous oxide analgesic equi/> |
Stay updated, free dental videos. Join our Telegram channel
VIDEdental - Online dental courses


