19
Alternative Imaging Systems in Endodontics
The primary objective of any alternative technique for morphological imaging of the maxillary bones and of the teeth, which is of importance to the endodontic field, is to detect the pathologic structures. It is also important to ascertain the exact anatomical relations of a pathologic structure with the surrounding tissues. Furthermore, the imaging procedure should yield information (if possible) on the histopathology of a lesion in order to enable a differential diagnosis and the selection of adequate therapeutic measures (Cotti, 2010; Patel et al., 2009).
The development of noninvasive and therefore safer (Berrington de Gonzalez and Darby, 2004) imaging technology (which does not use ionizing radiation) such as ultrasound real-time echotomography and magnetic resonance imaging (MRI) have revolutionized pathomorphological diagnosis in many cases, permitting precise location and delineation of a lesion (Cotti and Campisi, 2004).
Ultrasound Real-Time Echotomography
General Concepts on Ultrasound Real-Time Echotomography
The first application of acoustic echoes for object localization took place under water in search for the wreck of the Titanic in 1912. Seventy years ago Dussik introduced the use of ultrasounds as a diagnostic tool in the medical field to evaluate a cerebral pathosis (Auer and Van Velthoven, 1990).
Since that far, 1942 diagnostic ultrasounds have gained more and more importance, and nowadays, there is no diagnostic field in medicine in which ultrasonic imaging does not find a specific indication.
Ultrasound real-time echotomography is also called echography: the exam is based on the piezoelectric effect and on the reflection of ultrasound (US) waves called “echos.” When a synthetic ceramic crystal is placed into an electric field, the electrons cause a sudden change in the structure of its grid: growth or shrinkage. This structural change emits mechanical energy in the form of sound waves. Each crystal distributes waves at one frequency depending on the alternating current it is exposed to (i.e., a crystal exposed to a 5 MHz alternating current will create sound waves oscillating at a frequency of 5 MHz). US waves for diagnostic purposes are mostly generated employing frequencies ranging from 1.6 to 20 MHz.
The synthetic crystal can also transform a US wave back to an electromagnetic wave. The crystal sends the US waves in all directions; therefore, they are bundled to a focal zone by means of an acoustic lens. The US waves oscillating at the same frequency are sent toward the biologic tissues via the ultrasonic probe (transducer) which contains the crystals. When the US waves hit the interface between two tissues (which possess different acoustic impedance), they undergo both reflection and refraction. The echo is the part of the US wave that is reflected back to the crystal. The echoes reflected back to the crystal are transformed by the crystal into electrical energy which is again transformed into light signals in a computer built into the US machine.
The US image we see on the monitor is produced by the movement of the crystal over a tissue plane. Each movement of the crystal over a plane of tissue gives one image of this tissue: a frequency of 30–50 movements per second will produce an average of 30 images per second. When the US probe is moved and oriented by hand, the sector plane is changed, and a real-time image is produced. The US exam appears in the monitor like a movie. The intensity of the echoes depends on the difference in acoustic properties of two adjacent tissues, which is the result of the density of the tissues and the velocity of the US waves through them: the greater the difference, the greater the reflected US energy. The resolution of the US image depends on the distance between the focus and the tissue section imaged.
The interpretation of the gray values of the images is based on the comparison with those of normal tissues: low echo signals appear as dark spots, and high echo signals appear as bright/white spots (Auer and Van Velthoven, 1990).
An acoustically homogeneous area displays a low-echo intensity (hypoechoic) while tissues with different densities exhibit high-echo intensity (hyperechoic).
The presence of air in the field of observation acts as a barrier because total reflection of US waves occurs at the interface between tissue and air; it is therefore important to use a gel as an interface between the probe and the tissue.
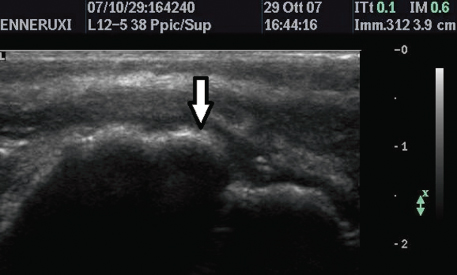
Total reflection also occurs at the surface of bone (hyperechoic).
In the presence of fluids, no reflection occurs because there is no echo intensity (transonic/anechoic).
We distinguish the echographic appearance of the tissues as follows:
- Liquid structures: “transonic” with reinforced walls and lateral acoustic shadows.
Within this category we find fluid tissues which can be (1) liquid corpuscolated (containing solid or liquid aggregates); (2) liquid with septa; (3) liquid with parietal echogenic vegetations. - Solid structures: “echogenic,” reflecting the echoes in a variety of ways (hypo and hyperechoic), within this group we find: (1) solid homogeneous structures; (2) solid dishomogeneous structures; (3) solid structures with colliquations; (4) solid structures with posterior shadow (as for calcific formations).
The latest US imaging systems use multifrequency, wide-band transducers with multiple, low-impedance linear crystals (up to 256) organized in 3–5 layers and electronically connected in a variable sequence.
The transducers that are best suited for the field of dentistry are linear probes, and allow the formation of a high-frequency (7.5–15 MHz) rectangular or trapezoidal image, which exhibit both optimal lateral resolution and optimal contrast of the superficial structures (Ghorayeb et al., 2008).
The dynamic focalization gives a precise resolution in structures smaller than 2 mm by varying the frequencies within 5–10 MHz. Furthermore, the digital era has made possible to reduce most of the artifacts which are built in the high-resolution systems.
To better evaluate bone lesions in the jaws, and especially to reduce the artifacts in fluid structures (cysts), these are simultaneously insonated with converging boundless US waves sent from different directions (compound technique) (Hofer, 2005b)
The color-power Doppler (CPD) flowmetry applied to the US examination allows the accurate evaluation of the blood flow within a given tissue, and it is based on the “Doppler effect” discovered in 1842 (Fleischer and Emerson, 1993) as a consequence of the frequency shift that occurs in the reflected sound waves when the US waves are directed toward the moving blood cells. The Doppler signal is in the audible range (2–4 MHz) and is represented on a graph with its changes in real time: the spectra obtained are plotted as a function of time (horizontal axis) and frequency shifts (vertical axis). The signal is influenced by the insonation angle of the US and by the changes in frequency (Hofer, 2005a).
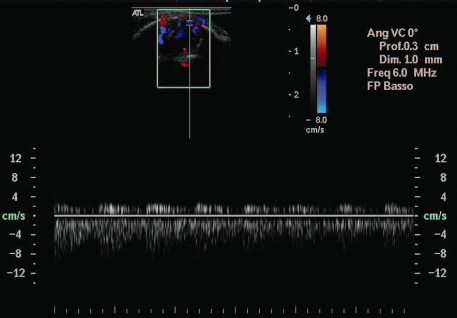
The color Doppler is the technique used for visualizing the presence and velocity of the blood flow within an image plane. It measures the Doppler shifts in the volumes located in an image plane and shows the flow in the form of color spots superimposed on the gray-scale image. Blood vessels moving toward the transducer appear as red (positive Doppler shifts), while vessels moving away from the transducer appear as blue (negative Doppler shifts). The higher velocities of the flow are represented in brighter shades of the same colors (red and blue); the scheme of the color which encodes the frequency shifts is indicated by the color bar to the side of the screen/image (Figure 19.1).
Figure 19.1 Echo-color Doppler applied to the examination of a periapical lesion showing the Doppler signal in the lower portion of the figure, and the color Dopper in the format of colored spots superimposed on the lesion, in the upper part of the figure (framed).

Color Doppler images are updated several times per second.
The power Doppler, based on the integrated power spectrum, adds sensitivity to the exam and discloses the presence of the network of minor vessels and slower flows within the tissue of interest; it is less influenced by the insonation angle (Fleischer and Emerson, 1993; Hofer, 2005b; Wolf and Fobbe, 1995).
The intensity of the echo-CPD signal is strengthened by the intravenous (IV) injection of contrast media that increase the echogenicity of the blood. The use of second-generation contrast media, which reach the lumen of the smaller vessels, allows the evaluation of the blood flow in its wash-in and wash-out phases and the study of the microvascular system (Hofer, 2005a).
In the field of endodontics, the echo-CDP discloses the vascular map around and within a lesion and shows the direction of blood flow (Cotti, 2008).
US real-time imaging does not use ionizing radiations, and it is therefore considered a much safer technique than radiographic examinations (Barnett et al., 1997, 2000; Martin, 1984). The only potential adverse effects of the system is the consequence of the cavitation and vibration effects created by the transfer of heat and mechanical energy into biological tissues. These phenomena depend on the time of application of the sound energy: it is therefore important to limit the repetitions of the exams (Auer and Van Velthoven, 1990).
Use of US Imaging in Endodontics
US real-time imaging has been applied to the endodontic field for the diagnosis, evaluation, and follow-up of bone lesions in the jaws (Cotti, 2008, 2010; Cotti et al., 2002, 2003, 2006; Gundappa et al., 2006; Sumer et al., 2009).
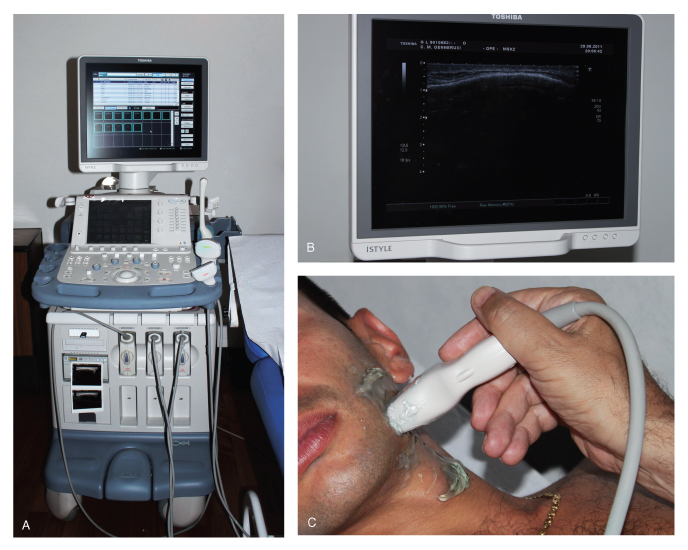
The technique is relatively easy to perform: the patient is sitting on the echographic bed, and the operator moves the probe (protected with a latex/plastic cover and topped with the echographic gel) inside the buccal area of the mandible or the maxilla which corresponds to the periapical area of the tooth of interest (as previously assessed with a radiograph). The same examination can also be performed extra-orally, by placing the probe on the external surface of the skin (Figure 19.2). The operator is facing the computer, while gently moving the probe around the area of interest to obtain an adequate number of scans to define the lesion in real time.
Figure 19.2 Ultrasound imaging of last-generation apparatus (A), details of the monitor (B), extra-oral examination of the mandible with a linear probe (C).

Each moving sequence or single image can be selected and stored in the computer.
The probes that are used to investigate bone lesions in the jaws are multifrequency high-resolution transducers either in the format of linear probes or in the format of intraoperatory probes (smaller probes useful for intraoral examination), and support a digital US apparatus.
Based on the studies reported on the application of US real-time echotomography to the endodontic field (Cotti, 2008, 2010; Cotti et al., 2002, 2003, 2006; Gundappa et al., 2006; Rajendran and Sundaresan, 2007; Sumer et al., 2009), the healthy and pathologic tissues within the maxillary bones appear as follows in the echographic images:
The sensitivity of the technique makes possible the distinction between serous and inflammatory exudates.
Figure 19.3 Ultrasound image of the profile of the maxilla (arrow); the image represents a “hyperechoic” area where total reflection occurs.

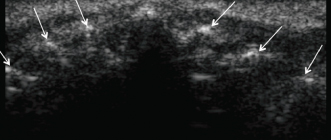
Figure 19.4 Ultrasound image of the maxilla showing the contours of the roots of the teeth (arrows); the contours are hyperechoic.

Stay updated, free dental videos. Join our Telegram channel

VIDEdental - Online dental courses


