7
Radiographic Expression of Endodontic Disease
Endodontic Disease
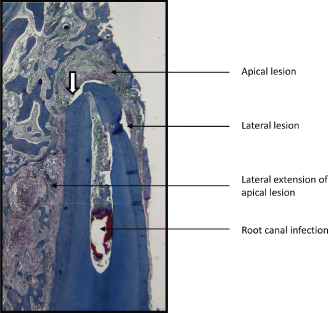
Root canal infection occurs when host tissue interacts with pathogenic microorganisms that colonize the pulp space. This can evoke an inflammatory response during which pathophysiological changes occur in the dental supporting tissues (Stashenko et al., 1998). These are first seen in the periodontium and later in the alveolar bone (Figure 7.1). The initial changes are seen adjacent to sites where blood vessels once entered and exited the dental pulp, that is, in juxtaposition to the apical foramen and/or lateral and accessory canals (Figure 7.2). When inflammation only involves soft tissue (periodontal ligament), no radiographic changes are seen although symptoms of a periodontitis may be clinically present. In time, changes also occur in bone, and it is at that time their presence may be detected radiographically. Their detection is dependent upon their size and their location and the nature of the host’s reaction to the presence of the bacteria. Host recognition of pathogenic bacteria is prone to many variables, and these can lead to marked differences in the degree and extent of the inflammation-related tissue changes that occur (Wilson, 2008). Variances in the size and location of vascular channels also impact on how and where the inflammation is manifested. Small lateral canals or a weak host response, for example, may result in a bone change too small to be detected radiographically (Brynolf, 1967), and larger lesions may not be detectable even when present if they occur on the palatal (lingual) or facial (buccal) aspect of the root where they are masked by root superimposition.
Figure 7.1 Pathophysiological changes occurring in the apical supporting tissues in association with root canal infection.
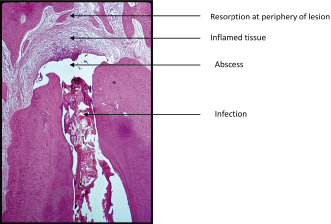
Figure 7.2 Lesions of endodontic origin about root of incisor tooth. Note area of resorption at root apex (white arrow).
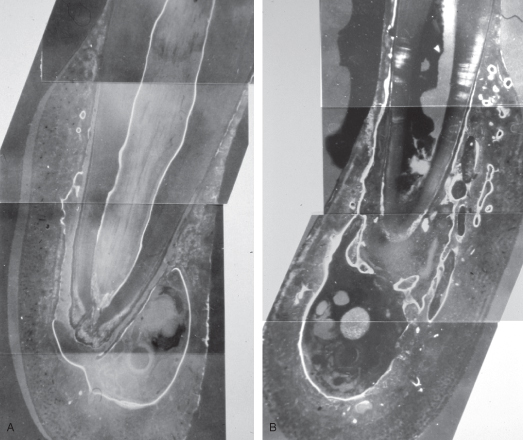
Infection-induced inflammation results in the release of signaling molecules from resident and migrant cells that dysregulate bone metabolism (Torneck and Tulananda, 1969) (Figure 7.3A). In the healthy adult, bone appears relatively constant when imaged because as it remodels, the resorption of bone is balanced by its replacement with new bone (homeostasis). In older adults, there is an innate and acquired-based shift that often leads to a greater removal of bone than formation of bone and hence a reduction in bone mass. When the reduction in bone mass surpasses a calculated norm, the bone is referred to as osteopenic, and when more advanced, it is referred to as osteoporotic. Growing pre-adult patients normally display an increase in overall bone formation and resorption in association with their growth. During the growth, bones become altered in size and shape and their density altered by function (an adaptive phenomenon). The rate and degree of alteration seen in bone is mainly under the control of hormonal and locally produced signaling molecules (Boskey and Coleman, 2010).
Figure 7.3 A. Fluorescent labeling of normal bone about canine root (dog). White zones indicate bone formed during period of label administration.
(Reprinted from Torneck and Tulananda, 1969, with permission from Elsevier Ltd.).
B. Dysregulation of bone metabolism about canine root in which there is a root canal infection. Note bone loss (dark area) at apex and new bone deposition (white zones) in supporting tissues.
(Reprinted from Torneck and Tulananda, 1969, with permission from Elsevier Ltd.)
Myelogenous-derived cells called osteoclasts (OCs) are responsible for bone resorption, and their activity is regulated by hormones and locally produced signaling molecules (Figure 7.4). These molecules are produced not only by resident cells, but also by migrant cells, cells that become attracted to a site when an injury occurs (Cochran, 2008). Local signaling molecules are called cytokines, and in bone they are normally produced by osteoblasts (OBs) and other cells normal to bone tissue. When infection is present, there is a phenotypic and temporal-related migration of nonresident cells to the site. In the early stages of inflammation, these migrating cells release cytokines that upregulate the production of a signaling ligand called receptor activator of nuclear factor kappa B (RANKL) that activates OCs through a surface RANK receptor, to resorb bone (Teng, 2006). While other intra- and extracellular, neurological, and environmental factors also play a role in OC activation, their role appears to be less prominent than that played by RANKL (Tay et al., 2004). With time and control of the infection, OC activation is downregulated by a cytokine called osteopotegrin (OPN) which is a decoy receptor for RANKL and limits its availability for activation of the RANK receptor. OPN upregulation and bone formation are generally seen in the chronic stages of inflammation. The bone formation is initiated locally by cytokines of the transforming growth factor (TGF) super family that, like RANKL, are produced by both resident cells and different subsets of migrant cells attracted to the site (Katagin and Takahashi, 2002). This leads not only to the healing of bone (return to homeostasis) when infection is controlled through treatment (Figure 7.5A–C), but also to the deposition of bone during disease when the intensity of the host response is moderated sufficiently to upregulate the release of anti-inflammatory cytokines and downregulate those that are proinflammatory. Another factor that influences bone formation during inflammation is the environmental pH. Mineralization of bone matrix ideally occurs at a slightly alkaline pH. During the early phase of inflammation, the environmental pH becomes acidic, and this tends to locally suppress OB activity and promote OC activity. This too is moderated when proinflammatory cytokines are downregulated. Inflammation is most intense at sites closest to where bacteria and host interact, and it is at those sites that resorption of bone is most apt to persist. At more distant sites where the host response is more moderate, OC activity is usually less intense and OB activity is more prevalent. In low-grade infection, therefore, it is not unusual to see some areas of reactive bone formation at sites peripheral to the root when bone resorption is occurring at the root apex, or bone reactive formation as the most prevalent dysregulative change present. The architecture of this bone, however, is different than that of the bone that is normal to the anatomical site. A local decrease in bone density within the bone is seen as a radiolucency in the radiograph. In endodontic infections, these are initially seen extending out from the periodontal space at sites where a vascular channel is present. When infection leads to an increase in bone formation, a radio-opacity may also be seen in the radiograph, and again, this occurs in juxtaposition to those sites. Bone changes associated with inflammation are designated with the suffix “itis,” hence a radiolucent lesion of endodontic origin is referred to as rarefying osteitis (Figure 7.6A,B), and one that is opaque, condensing (sclerosing) osteitis (Figure 7.7A,B). Condensing osteitis is usually accompanied by some degree of rarefying osteitis (Figures 7.8 and 7.9A–C), unlike rarefying osteitis, which can occur without an accompanying radio-opacity. As previously mentioned, because lesions of endodontic origin initially develop in the periodontal ligament, a widening of the periodontal space and an accompanying loss of lamina dura is usually present in a well-exposed radiograph. Several factors, in addition to those that have been already mentioned, influence the ability of the clinician to detect the lesion radiographically even when it is histologically present. These range from physical factors necessary to generate a good readable image, to the size and location of the lesion in the bone (Brynolf, 1967). Bone imaging of diagnostic quality requires proper alignment of the tooth manifesting endodontic disease with the central ray, as well as sufficient density and contrast to record all the nuances of bone architecture (Figure 7.10). These factors separate tooth from bone and help differentiate normal from bone altered by disease. However, even with properly exposed images, lesions may not be radiographically detectable in standard imaging methods if they are masked by superimposition of roots, as has already been discussed, or when they occur and are restricted to trabecular bone. Studies have shown that extension of the lesion to include junctional bone, bone at the interface of the trabecular and cortical bone, is necessary if it is to be seen radiographically (Bender and Seltzer, 1961a, 1961b). This apparently applies primarily to teeth whose roots are centrally situated in the jaw and less to teeth whose roots approximate the bone surface. It also has been shown that lesion size is usually underrepresented when imaged radiographically (Figure 7.11A,B).
Figure 7.4 Histological section taken from periphery of apical lesion seen in Figure 7.9B displaying osteoclastic bone resorption in association with tissue inflammation. Deposition of new bone by osteoblasts can be seen in juxtaposition to the resorption site.
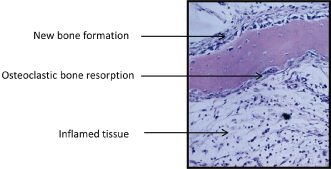
Figure 7.5 A. Changing pattern in bone associated with endodontic infection. In pre-op radiograph, a small diffuse radiolucency in association with increased radio-opacity is seen at apex of mesial roots of mandibular molar. Apex of distal root displays small defined apical radiolucency in association with a slight radio-opacity. B. At completion of endodontic treatment, lesion at apex of mesial roots displays an increase in size of radiolucency. Lesion at apex of distal root displays little change. C. Return to normal bone architecture at apex of mesial and distal root is seen 1 year after completion of endodontic treatment.
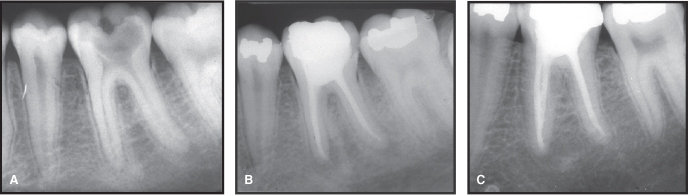
Figure 7.6 A. Apical and lateral endodontic rarefying osteitis associated with root of maxillary incisor. B. Lesion displays healing 8 months post-op. Note presence of two large lateral canals on mesial aspect of root.
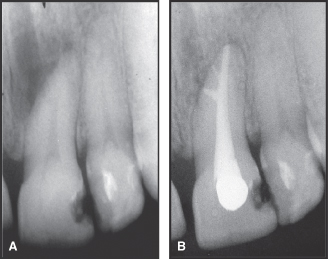
Figure 7.7 A. Widened periodontal space and loss of lamina dura in association with condensing osteitis (arrow) at apex of nonvital maxillary premolar. B. Reestablishment of normal bone 1 year after completion of endodontic treatment.
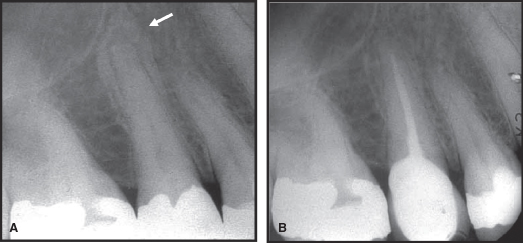
Figure 7.8 Combined rarefying and sclerosing osteitis in mandible associated with endodontic infection of molar tooth.
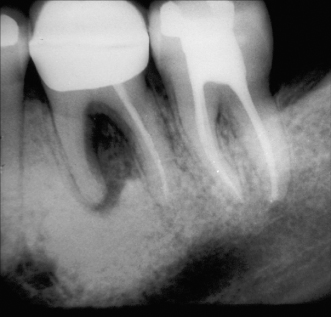
Figure 7.9 A. Mandibular first molar demonstrating condensing and rarefying osteitis at apex of mesial and distal roots. B. Lesions are still present at completion of endodontic treatment. C. Return to normal bone architecture 1 year after completion of endodontic treatment.
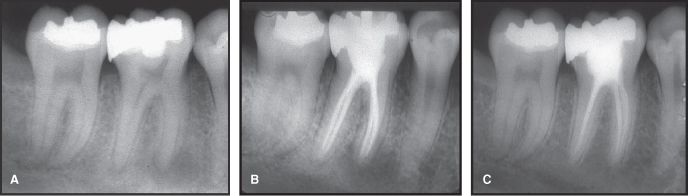
Figure 7.10 A. Underexposure and superimposition of root leaves lesion at apex of mesiobuccal root of maxillary molar undetectable in radiograph. B. Change in angle of central ray (CR) and proper exposure reveals presence of rarefying osteitis at mesiobuccal root apex.
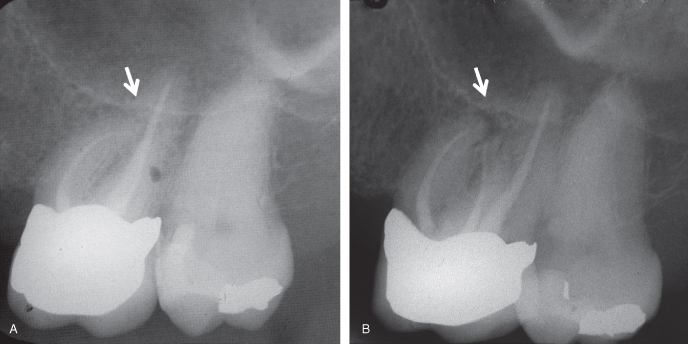
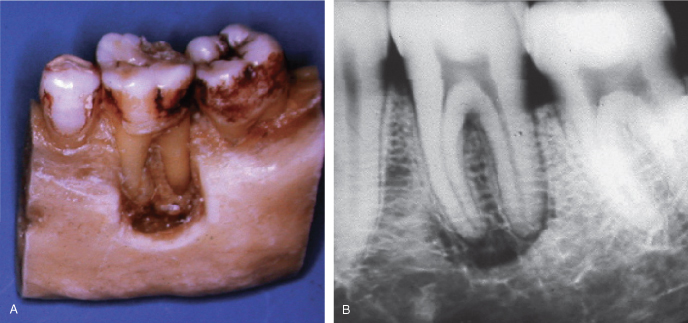
Figure 7.11 A. Experimental removal of bone over roots and around apices of mandibular molar. B. Radiographic appearance of bone removal shown in Figure 7.11A.
Lesions of endodontic origin can be large or small, concentrically disposed at their site of origin, or highly eccentric. Large eccentric lesions can result in the inclusion of the roots of neighboring healthy teeth within the perimeter of its radiographic presence (Figure 7.12A,B). This can lead to misdiagnosis and unnecessary treatment of otherwise healthy teeth unless precautions are undertaken to confirm which tooth is responsible for the changes that are seen. This again emphasizes a need to take multiple views of the teeth in question and to utilize additional diagnostic tests, before a working diagnosis is established and treatment is begun. More often than not, only one tooth is responsible for the lesion, hence only one tooth needs to be treated for healing to occur. The challenge lies in identifying that tooth by properly assessing the pulp status of all the teeth present in the area (Figure 7.13A,B).
Stay updated, free dental videos. Join our Telegram channel
VIDEdental - Online dental courses


