14
Diagnostic Tests and Measurements in Clinical Practice
Principles of Diagnosis
First-year medical and dental students tend to misdiagnose common conditions in favor of exotic ailments that reflect their most recent lecture topics. These students fail to heed the commonsense adage: “If it looks like a duck, quacks and waddles like a duck, then it probably is a duck!” The unfortunate problem with “common” sense is that it is not very common. Nevertheless, common things do occur commonly, and this phenomenon is the basis for the adage, “When you hear hoofbeats, think of horses and not zebras.” Of course, the correct application of this adage depends upon whether the hoofbeats are heard on the plains of North America or on the plains of the Serengeti in Africa. These adages respectively illustrate two concepts: the principle of pattern recognition and the effect of prevalence. Both principles are important components of the diagnostic process.
Dentistry has been chided for failing to emphasize the diagnostic process in favor of merging diagnosis with treatment planning.1 However, in 1988, a conference of public health dentists predicted that by 2025, the person dealing with oral health problems would not be known as a “dentist” but rather as an “oral physician” or some similar title.2 Like other physicians, the oral physician should be able to evaluate and interpret measurements and tests to provide a diagnosis indicating the presence or absence of a disease. In turn, this diagnosis is expected to direct a subsequent course of management or treatment.
Arriving at differential diagnoses and treatment plans require an organized approach. One method used to facilitate the gathering/documentation of information and to generate diagnoses and treatment plans is the SOAP format. SOAP is an abbreviation for:
Subjective information
Objective information
Assessment
Plan
Subjective information is the information provided by the patient, what the patient tells the clinician:
- Chief complaint
- Medical history
- Dental history
- Social/work/family history
- Symptoms
- Stated preferences for treatment, nontreatment, etc
Objective information is the observations and findings of the clinician:
- Patient’s vital signs
- Clinical findings (signs)
- Radiographic findings
- Any diagnostic test results
Assessment is the clinician’s interpretation of the objective information:
- Diagnosis via differential diagnosis
- Etiology
- Prognosis
The plan is the course of action or treatment/management proposed by and/or performed by the clinician, based on the objective findings and assessment above:
- Treatment options (there may be more than one)
- Documentation that the treatment options were presented and discussed with the patient
- Cost estimates
- Details of actual treatment delivered
The subjective and objective information may collectively be considered diagnostic tools, because both information sources are used to generate a diagnosis.1 The fundamental purpose of a diagnosis is to either rule in or rule out the presence of a particular disease or condition, so that individuals with the condition can be distinguished from those without the condition. This diagnostic process demands the application of exact criteria to define the condition that is the target of the process. In general, clinicians, researchers, and patients agree that the presence of disease indicates a change in anatomy, physiology, biochemistry, or psychology, but they are less likely to agree on the exact criteria that define a particular condition.3
Two major principles of disease are described by Wulff4: (1) the nominalistic or patient-oriented principle, and (2) the essentialistic principle, which emphasizes disease as an independent entity.
In the patient-oriented nominalistic approach, disease classification concerns the classification of sick patients. Disease is not considered to exist as an independent entity, and a particular disease is defined by the group of characteristics that occur more often in “patients” with the disease than in other people. Patients demonstrate a pattern of similar symptoms and signs, as well as similar prognoses and responses to treatments. Moreover, the nominalistic approach does not require a definition of “normalcy” and acknowledges that definitions of disease may vary between different societies.4
The essentialistic view4 is closely related to a more contemporary principle of disease termed biochemical fundamentalism,5 which is based on biochemistry and molecular biology. Once the underlying biochemical events are understood, the course of a disease can be predicted theoretically, because diseases are assumed to follow regular patterns. Definition of the “normal” state is avoided; biotechnology and statistical concepts define the disease state in terms of both the distribution of specified features in a specific population and the extent to which that distribution differs from a similar assessment of a group the investigators consider “not diseased.”4,5 In fact, this statistical approach forms the basis for utilizing biomarkers as diagnostic or screening tests.
Irrespective of the approach, essential prerequisites in arriving at a diagnosis should ideally include a clear, unambiguous definition and an understanding of the natural history of the particular disease being investigated. Definitions of a specific disease may change over time, and specified criteria may be limited to specified populations at specified time periods. Testing protocols/conditions for the disease may also be specified. These concepts are illustrated below using the example of diagnosis of hypertension.
Test data may be divided into different categories of “disease.” For ease of discussion, this chapter focuses primarily on dichotomous data divided arbitrarily into two mutually exclusive categories: positive or negative. The results of a pregnancy test are either positive or negative; it is not possible to be “a little bit pregnant.” In contrast, some tests, such as blood pressure (BP) measurements for assessment of hypertension, may indicate several levels of abnormality (see below). Nevertheless, precise definitions can be crucial in making literal life-and-death decisions, such as decisions about organ donation.
Diagnostic data (ie, symptoms, signs, and test results) may be applied at three levels: screening, confirmation, and exclusion. The focus of screening procedures is the early detection of disease, before symptoms become apparent. Screening tests are conducted on individuals without symptoms associated with the condition for which screening is being performed. Screening tests help to classify individuals with respect to their likelihood of having a particular disease, but they cannot diagnose disease. For individuals with a positive screening test result, subsequent evaluation with additional tests to rule in or rule out the presence of the disease must be performed3,6 (see also the section on screening and decision making later in the chapter).
The diagnosis of hypertension illustrates these testing concepts. Most adults have had their BP measured in their physician’s office. Dentists also measure patients’ BP as part of baseline vital signs obtained during the examination and also to screen for hypertension. Additionally, many individuals may measure their BP at home or at pharmacy booths. In May 2003, the Joint National Committee (JNC) on Prevention, Detection, Evaluation, and Treatment of High Blood Pressure 7 published new guidelines regarding hypertension.
- ✓ The population is defined: classification of BP is for adults ages 18 and older.
- ✓ The time period is defined: May 2003 (JNC7) onward; the new classification replaces JNC6 (1997).
- ✓ The methods of testing are operationally specified: “The classification is based on the average of two or more properly measured, seated BP readings on each of two or more office visits.”7
Box 14-1 Principles of diagnostic decision analysis
Principle 1: Clinicians should not consider patients as absolutely having a disease, but rather as having only the probability of disease. The probability of disease is based on the prevalence of the disease, the patient’s history (including risk factors, symptoms, signs, and previous test results), and the clinician’s previous experience with similar situations.
Principle 2: Clinicians use diagnostic tests to improve their estimate of the probability of disease, and the estimate following the test may be lower or higher than the probability before the test. Tests should be selected by their ability or power to revise the initial probability of disease.
Principle 3: The probability that disease is actually present, following a positive or negative test result, should be calculated before the test is performed. Application of this principle results in fewer useless tests being performed.
Principle 4: A diagnostic test should revise the initial probability of disease. However, if the revision in the probability of disease does not alter the planned course of management/treatment, then the use of the test should be reexamined. Unless the test provides information desired for an unrelated problem, there is no sense in performing tests that will not alter the planned course of management/treatment.
- The auscultatory method of BP measurement should be used.
- The operator should be trained and regularly retrained in the standardized technique.
- The patient must be properly prepared and positioned, and persons should be seated quietly for at least 5 minutes in a chair (rather than on an examination table), with feet on the floor, and arm supported at heart level.
- Caffeine, exercise, and smoking should be avoided for at least 30 minutes before measurement.
- An appropriately sized cuff should be used for accuracy (cuff bladder encircling at least 80% of the arm).
- At least two measurements should be made and the average recorded. The BP measurement may be verified in the contralateral arm.
- Systolic BP (SBP) is the point at which the first of two or more Korotkoff sounds is heard (onset of phase 1) and the disappearance of korotkoff sound (onset of phase 5) is used to define diastolic BP (DBP).
- Ambulatory BP monitoring is indicated for evaluation of “white-coat” hypertension.
- ✓ In contrast with the JNC6 (1997) classification, JNC7 (2003) introduced a new category designated prehy-pertension (SBP 120–139/DBP 80–89 mm Hg), and JNC6 hypertension stages 2 and 3 were combined into JNC7 stage 2 hypertension. Initiation of drug therapy is recommended at JNC7 stage 1 hypertension (SBP 140–159/DBP 90–99 mm Hg). “Normal” BP cutoffs were reduced from SBP <130 mm Hg and DBP <85 mm Hg (JNC6) to SBP <120 mm Hg and DBP <80 mm Hg (JNC7).789
At any specified time, a specified population can be considered to comprise three populations: (1) nonpa-tients, asymptomatic individuals; (2) patients who have positive results for the disease of interest; or (3) patients with similar conditions but who do not have the disease of interest. The clinician’s objective is to correctly classify individuals into the appropriate category. As noted above, this process is initiated with the patient’s chief complaint(s) and history (the symptoms), followed by the clinical examination (signs) and perhaps additional diagnostic tests. The typical dental clinical examination may include recording a patient’s vital signs; assessing facial profile/symmetry; palpating the cervical/sub-mandibular nodes, muscles of mastication, and lateral condylar poles; listening for temporomandibular joint (TMJ) noises; recording mandibular excursions; examining oral soft tissues; employing dental explorers, periodontal probes, electric pulp testers, or ice; and prescribing dental radiographs.
Principles of Decision Analysis
Both clinicians and patients expect that the information gleaned from these investigations is truthful, reliable, and useful for providing a diagnosis that will direct a subsequent course of management. Interpreting the data in order to arrive at a diagnosis should be guided by four principles of decision analysis (Box 14-1).101112
Principle 1 states that in the diagnostic context, patients have a probability or risk of disease; they do not have a disease. The initial probability or risk of a particular disease being present is equivalent to the prevalence (Box 14-2) of that particular disease in a specified population at a specified period of time. This initial probability (prevalence) may then be revised upward or downward, depending on the patient’s symptoms, signs from the examination, and previous test results as well as the clinician’s previous clinical experience with similar situations. The probability or risk of disease is increased if the patient has one or more risk factors for the disease. Hence, the patient is assigned an initial or pretest probability, or likelihood of disease being present.
Box 14-2 Definitions of and calculations for test characteristics
Accuracy
- the overall agreement between the test and the gold standard
- may be calculated from a 2 × 2 contingency table, as shown in Fig 14-4 by the formula

Sensitivity
- the proportion of diseased individuals correctly identified by the test
- also known as the true-positive rate
- calculated from a 2 × 2 contingency table, as shown in Fig 14-4 by the formula

Specificity
- the proportion of nondiseased individuals correctly identified by the test
- also known as the true-negative rate
- calculated from a 2 × 2 contingency table, as shown in Fig 14-4 by the formula

Prevalence
- the overall probability or risk that the disease is present prior to the test
- also known as the pretest likelihood
- the proportion of individuals in a population who have the disease at a specific point in time; prevalence in a specified population may change over time, and prevalence may change if the definition of the disease changes
- calculated from a 2 × 2 contingency table, as shown in Fig 14-4 by the formula

PTL(+)
- posttest likelihood of a positive test result
- also known as the positive predictive value
- for an individual with a positive test result, PTL(+) is the probability that the disease is actually present
- calculated from a 2 × 2 contingency table, as shown in Fig 14-4 by the formula

When the sensitivity, specificity, and prevalance or pretest likelihood are known, PTL(+) may be calculated by the formula

PTL(–)
- posttest likelihood of a negative test result
- for an individual with a negative test result, PTL(–) is the probability that the disease is actually present
- calculated from a 2 × 2 contingency table, as shown in Fig 14-4 by the formula

When the sensitivity, specificity, and prevalence or pretest likelihood are known, PTL(–) may be calculated by the formula

NPV
- negative predictive value
- for an individual with a negative test result, NPV is the probability that disease is really absent
- calculated from a 2 × 2 contingency table, as shown in Fig 14-4 by the formula

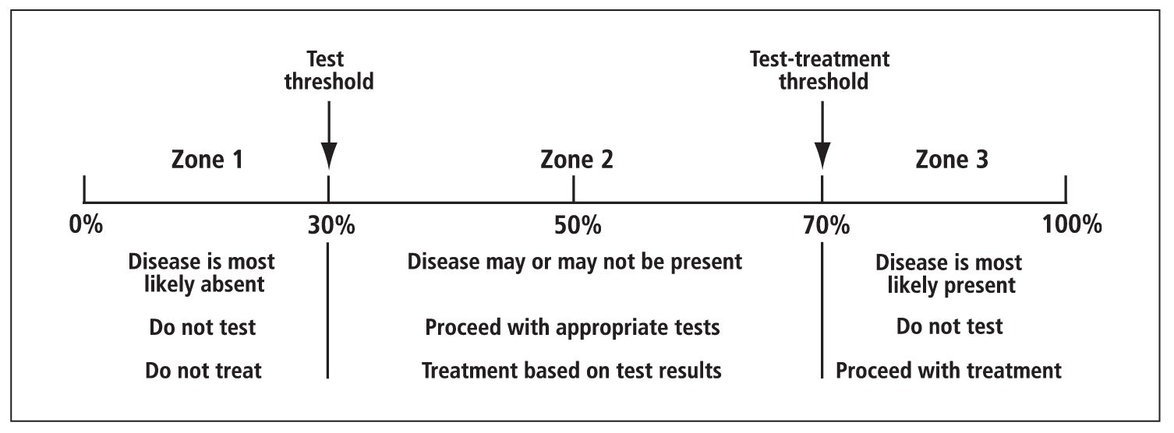
Fig 14-1 Threshold approach to decision analysis.
After completing the patient history and clinical examination, the clinician may be confident that a particular disease is present. Therefore, further investigation or testing for diagnostic purposes is not required, and the appropriate management should proceed without delay. In similar fashion, if the clinician is confident that a particular disease is not present, then further testing is not warranted.
However, the clinician may remain undecided as to the presence or absence of a particular disease. As per principle 2, diagnostic tests may now be considered to revise, either upward or downward, the initial pretest probability. However, the measurements, assays, and/ or diagnostic test results cannot confer 100% certainty as to the presence (ie, positive result) or absence (ie, negative result) of disease, and there is a risk of false-positive and false-negative results. Hence, test results (either positive or negative) can only revise (upward or downward) the pretest probability, and the decision whether a test provides useful information is independent of the actual result.
Once a test result is obtained, both clinician and patient must accept and deal with the result; “cherry-picking” the desired result would facilitate personal bias and reinforce preconceived notions, thus violating the principle of objective testing.
The threshold approach is used in decision analysis (Fig 14-1):
- For each particular disease or condition, the clinician sets a threshold for testing, known as the test threshold.
- The clinician sets a second threshold for treatment, known as the test-treatment threshold. These thresholds represent cutoff probabilities for ruling in or ruling out a particular disease. The threshold values depend on the disease and the subsequent consequences/ course of management related to either ruling in or ruling out the disease. False-positive and false-negative results have consequences that must be weighed in each individual’s case. The test should not be performed if it is not powerful enough to revise the pretest probability, so that either a positive or negative result would alter the pretest-planned course of action.
- When the pretest probability falls between the test threshold and test-treatment threshold, then testing is indicated and treatment should proceed on the basis of the test results. In general, diagnostic tests are most useful when the pretest probability falls roughly between 30% and 70%.131415
The threshold approach to decision analysis is illustrated by the following examples for the disease of pulpal pathology and the test of periapical radiograph. In zone 1 (see Fig 14-1), the pretest probability of disease is below the test threshold. The patient describes the sudden onset of pain to cold, sweet, or sour foods and beverages. These symptoms involve the maxillary anterior teeth, and the patient expresses concern about the need for root canal treatments. The patient denies a history of trauma but reports the occasional use of an orthodontic retainer and the recent application of at-home tooth-whitening products daily over the past week. Examination reveals an unrestored dentition with localized facial cervical recession. At this time, root sensitivity caused by recent application of bleaching products to exposed dentin is the most probable diagnosis. Pulpal pathology is most likely absent. Information obtained from a periapical radiograph would not alter the diagnosis or alter the course of management (topical application of desensitizing agents). Even a positive test result (eg, widened periodontal ligament space around the root apex) would not alter the posttest probability to a level that would justify endodontic treatment. Hence, neither endodontic treatment nor further testing should proceed.
In zone 2 (see Fig 14-1), the patient presents with complaints of intermittent pain and gingival swelling along the facial aspect of the mandibular right central incisor. Examination reveals a well-maintained dentition and a fistula with obliteration of the mucobuccal fold adjacent to the incisor, which has a large cervical restoration. Periodontal probing around the incisor range from 2 to 6 mm, but it is not possible to probe the sulcus/pockets and communicate directly with the fistula. The patient reports pain to percussion and reports delayed and mild sensation to cold stimulation. A necrotic pulp and/or periodontal abscess may be present. A radiograph with a gutta percha point inserted into the fistula is warranted, because it may provide useful information for diagnosis and further management.
In zone 3 (see Fig 14-1), the patient denies current complaints involving the mandibular left first molar but reports a history of “toothache that stopped after the tooth broke.” Examination reveals that the molar has fractured lingual cusps, with visible gross caries involving the pulp chamber. The patient denies sensation to cold stimulation. Caries, tooth fracture, and necrotic pulp are diagnosed without the need for radiographs. However, a radiograph is required to guide prognosis and further treatment, either extraction or endodontic therapy.
Reliability of Measurements
As noted previously, patients and clinicians have the reasonable expectation that measurements are reliable. Reliability refers to the reproducibility or ability to obtain the same measurement consistently over sequential measures. The most direct way to determine reliability is to measure the same things with same device several times and compare the results. Note that in our example of measuring BP the “classification is based on the average of two or more properly measured, seated BP readings on each of two or more office visits.”7
A measure is reliable when the variation or random fluctuation due to errors in measurement is small. Measurements are not reliable when there are extraneous factors that may be unknown or difficult to control. Reliability of a measurement may be affected by three sources of variability: (1) the system or phenomenon being measured; (2) the examination itself, such as the examination environment, equipment, or instruments; or (3) the examiners.
Consider a student’s performance in examinations. There is probably some true score that accurately indicates a student’s knowledge of the course’s content, but the actual grade received depends on:
- Variations in performance during the test period (eg, some students might get tired during the test)
- Variations in performance from day to day (the student might be sick, hungover, etc)
- Variations in the conditions under which the examination is administered (eg, time of day, room ventilation)
- Sample of test items used (eg, all the questions could be on areas the student has not studied)
These factors lead to the examination grade not reflecting the student’s knowledge, and can be considered sources of error in the estimation of the student’s knowledge. The larger these factors are, the less reliable the examination grade is as a measure.
Variation in the system or phenomenon being measured
The phenomenon being measured may exhibit normal biological variability. For example, throughout the day and under different circumstances (eg, body position, stress, and exercise), BP and pulse rate fluctuate and diurnal and menstrual cycles cause hormonal fluctuations. Moreover, the very act of measurement may influence or alter the phenomenon being measured so that repeated measurements (test and retest) are not reproducible (not reliable). When patients are asked to open their mouth as wide as possible, they may not be able to at first. After several attempts, the inter-incisal distance may increase, or even decrease, due to fatigue. The act of repeated mandibular movements may also affect other clinical variables for assessment of temporomandibular disorders (TMDs) such as tenderness to muscle palpation and assessment of TMJ sounds so that findings may not be stable in either the short or long term.16 Some phenomena, such as BP, will demonstrate “regression toward the mean,” by returning to usual levels over time.17 Therefore, some phenomena require repeated evaluations over time before a diagnosis is finalized. In fact, the inherent variability of physical attributes associated with many dental conditions is responsible for the inability to attain higher reliability scores.
Variability from examination equipment and environment
Laboratories often assess the precision of their methods by running repeated determinations on the same sample. If the method destroys the sample, the sample can be split, and measurements can be made on the subsamples. For example, the mass NB10 at the American National Bureau of Standards is supposed to weigh exactly 10 g. Eleven determinations of the weight of NB10 gave a value of 9.9995982 g, with 95% confidence limits of ±0.0000023.18 We can see that the reliability of weight determination is very high. This is expected, because elaborate instrumentation for weighing objects has been developed, and the observations are performed under well-specified conditions. Typically, the results are expressed as a standard deviation (SD) of the individual values or as a confidence interval around the calculated mean.
The incorrect function or use of measuring devices or instruments may also be a source of variability. Reliable recording of BP depends not only on a calibrated sphygmomanometer but also on correct positioning of an appropriate-sized cuff onto the arm, and proper inflation of the cuff.


Variability of the examiner(s)
Biologic variation among examiners accounts for variable acuity of their senses (eg, sight, touch, hearing), which may be further affected by their mood and sleep status. Examiners may be inexperienced or incompetent. They may replace evidence by inference, which can close a clinician’s mind to other diagnoses.3 Consider a patient who describes difficulty in opening her mouth and swelling and pain along the right side of her face, which began several hours after a forceps extraction of an erupted carious maxillary right third molar. The dentist suspects an infection and pre-scribes powerful antibiotics. Unfortunately, the symptoms do not resolve, and, after 3 days, the patient reports bruising along the right side of her face and persistent discomfort to opening her mouth. A hematoma developed from injection of local anesthetic, and wide opening during extraction resulted in trismus of the masticatory muscles. In this example, the clinician has jumped to the conclusion that the initial symptoms were caused by bacterial infection and failed to consider the not-uncommon alternatives of hematoma and TMD.
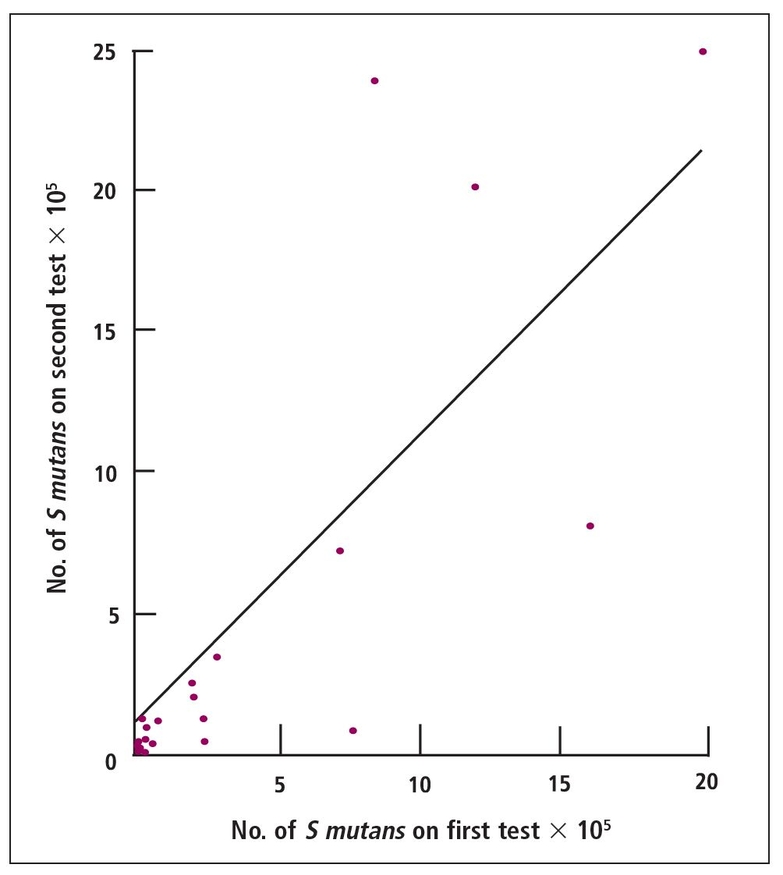
Fig 14-2 Pearson autocorrelation of Streptococcus mutans counts in the saliva of third-year dental students on 2 successive weeks. Slope ≈ 1; intercept ≈ 1.5; correlation coefficient ≈ 0.65.
Clinicians also tend to diagnose what they expect or hope to find3; hence, a clinician’s mind-set may affect the diagnosis. For example, in addition to the his-tomorphology of the tissue on the slide, pathologists may be influenced by other factors when arriving at a diagnosis. The clinical data may be incorrectly weighted or “double counted” in the pathologist’s diagnosis, if the pathologist has knowledge of the patient’s clinical />
Stay updated, free dental videos. Join our Telegram channel
VIDEdental - Online dental courses


