Introduction
Mini-implants are often immediately loaded for orthodontic treatment; however, changes in interfacial tissues caused by early loading and its effects might compromise the mini-implant’s function. The purpose of this study was to compare the healing of interfacial tissues 1, 4, and 12 weeks after the placement of titanium-alloy mini-implants in New Zealand rabbits; some of the implants were loaded immediately and others were left unloaded.
Methods
Eighteen animals were used in the experiment. Each received 4 titanium grade 5 mini-implants (2.0 × 6.0 mm), 2 of which were immediately loaded with 1 N of force. Tissue healing was verified at 1, 4, and 12 weeks after placement. Four different fluorescent molecules were injected into the rabbits to label calcium deposition. After the rabbits were killed, mineralized bone samples with the mini-implants were removed, fixed, cut, stained, and observed with bright-field, polarized, and fluorescence microscopy.
Results
After 12 weeks of healing, higher bone contact and bone area were observed than after 1 or 4 weeks, regardless of loading. Differences between the loaded and unloaded groups were not observed ( P <0.05) at 1 and 4 weeks. The bone deposition rate was higher in the loaded group.
Conclusions
The 1-N immediate force application did not compromise bone formation around mini-implants.
Rigid bone anchorage has been developed since successful use of conventional dental implants in orthodontics. Changes in the design were proposed to overcome the disadvantages of conventional dental implants such as limitations of placement sites, invasive surgical procedures, postoperative pain, and difficulty of attaching elastics or springs.
First, changes were made to the dimensions of the implant. Length reduction was proposed, and then the size and design were completely changed, creating specific systems. Miniplates, mini-implants, and onplants were the most used rigid orthodontic bone anchorage systems. Mini-implants became widely used because they met orthodontic needs: eg, wide range of placement sites, simplified surgical procedures and lower costs. However, these design changes resulted in higher failure rates than conventional dental implants. In this context, some factors must be considered that might jeopardize the success of the mini-implants. Screw diameter of 1 mm or less, inflammation of peri-implant tissues, thin cortical bone at the placement site, micromovement during the first healing phase, and the timing and modulus of loading are possible causes for failure of mini-implants.
Some researches have analyzed the effects of early loading in the healing process, and the protocol for mini-implant loading has been discussed. Wehrbein and Diedrich proposed a healing time of 25 weeks before load application. After that healing period, the implants were successfully loaded during 26 weeks with 2 N of force without problems. Some researchers postulated that, when the load is placed prematurely, there is no uniform intimate bone-implant contact because of the interplay of fibrous tissue. On the other hand, a review by Szmukler-Moncler et al summarized that micromovement is more harmful than the load during the early healing phase. Saito et al thought that 18 weeks was long enough for biologic fixation capable of resisting up to a load of 2 N for 24, 28, or 32 weeks. Aldikaçti et al applied a 2-N load after 6 weeks of healing. They used a long loading period of 52 weeks, and the mini-implants maintained stability throughout the study. In 2005, some authors proposed an early loading protocol for mini-implants after just 1 or 2 weeks of healing. Yao et al suggested that 2 weeks should be enough for soft-tissue healing. Kim et al loaded the mini-implants after 1 week and had a 9% failure rate after 10 weeks of continuous loading.
Immediate loading has also been described in clinical studies. Park et al applied 2 N of force for 36 weeks immediately after placing mini-implants in posterior sites. They obtained a success rate of 90%. Motoyoshi et al, using an immediate load in the same region and with the same force, had a success rate of 85.5%. The consensus in the early load protocol is that even experienced clinicians can have failures and that the removal of the mini-implant after the treatment is uneventful. Limited information is available about the effects of immediate loading on the biologic sequences of healing during the early phases of tissue integration, when the primary mechanical stability of mini-implants must be substituted for stability obtained through biologic means.
Our aim in this study was, therefore, to evaluate the interface reactions at early and late stages of osseointegration around mini-implants immediately loaded with 1 N. We used bright-field, polarized, and fluorescence microscopy for this evaluation.
Material and methods
The protocol for ths animal study was approved by the standing ethics committee on animal research of Oswaldo Cruz Foundation (Rio de Janeiro, Brazil), and all procedures were conducted in accordance with Canadian Council of Animal Care guidelines.
Eighteen 6-month-old male New Zealand white rabbits, weighing 3.0 to 3.5 kg, were used. The surgical procedures were common to all animals and consisted of placement of 4 mini-implants in the left tibial metaphyses of each animal. All surgeries were performed under sterile conditions in a veterinary operating room.
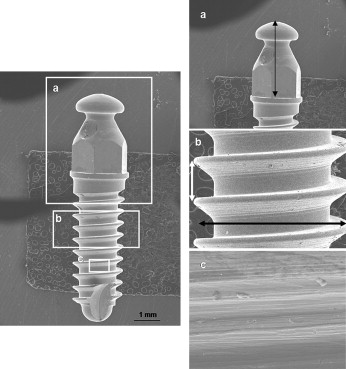
The titanium-aluminum-vanadium alloy mini-implants had a cylindrical screw design and a hexagonal head (6.0 × Ø 2.0 mm; Conexão Sistemas de Próteses, São Paulo, Brazil). They were machined by turning, cleaned, passivated with nitric acid, and sterilized by 25 Gy of cobalt radiation ( Fig 1 ).
The rabbits were acclimatized for a month in a vivarium before the surgical procedure. Immediately before the surgery, the animals were anesthetized with intramuscular injection of tiletamine (5 mg/kg) and zolazepan (5 mg/kg) followed by continuous delivery of 2% halothane and isofluthane throughout the surgery. The hair on the medial surface of the upper portion of the left leg was clipped and the skin was cleansed with iodinate surgical soap. An incision approximately 50 mm in length was made parallel to longitudinal axis of the tibia, in the medial aspect. The periosteum was elevated by using sterile surgical techniques, and the bone was denuded. Four implantation holes about 5 mm apart were drilled with a 1.6-mm drill under profuse sterile saline-solution irrigation and at low rotary speed. The mini-implants were threaded at the first cortex of the tibia with their longitudinal axes parallel to each other and perpendicular to the external cortical tibia. After placement, the 2 central mini-implants were immediately loaded with reciprocal forces. A nickel-titanium closed-coil spring was attached to the mini-implant’s head, providing 1 N of force. Then the periosteum was closed with resorbable sutures, and the skin was sutured.
After the surgical procedures, each animal had 4 mini-implants, 2 loaded and 2 unloaded, for a total of 72 mini-implants. Thirty mini-implants were used in this study, and the other 42 were analyzed by removal torque test and scanning electron microscope analysis in the first part of this study ( Table I ).
| New Zealand rabbits (n) | 18 | |
| Mini-implants (n) | 48 | 2.0 × 6.0 mm |
| Load | Immediate | 1 N |
| Time of healing | 1, 4, and 12 weeks | |
| Placement torque | 18 samples | |
| Histologic analysis | 30 samples | |
| Groups (n = 5) | 1wUn, 1wLo, 4wUn, 4wLo, 12wUn, 12wLo |
The experimental design was delineated to analyze 3 periods of healing: 1, 4, and 12 weeks. In each assessment period, there was 1 group loaded and another unloaded in a total of 6 groups (6 samples per group). In this manner, after each proposed time, 6 rabbits were killed by exsanguination.
Within 30 minutes after the rabbit’s killing, the placement surgical procedure described above was performed on each animal’s right leg; a new mini-implant per rabbit was placed for a total of 18 mini-implants. The maximum placement torque was measured with a manual torque meter ( Table I ). Thus, 48 mini-implants were used, from which 30 had the sequential interface reactions analyzed and 18 had the maximum torque insertion measured.
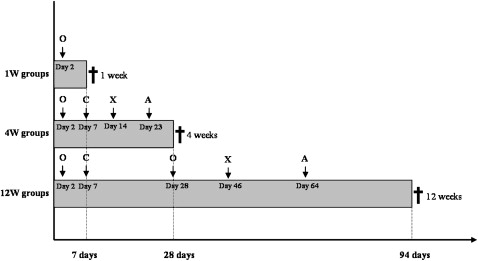
Quadruple polychromatic fluorescence labeling was performed after the second postoperative day ( Fig 2 ). The sequential administration of fluorescent dyes varied between the groups and followed the topographic localization and the rate of new bone formation. The animals received intramuscular injections of oxytetracycline (15 mg/kg of body weight), calcein blue (30 mg/kg of body weight), alizarin-complexone (30 mg/kg of body weight), and xylenol orange (90 mg/kg of body weight) diluted in 2% sodium carbonate solution.
After sample preparation, the slides were analyzed by using a fluorescence microscope (BX 51WI, Olympus, Tokyo, Japan) with filters with wavelengths of 450 to 490 nm (blue filter) and 340 to 380 nm (violet filter). The distance between the label marks was measured, and the mineral appositional rate (MAR) was calculated in micrometers per day. The MAR was measured in both sides of the unloaded samples and in the tension and compression sides of the loaded samples (2 measurements in each area).
After the healing period of 1, 4, or 12 weeks, the animals were killed, and the left leg of each rabbit was carefully sectioned and removed. The closed-coil springs were cut, and the tibia block specimens containing the mini-implants and at least 2 mm of surrounding tissue were dissected. The specimens were fixed (4% paraformoldehyde solution in 0.1 mol/L sodium phosphate buffer, pH 7.2), rinsed in the same buffer, and dehydrated in a graded ethanol series until absolute. Thereafter, the blocks were embedded in methylmethacrylate (Technovit 7100, Heraeus Kulzer, Dormagen, Germany) and sectioned in the longitudinal plane with a microtome (Exakt Medical Instruments, Oklahoma City, Okla). The thick slides were ground and polished to about 50 μm for fluorescent microscopic examination. Subsequently, the slides were stained with 2% toluidine blue for the bright-field microscopic examination and the histomorphometric measurements. Each tibia block sample was prepared to result in 1 central slide.
Histologic analysis was carried out by bright-field polarized light transmission microscopy. The microphotographic images were acquired by using 10, 20, and 40 objectives with a digital camera (EOS D-30, Canon, Tokyo, Japan) interfaced with a computerized system and the microscope. Before sample observation, a standard slide consisting of a linear gridline in micrometers was photographed for scaling the images. After obtaining the images, the measurements were made on each side of the bone within 1 mm 2 of the mini-implant surface, which corresponded to the bone interface at the first 2 screw threads. The Image J Launcher software (Java version 1.1.4. for Windows, Microsoft, Redmond, Wash) was used to measure and convert pixels to micrometers.
Two static variables were measured. The fractional bone-to-implant contact (% BIC) consisting of the linear bone-to-implant contact (μm) of the total of the mini-implant linear surface (μm) in the analyzed area and the fractional bone area (% BA) consisting of the total bone area (μm 2 ) of the total area analyzed (μm).
Statistical analysis
Statistical analyses for reporting means and standard deviations of data from MAR, % BIC, and % BA were performed for all groups. To quantify the significance of the differences, the data were evaluated by 2-way analysis of variance (ANOVA) followed by the post-hoc Tukey test and the t test ( P <0.05).
Results
The 48 mini-implants were placed without macro-deformation or fracture. The rabbits had no complications such as infection or leg fracture during the healing process.
All mini-implants monocortically placed into the rabbits’ tibia bones were clinically immobile after the surgical procedure. At sample preparation, 3 mini-implants exhibited excessive clinical mobility and were considered lost samples, yielding an overall success rate of 90%. These 3 failed mini-implants were in the 1-week loaded, 4-week unloaded, and 12-week unloaded groups.
The maximum placement torque was between 108.02 and 84.40 N mm (mean, 98.33 N per millimeter; SD, ± 9.52 N mm).
By polarized light, no micrographic signs of chronic inflammation at the interface at any healing interval were observed. The analysis showed monocortical fixation for all mini-implants. Bone deformations and microfractures were observed primarily in the 1-week groups; even so, the native bone around the mini-implants was preserved throughout the experiment ( Fig 3 ).
Corticalization was observed in some samples in the 4-week loaded group. The increase of cortical thickness was found only in the endosteal bone region, indicating primary bone formation in this area. Corticalization was also observed in the 12-week groups with periosteal and endosteal bone formation ( Fig 4 ).
After 1 week of healing, the mini-implants were embedded into the bone with the top and the peripheral portions of the pitches of the screw in close contact with the native bone. The portions between the pitches were filled by wound tissue, and no histologic difference was found between the loaded and unloaded samples ( Fig 5 , A and B ). Thus, the native lamellar bone was predominant, and it was not jeopardized by the immediate loading or the placement technique in this initial healing phase, providing mechanical stability for the mini-implants during the first healing period. In the 4-week groups, the relationship between the native bone, the mini-implant, and the interfacial tissue was maintained. The wound-tissue aspect was distinct between the loaded and the unloaded samples. The latter seemed to be less dense than the former, indicating a modified healing process ( Fig 5 , C and D ). After 12 weeks of healing, there was significant bone formation between the threads of the mini-implant in both the loaded and unloaded samples. Then most of the region initially filled by wound tissue was replaced by newly formed bone. There was no difference in the histologic findings between the compression and the tension sides of the loaded mini-implants; however, the tendency of differences between the loaded and unloaded samples was maintained. The loaded samples exhibited more organized tissues ( Fig 5 , E and F ).
The amount of osseointegration quantified by direct bone-to-implant contact (% BIC) and the area of bone observed between the threads of the screw (% BA) are listed in Tables II and III . The % BIC results ranged from 37.03% to 39.73% in the 1-week and 4-week groups, increasing to 66.01% and 70.96% after 12 weeks of healing ( Table II ). Similarly, the % BA results indicated significant increases in the 12-week groups, ranging from 64.45% to 70.35% after 1 and 4 weeks of healing, reaching 86.13% and 87.14% in the 12-week groups ( Table III ). The statistical analysis confirmed that, although there was no significant bone growth in the 1-week and 4-week groups, significant formation of new bone was indicated by both % BIC and % BA after 12 weeks, regardless of loading ( Tables II and III ). The compression and tension areas did not show significant differences at any healing time ( Table IV ).
| Histomorphometric values:% BIC rate (Mean ± SD) | |||
|---|---|---|---|
| Healing time | Unloaded | Loaded | |
| 1 week | 39.73 ± 5.7 a | 37.68 ± 6.1 a | |
| 4 weeks | 37.03 ± 5.0 a | 38.76 ± 3.4 a | |
| 12 weeks | 66.01 ± 10.9 b | 70.96 ± 7.1 b | |
| Term | Two-way ANOVA interaction: 1 × 2 | ||
| Load | Loaded × unloaded → P = 0.495 | ||
| Time | 1w × 4w → P = 0.927 | 1w × 12w → P = 0 .0001 | 4w × 12w → P = 0 .0001 |
| Histomorphometric values: % BA rate (Mean ± SD) | |||
|---|---|---|---|
| Healing time | Unloaded | Loaded | |
| 1 week | 66.40 ± 3.3 a | 69.57 ± 2.6 a | |
| 4 weeks | 64.45 ± 7.3 a | 70.35 ± 3.7 a | |
| 12 weeks | 86.13 ± 5.5 b | 87.14 ± 4.2 b | |
| Term | Two-way ANOVA interaction: 1 × 2 | ||
| Load | Loaded × unloaded → P = 0.128 | ||
| Time | 1w × 4w → P = 0.998 | 1w × 12w → P = 0 .0001 | 4w × 12w → P = 0 .0001 |
| t test for independent samples | |||||
|---|---|---|---|---|---|
| Time | Area | % BIC mean ± SD | % BA mean ± SD | % BIC | % BA |
| 1 week | Compression | 37.10 ± 6.78 | 70.32 ± 3.25 | P = 0.8105 | P = 0.4576 |
| Tension | 38.27 ± 5.11 | 68.89 ± 2.29 | |||
| 4 weeks | Compression | 39.16 ± 4.85 | 72.56 ± 3.21 | P = 0.7330 | P = 0.0577 |
| Tension | 38.36 ± 1.43 | 68.14 ± 3.10 | |||
| 12 weeks | Compression | 70.52 ± 6.78 | 87.18 ± 2.23 | P = 0.8578 | P = 0.9780 |
| Tension | 71.40 ± 8.18 | 87.10 ± 5.98 | |||
Stay updated, free dental videos. Join our Telegram channel
VIDEdental - Online dental courses


