Introduction
The purpose of this study was to determine the effect of miniscrew implant orientation on the resistance to failure at the implant-bone interface.
Methods
Miniscrew implants (IMTEC, Ardmore, Okla) were placed in 9 human cadaver mandibles, oriented at either 90° or 45° to the bone surface, and tested to failure in pull-out (tensile) and shear tests. The line of applied force and the orientation of the implants aligned at 45° were either parallel or perpendicular to the maximum axis of bone stiffness. In the shear tests, the implants aligned at 45° were angled toward and opposing the axis of shear force.
Results
The implants aligned at 90° had the highest force at failure of all the groups (342 ± 80.9 N; P <0.001). In the shear tests, the implants that were angled in the same direction as the line of force were the most stable and had the highest force at failure (253 ± 74.05 N; P <0.001). The implants angled away from the direction of force were the least stable and had the lowest force (87 ± 27.2 N) at failure.
Conclusions
The more closely the long axis of the implant approximates the line of applied force, the greater the stability of the implant and the greater its resistance to failure.
Despite the serendipitous discovery of the osseointegrative properties of titanium and the subsequent development of titanium dental implants in the 1960s, they were not used in orthodontics until the 1980s. However, dental implants have limited anatomic placement options and require a precise 2-stage protocol and a 3 to 6 month healing period. Recently introduced miniscrew implants (MSIs) can be easily placed in almost any intraoral region, have lower costs, are removed easily, and, consequently, have greater applications for orthodontic anchorage.
The success of any implant in providing definitive anchorage depends on its stability. Most clinical reports suggest that MSIs are stable with applied forces ranging from 50 g (0.5 N) to 450 g (4.5 N). However, miniscrews should not be expected to remain absolutely stationary during orthodontic loading; MSIs remain stable as bone remodeling takes place in response to mechanical stress. This is distinctly different from movements associated with pathology; these result in loosened MSIs. Although it seems well established that MSIs placed with appropriate surgical techniques can withstand forces in the orthodontic range (1-3 N), there is only limited information available concerning the maximum forces that can be applied to them.
Pull-out (tensile) tests are commonly used to evaluate the maximum forces that bone screws can withstand, and are considered an accurate method of comparing the relative strength or “holding power” of surgically placed bone screws. Tests have been conducted with various animal bones, including bovine femurs, porcine ribs, dog femurs, and sheep parietal bones. There have been only limited pull-out tests on human mandibles. Importantly, pull-out tests alone are not adequate for measuring the fixation potential of bone screws, because they do not address shearing forces. Even though pull-out and shear tests produce forces that substantially exceed those typically used by orthodontists, these tests provide valuable information pertaining to primary stability and material characteristics of MSIs.
There are presently no published data on the maximum pull-out and shear forces that MSIs can withstand, and there has been only limited pull-out testing of bone screws in actual anatomic bone sites. Furthermore, there are no published data on the effect of MSI placement orientation relative to the bone surface and the axes of maximum and minimum bone stiffness, despite recent evidence demonstrating consistent patterns of material anisotropy in the cortical bone of various regions of the human craniofacial skeleton.
The purpose of this study was to evaluate the effects of orthodontic MSI orientation on stability and resistance to failure at the bone-implant interface. The study was designed to answer the following questions. What is the maximum amount of force that can be applied to MSIs in the human mandible? Does loading orientation affect maximum force? Does the orientation of the long axis of the miniscrew relative to the surface of the bone and the direction of the applied force affect the implant’s stability and its resistance to failure?
Material and methods
Nine fresh-frozen, unembalmed, dentate, human cadaver mandibles donated for anatomic research purposes were selected for implant placement and testing. The mandibles came from 3 female and 6 male white donors between 48 and 81 years of age. No donors were known to have suffered from primary bone diseases.
For mounting purposes, impressions were taken of the test mandibles, and models were poured. Up to 3 custom acrylic (methylmethacrylate) bases were fabricated for each test mandible. To compensate for lingual surface variations, the acrylic base was adapted to the cortical surface of the entire lingual corpus and inferior ramus. The opposite side of the acrylic base was ground to a level plane. The acrylic base allowed rigid fixation of the mandible to the test equipment while maintaining the test site surface orientation perpendicular to the line of force in the pull-out tests and parallel to the line of force in the shear tests. Then the custom fit to each lingual surface allowed for uniform distribution of reaction forces during the application of test loads. It prevented the development of internal stress/strain induced by flexure secondary to fixation of the mandible to the test apparatus. An anterior hole near the mental foramen and a posterior hole in the inferior ramus were drilled through the bone sample and the custom acrylic support base to allow rigid fixation of the mandible to the test equipment.
The tensile and shear testing was completed with a universal testing machine (model DDL 200RT, TestResources, Shakopee, Minn), outfitted with a 112-pound calibrated load cell used in tensile mode. Adjustable x-axis and y-axis sliding tables (Sherline Products, Vista, Calif) were mounted to the base of the testing machine. A 360° rotational table (Sherline Products) was mounted on top of the sliding tables horizontally for pull-out tests and vertically for shear tests. A mounting plate was fabricated from a 0.5 × 3 × 9-in aluminum bar and attached to the 360° rotational table. Bolts were used to secure the test mandible and its acrylic base to the mounting plate.
A custom implant holder was attached to the load cell of the testing machine. It was designed to allow for rotational and x-y freedom during attachment of the test implants to the tensile machine. The bottom part of the implant holder was fabricated from a 6.4-mm diameter aluminum cylinder with a 2-mm key way cut in its base to a depth of 4 mm. This space gave the head of the implant 0.4 mm of horizontal and 0.5 mm of vertical clearance. A 1.0-mm hole was drilled perpendicular to the key way at a point 2.0 mm from the base. A 0.028-in piece of stainless steel orthodontic wire was run through the implant holder and the hole in the head of the implant to secure the implant to the implant holder.
MSIs (IMTEC, Ardmore, Okla), 6 mm long and 1.8 mm in diameter, were placed in the buccal cortex of the mandible, at angles of either 90° or 45° to the buccal surface. They were tested to failure by using pull-out and shear tests directed along the axes of maximum and minimum bone stiffness. The design test matrix consisted of 9 subgroups of 10 implants each ( Fig 1 ). Three subgroups were pull-out tests. The remaining 6 were shear tests. Three shear tests were sheared parallel to the maximum axis of bone stiffness, and 3 were sheared parallel to the minimum axis of bone stiffness, which is perpendicular to the axis of maximum bone stiffness.
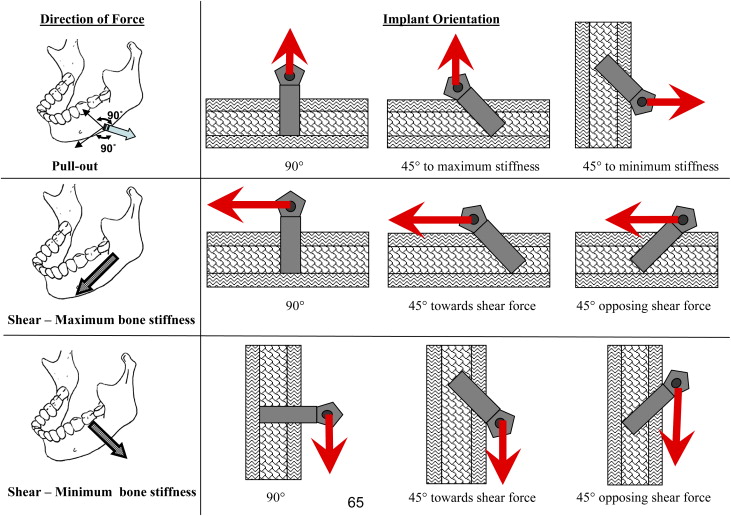
The pull-out tests consisted of MSIs in 1 of 3 orientations: placed orthogonally to the buccal surface, angled at 45° along the maximum axis of bone stiffness, and angled at 45° along the minimum axis of bone stiffness. All 3 implant orientations were tested to failure in pull-out tests in which the line of force was at 90° to the bone surface.
In both sets of the shear tests, along the axis of either maximum or minimum bone stiffness, the MSIs were in 1 of 3 positions: orthogonal to the buccal surface, angled at 45° toward the same direction as the line of shear force, and angled at 45° opposite the line of shear force. All MSI orientations were tested to failure in a shear test in which the line of shear force was along the bone surface and in a direction parallel to the maximum or minimum axis of bone stiffness. The maximum force at failure in the pull-out and shear tests and the cortical thickness were recorded for each sample.
Bone-implant test sites were selected on the buccal cortex of the corpus of the mandibles so that no proximate defects could adversely affect the test results. A 1.1-mm pilot drill was used to prepare the MSI site; the pilot holes were drilled only through the cortex. A guide was fabricated and used with the pilot drill to ensure the proper orientation for the MSIs oriented at 45° to the bone surface. After the pilot holes were drilled, the MSIs were placed according to the manufacturer’s specifications. Once the MSI was placed, the test mandible was set in the custom acrylic base and fixed to the mounting plate anteriorly and posteriorly. The mandible was then oriented to obtain the correct position of the test site relative to the actuator, as previously described.
With the mandible secured to the test holder and appropriately positioned, a digital photograph of the implant was taken (DXC-390P digital video, Sony, New York, NY; macro lens, Konica Minolta, Wayne, NJ; and imaging software, SCION, Frederick, Md). The 0.028-in stainless steel orthodontic wire was inserted through the holder and the MSI, and the load screw was activated to eliminate any play between the MSI and the load cell. The tensile machine position was then zeroed, and the test began with the machine moving at a rate of 2 mm per minute. Data collected digitally included time, load, and position during each test. At regular intervals during the testing, digital photographs were recorded and identified with load or position information to document the changes of the implant-bone interface during testing. At failure of the implant-bone interface, the test was discontinued, the test data were saved, and a final digital image of the postfailure implant-bone interface was recorded. For each test, maximum force at failure was recorded.
During testing, the mandibles were kept moist. All tests were conducted with the mandibles at room temperature (22°C). The mandibles were stored by wrapping them in wet paper towels, placing them in sealable plastic bags, and freezing them at –5°C. Freezing does not adversely affect the elastic properties of bone measured ultrasonically, although it might have some minor effects on mechanically determined material properties.
Statistical analysis
Preparation of all mandibular specimens, testing, and data recording were performed by 1 tester (M.B.P.). Statistical analysis was completed with statistical software (version 14.0, Minitab, State College, Pa). Although the variables’ distributions were normal, nonparametric Kruskal-Wallis tests were used for the comparisons because of the small sample sizes of the subgroups. The significance level of P <0.05 was used for all tests.
Results
The pull-out tests of the MSIs aligned at 90° to the cortical surface had a significantly higher maximum force at failure (342 ± 80.9 N; P <0.001) (mean ± standard deviation) than all other test groups ( Table , Fig 2 ). The loading curve for all 3 pull-out test groups was largely linear until immediately before failure ( Fig 3 , A ).
| Maximum force at failure | |||||
|---|---|---|---|---|---|
| Test type | Implant orientation | Mean (n) | SD (n) | Min (n) | Max (n) |
| Pull-out | 90° | 341.85 ∗ | 81.0 | 257.0 | 493.2 |
| 45° maximum stiffness | 107.9 | 32.1 | 71.5 | 160.1 | |
| 45° minimum stiffness | 141.4 | 57.0 | 92.8 | 250.8 | |
| Shear test (direction of maximum bone stiffness) | 90° | 123.8 | 26.5 | 85.3 | 179.3 |
| 45°-opposite force | 102.3 | 25.4 | 74.7 | 163.0 | |
| 45°-same as force | 253.34 ∗ | 74.1 | 152.5 | 355.6 | |
| Shear test (direction of minimum bone stiffness) | 90° | 138.1 | 34.6 | 88.5 | 174.0 |
| 45°-opposing force | 87.5 | 27.2 | 62.2 | 123.0 | |
| 45°-same as force | 264.16 ∗ | 21.0 | 230.2 | 278.3 | |
∗ Maximum force at failure was significantly higher than other tests with P <0.001.
At failure, 1 of 2 bone-implant interface configurations was generally seen. In most cases, the bone remained in intimate contact with the MSI at failure. For MSI failures with intact bone, the 90° MSIs often had an elliptical surface outline with a conical cross-sectional shape. Generally, the greatest dimension of bone was in the direction of maximum bone stiffness ( Fig 4 , A ). In other cases, the MSI separated from the bone, with cortical splinters of bone projecting upward in the direction of the pull-out test.
The pull-out tests of the MSIs aligned at 45° to the bone surface—oriented in the direction of either the minimum or maximum bone stiffness—had a bone-failure wedge in the 135° angle between the MSI and the surface of the bone ( Fig 4 , B ). Similar to the pull-out tests of the MSIs aligned at 90° to the cortical surface, the widths of the bone fragments were smaller for the MSIs oriented along the direction of maximum bone stiffness than for the MSIs oriented along the direction of minimum bone stiffness.
The maximum forces at failure in tests of MSIs angled 45° toward the line of shear force in the direction of maximum bone stiffness (253 ± 74.1 N; P <0.001) and those in the direction of minimum bone stiffness (264 ± 21.0 N; P <0.001) were significantly higher than the other 4 test groups ( Table ).
The 45° MSIs opposing the shear line of force most often failed in a bimodal fashion ( Fig 3 , B ). The loading curve was initially similar to the other test subgroups until primary failure, which occurred as the MSI started to rotate from the original 45° placement. The loading curve generally flattened while the MSI “reoriented” to approximately 90° relative to the cortical surface; as the MSI continued to rotate from 90° to 45° in the same direction as the applied force, the loading curve usually increased until final failure of the MSI-bone interface.
Shear tests of the MSIs aligned 90° to the cortical surface also demonstrated a nonlinear loading curve ( Fig 3 , C ). Similar to the MSIs aligned at 45°and opposing the shear line of force, the loading curve fell after an initial linear loading response. The slope of the increasing load response decreased but remained positive until failure. Unlike the MSIs aligned 45° to the cortical surface and opposing the shear line of force, a single point of primary failure was not clearly identifiable.
Stay updated, free dental videos. Join our Telegram channel
VIDEdental - Online dental courses


