Introduction
Our aim was to assess effectiveness of the cervical vertebral maturation (CVM) method to predict circumpubertal craniofacial growth in the postpeak period.
Methods
The CVM stage was determined in 176 subjects (51 adolescent boys and 125 adolescent girls) on cephalograms taken at the end of treatment (T2; mean ages, 15.75 years [boys] and 15.23 years [girls]) in subjects from the postretention database at the University of Washington in Seattle. Craniofacial growth was evaluated from the following measurements on cephalograms at T2 and end of follow-up (T3) (mean ages, 29.01 years [men] and 28.08 years [women]): condylion to gnathion, condylion to gonion, gonion to gnathion, sella to gnathion, nasion to menton, anterior nasal spine to menton, and sella to gonion. The change of each variable from T2 to T3 was assessed with paired t tests. Parametric ( t tests or analysis of variance [ANOVA]) or nonparametric (Mann-Whitney or Kruskal-Wallis) tests were used to detect intergroup differences.
Results
One hundred eight subjects (35 boys, 73 girls) demonstrated CVM stage 3, 56 (16 boys, 40 girls) were in CVM stage 4, and 12 (all girls) were in CVM stage 5 at T2. Intrasex comparisons showed that boys in CVM stages 3 and 4 could be differentiated regarding changes of all variables. In the girls, only those in CVM stages 3 and 4 could be differentiated based on the amount of changes of 2 measurements: condylion to gonion and sella to gonion. Intersex comparisons showed that boys in CVM stage 3 had significantly more changes than girls ( P <0.01). Boys in CVM stage 4 showed significant differences compared with girls in CVM stage 4 for only 2 variables (sella to gonion and condylion to gonion; P <0.001 and P = 0.012, respectively).
Conclusions
The CVM method was modestly effective in determining the amount of postpeak circumpubertal craniofacial growth.
Data from randomized, controlled clinical studies on Class II treatment suggested that skeletal effects with various protocols carried out in prepubertal children are of minor importance in the correction of Class II molar relationships. However, the frequently observed improvement of a profile during treatment is directly related to the size or the position of the mandible. Findings of the investigations that aimed to elucidate this disparity implied that, when treatment of Class II malocclusion starts just before the pubertal growth spurt, skeletal effects are larger and lasting compared with treatment completed before the circumpubertal growth peak. Cozza et al in their systematic review found that the amount of supplementary mandibular growth appeared to be significantly larger if the functional treatment was performed at the pubertal peak in skeletal growth. Baccetti et al compared mandibular morphology in patients treated early vs late and concluded that the optimal timing for Twin-block therapy for a Class II disharmony was during or slightly after the pubertal peak in growth velocity.
On the contrary, treatment of some orthodontic problems necessitates little or no craniofacial growth. A planned camouflage in Class III subjects will be successful if facial growth is complete. If the mandible outgrows the maxilla during treatment, achievement of stable correction is questionable. In children with congenitally missing lateral incisors, an implant-based restoration is often the method of choice. Since implants behave like ankylosed teeth, early implantation could lead to submergence of the implant crown and cause an esthetic disaster. Coming of age is often recommended as the suitable time to start treatment. Nevertheless, chronologic age was shown to be poorly correlated with development. Cessation of craniofacial growth in early maturers is probably complete a few years earlier than in late maturers. Consequently, starting treatment according to chronologic age irrespective of the patient’s maturity is not always appropriate.
Among methods for assessment of craniofacial maturity, the cervical vertebral maturation (CVM) method has recently gained popularity because of its ease and postulated accuracy. The most frequently used modification of the CVM method was based on the cephalometric analyses of longitudinal records of 9 boys and 15 girls. Through discriminant analysis, several CVM stages were established that were intended to correspond to skeletal maturity and, hence, future facial growth. Although an objective of the CVM method is to predict the peak velocity of growth, it should indirectly point to how much postpeak growth change is expected. However, the small sample size used to devise the CVM method and the lack of validation raise doubts about its effectiveness, especially in the later stages of development when growth tapers off. These reservations are supported by the findings of Baccetti et al, who examined growth changes in a cross-sectional sample of 1091 Class III subjects and found that the CVM method detected between-stage growth alterations only in approximately 25% of the performed measurements. Moreover, some children go through a prolonged period of accelerated growth without a distinct growth peak. It is unclear whether the CVM method can be an effective predictor in these subjects.
Therefore, our aim in this study was to assess the effectiveness of the CVM method to predict circumpubertal craniofacial growth in the postpeak period.
Material and methods
A sample from a study on incisor stability was used in this investigation; 83.7% of the subjects from the original sample comprising 301 subjects from the postretention collection in the Department of Orthodontics at the University of Washington in Seattle had their CVM status established. Only those with a CVM status that met the following supplementary inclusion criteria were chosen: good-quality lateral cephalograms made at the end of orthodontic treatment (T2) and at least 10 years out of retention (T3), no orthognathic surgery, and no additional orthodontic treatment between T2 and T3. The enlargement factor of most cephalograms could not be determined, so, to minimize the influence of enlargement, only subjects with cephalograms taken at T2 and T3 in the same cephalostat were finally included.
The length of follow-up was calculated by subtracting the T2 date from the T3 date. Patient information and treatment history for all subjects were obtained from the database. Age at the end of treatment and sex were recorded.
Lateral cephalograms taken at T2 were used to determine the CVM stage. The assignment of the CVM stages is described elsewhere. To summarize, on each cephalogram, the second, third, and fourth cervical vertebrae (C2, C3, and C4) were identified. The landmarks and measurements we used are presented in Figure 1 . The CVM stages are shown in Table I .
| CVM stage | Vertebral body shape |
|---|---|
| 1 | C3 and C4 flat |
| 2 | C3 concavity ≥1 mm; C4 flat |
| 3 | C2, C3, and C4 concavity ≥1 mm; C3 and/or C4 tapered or horizontal rectangular |
| 4 | C3 and/or C4 square; if C3 or C4 are not square, then horizontal rectangular |
| 5 | C3 and/or C4 vertical rectangular |
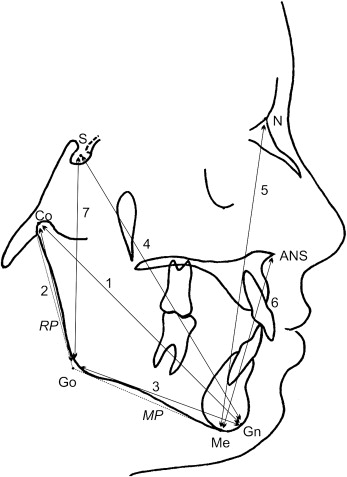
Craniofacial growth was evaluated on lateral cephalograms taken at T2 and T3. The landmarks identified and the measurements made according to the study that described the CVM method are given in Figure 2 .
Statistical analysis
Descriptive statistics (means and standard deviations) were computed for age and length of follow-up in each CVM group. For the craniofacial measurements, means, standard deviations, and 95% confidence intervals were calculated.
Paired t tests were used to assess craniofacial growth in each group. Shapiro-Wilks tests were used to evaluate normality of distribution in each group. In case of normal distribution, independent t tests or analysis of variance (ANOVA) were run. If distribution was not normal, nonparametric tests, Mann-Whitney for 2-group comparisons or Kruskal-Wallis for 3-group comparisons, were carried out. The Dunn multiple comparison procedure with the Bonferroni adjustment was used for intergroup differences.
At P <0.05, the difference was considered significant. At P <0.1, the difference was considered marginally significant.
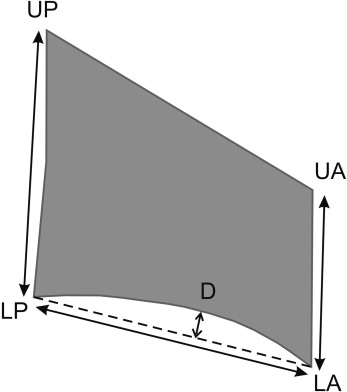
The reproducibility of the measurements was assessed by statistically analyzing the difference between double measurements taken 1 week apart on 25 cephalograms selected at random. The error of the method was calculated from the equation:
S X = ∑ D 2 2 N
with D representing the difference between the corresponding first and second measurements and N the number of double determinations.
Intraobserver agreement for the CVM stage assignment was calculated as the Pearson correlation coefficient and proportionally weighted kappa coefficient based on 2 assignment sessions a week apart.
Results
A total of 252 subjects were initially identified; 61 were excluded for lack of good-quality cephalograms taken in the same cephalostat at T2 and T3, and 15 of the remaining 191 subjects were in CVM stages 1 and 2 (7 and 8 children, respectively), indicating prepubertal development, and were excluded. The final sample included 176 subjects: 29% male and 71% female. The sample characteristics are presented in Table II .
| Males | Females | Males + females | |||||||||||||
|---|---|---|---|---|---|---|---|---|---|---|---|---|---|---|---|
| Age (y) | Follow-up length (y) | Age (y) | Follow-up length (y) | Age (y) | Follow-up length (y) | ||||||||||
| CVM stage | n | Mean | SD | Mean | SD | n | Mean | SD | Mean | SD | n | Mean | SD | Mean | SD |
| 3 | 35 | 15.68 | 1.29 | 13.31 | 4.60 | 73 | 14.96 | 1.52 | 12.92 | 4.06 | 108 | Not pooled ∗ | 13.05 | 4.23 | |
| 4 | 16 | 15.92 | 1.07 | 12.31 | 5.29 | 40 | 15.62 | 1.25 | 12.73 | 2.99 | 56 | 15.71 | 1.20 | 12.60 | 3.76 |
| 5 | 0 | – | – | – | – | 12 | 15.55 | 1.20 | 12.83 | 4.28 | 12 | 15.55 | 1.20 | 12.83 | 4.28 |
| 51 | P = 0.589 | P = 0.924 | 125 | P = 0.016 † | P = 0.970 | 176 | P = 0.996 | ||||||||
Stay updated, free dental videos. Join our Telegram channel
VIDEdental - Online dental courses


