Introduction
Upper airway measurement can be important for the diagnosis of breathing disorders. Acoustic reflection (AR) is an accepted tool for studying the airway. Our objective was to investigate the differences between cone-beam computed tomography (CBCT) and AR in calculating airway volumes and areas.
Methods
Subjects with prescribed CBCT images as part of their records were also asked to have AR performed. A total of 59 subjects (mean age, 15 ± 3.8 years) had their upper airway (5 areas) measured from CBCT images, acoustic rhinometry, and acoustic pharyngometry. Volumes and minimal cross-sectional areas were extracted and compared with software.
Results
Intraclass correlation on 20 randomly selected subjects, remeasured 2 weeks apart, showed high reliability (r >0.77). Means of total nasal volume were significantly different between the 2 methods ( P = 0.035), but anterior nasal volume and minimal cross-sectional area showed no differences ( P = 0.532 and P = 0.066, respectively). Pharyngeal volume showed significant differences ( P = 0.01) with high correlation (r = 0.755), whereas pharyngeal minimal cross-sectional area showed no differences ( P = 0.109). The pharyngeal volume difference may not be considered clinically significant, since it is 758 mm 3 for measurements showing means of 11,000 ± 4000 mm 3 .
Conclusions
CBCT is an accurate method for measuring anterior nasal volume, nasal minimal cross-sectional area, pharyngeal volume, and pharyngeal minimal cross-sectional area.
Highlights
- •
Correlation between cone-beam computed tomography (CBCT) and acoustic reflection methods was high.
- •
No differences were found between methods when measuring anterior nasal volume.
- •
No differences were found between methods when measuring nasal minimal cross-sectional area.
- •
Pharyngeal volume and minimal cross-sectional area measurements were also similar.
- •
CBCT is an accurate method for the measuring some parts of the upper airway.
The measurements of the upper airway can be significantly important for the diagnosis of breathing disorders. A partial or complete collapse of the upper airway during sleep is the hallmark of sleep apnea. Sleep-disordered breathing was defined as weekly occurrences of loud snoring; gasping, choking, or snorting; awakening with gasping or choking; or momentary periods of stopped or abnormal breathing. More than 20% of adolescents snore at least a few nights per month, 6% snore every night or nearly every night, and apnea-like symptoms affect from 2.5% to 6.1% of adolescents. Even though sleep studies are still the official method to diagnose sleep-disordered breathing conditions, using imaging techniques, the clinician can assess potential risk factors of patients for a more complete pretreatment diagnosis.
Airway analysis usually consists of nasal passage and oropharynx volumes and assessment of areas of maximum constriction. Acoustic reflection (AR), first described over 25 years ago, has been used in many industries and is probably one of the most accepted tools for studying the airway. This noninvasive technique uses sound waves that go through the airway and back, collecting data and calculating volumes and areas of maximum constriction. Its accuracy and reliability have been examined with special focus on the anterior nasal passage and the most constricted areas in both the nasal passage and the oropharynx. AR encounters some limitations when the airway becomes narrower, and the sound waves have difficulty getting back to the sensor. The acoustic pharyngometry technique has been validated against computed tomography scans and experimental models. Hoffstein and Fredberg reported that using the acoustic reflective method can accurately measure the upper airway and is highly reproducible.
Cone-beam computer tomography (CBCT) was created by Robles RA in 1982 for angiography purposes. CBCT captures different images while rotating around the patient’s head and creates a 3-dimensional (3D) volume, in a similar way as computed tomography, but in a volumetric way that allows a single rotation, resulting in a much lower radiation dose. Further changes in the capturing methods used by CBCT have recently allowed for less radiation to the patient than traditional 2-dimensional radiographs.
Aboudara et al reported one of the first studies that tried to measure the volume of the nasopharynx with CBCT and concluded that airway measurements with CBCT can be accurately achieved by segmentation of the image. In medical imaging, segmentation is defined as the construction of 3D virtual surface models to match the volumetric data. Upper airway segmentation can be either manual or semiautomatic. In the manual approach, the segmentation is performed slice by slice by the user. This method is time-consuming and almost impractical for clinical applications. On the contrary, semiautomatic segmentation of the airway is significantly faster than manual segmentation. Ghoneima and Kula suggested that CBCT measurement of the upper airway is an accurate and reliable technique to quantify airway volume and minimal cross-section area; their result is consistent with the previous findings by Tso et al. El and Palomo tested manual segmentation compared with different methods of semiautomatic segmentation and found that different software programs gave different values, but showed great correlations, suggesting systematic error. Weissheimer et al confirmed those conclusions and reported that upper airway measurements using Mimics, Dolphin3D, ITK-Snap, and OsiriX were similar and more accurate than InVivo Dental and Ondemand 3D.
The question of how useful and complete is the CBCT airway assessment is still controversial, since it is based on a static capture, whereas the airway is a dynamic structure.
The aim of this study was to compare CBCT upper airway analysis with the dynamic AR method.
Material and methods
Institutional review board approval was obtained from Case Western Reserve University before this study. Subjects were recruited from the Craniofacial Imaging Center at Case Western Reserve University in Cleveland, Ohio. Inclusion criteria consisted of subjects seeking orthodontic treatment who were referred for CBCT imaging at the craniofacial imaging center. No CBCT image was taken for research purposes only. The subjects’ records included CBCT images and AR. All CBCT images were taken using a custom low-dose scanner, CB MercuRay (Hitachi Medical Systems of America, Twinsburg, Ohio), using 2 mA, 120 kV(p), resulting in a voxel size of 0.37. The patients were instructed to close their eyes, swallow once, bite down, and hold still during the acquisition of the CBCT images. Subjects with intraoral appliances, congestion, or asthmatic conditions were excluded. A sample size calculation was performed using a pilot study with 10 subjects, suggesting that 39 subjects was necessary for a confidence level of 95%. A sample of 59 subjects was recruited and used in this project.
AR consists of 2 separate analyses with separate sensors, acoustic rhinometry, and acoustic pharyngometry. Acoustic rhinometry is used to measure the nasal cavity and requires a nasal mask, whereas acoustic pharyngometry is for pharyngeal areas and uses a mouthpiece ( Fig 1 ). For all AR imaging, the Eccovision system (Sleep Group Solutions, Hollywood, Fla) was used.
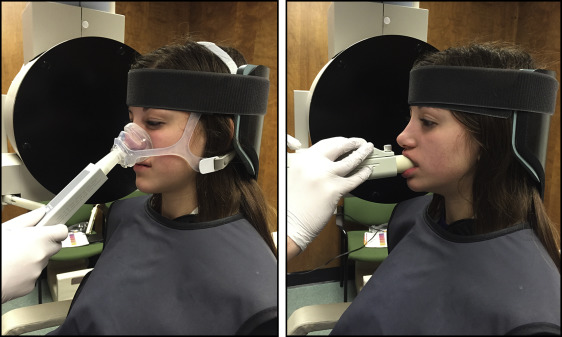
For all subjects, the CBCT image, acoustic rhinometry, and acoustic pharyngometry were taken on the same day by 1 operator (I.A.T.) with the patient sitting on the same chair, with the same head orientation. Calibration and orientation of the acoustic techniques were performed before each measurement. Patients were instructed to breathe normally during the measurement, and 4 separate measurements were taken for each acoustic rhinometry, and acoustic pharyngometry ( Fig 2 ).
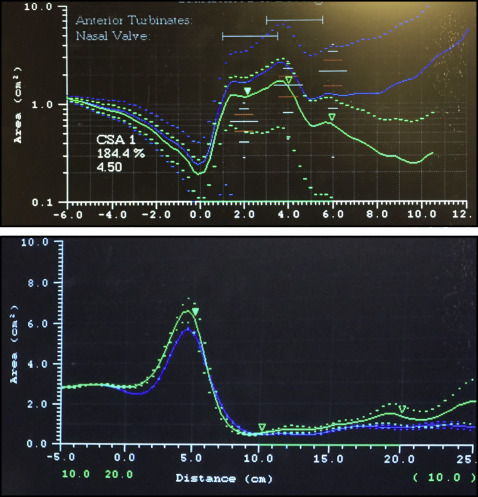
The graphs generated by acoustic rhinometry and acoustic pharyngometry show different areas of constriction on the x-axis and y-axis, giving the distance that sound has traveled. The areas under the graphs represent the volume at a certain distance. For acoustic rhinometry, we calculated the area under the graph to the first most constricted area, which is often identified as the nasal valve. Acoustic rhinometry reported the area in this region and is recorded as the anteriormost constricted area.
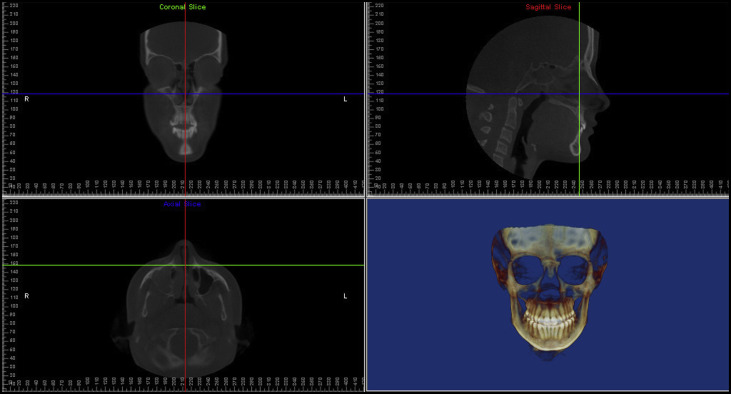
All CBCT images were imported into the Dolphin 3D Imaging program (version 11.0; Dolphin Imaging and Management Solutions, Chatsworth, Calif), where they were oriented according to the technique of Wu et al ( Fig 3 ). Data collected from the CBCT images included total nasal volume, anterior nasal valve volume, nasal minimal cross-sectional area, pharyngeal volume, and pharyngeal minimal cross-sectional area ( Fig 4 ).
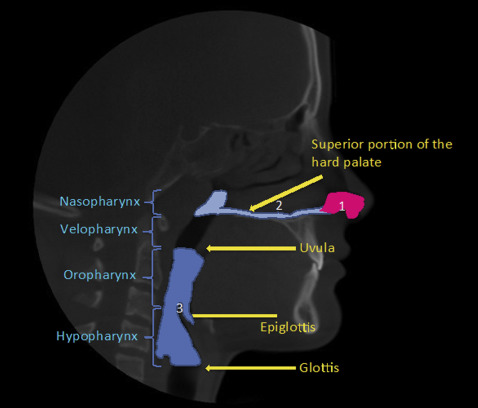
For all nasal data, after orientation of the skull, a vertical plane was constructed perpendicular to the horizontal border. The vertical plane was then used to rotate the axial slice by 90°, making it parallel to the horizontal line. After the skull was properly oriented, borders of the nasal passage were drawn on all 3 slices: axial, coronal, and sagittal. The nasopharyngeal volume was defined as the pharyngeal volume located between the palatal plane and a parallel plane passing through the last axial slice before the nasal septum fused with the posterior pharyngeal wall. The effects of paranasal sinuses and acoustic resonances in the nasal cavity are not accounted for in our AR algorithms; therefore, the CBCT measurements will not include the sinus and parasinus areas. The minimum cross-sectional area for that volume was also calculated. The nasal valve was identified using the cross-sectional slices right before the passage was slit into several narrow pathways ( Fig 5 ).
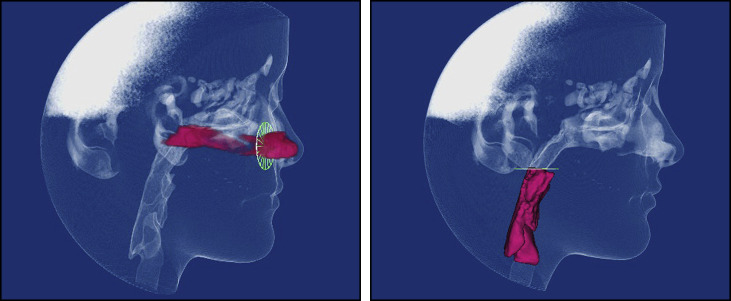
All pharyngeal data were collected from a predetermined pharyngeal area. The superior border started by moving downward parallel to the palatal plane (ANS to PNS) until it reached the end of the uvula in the axial plane. The glottis marked the most inferior point in this cavity, which has a prominent notch after the epiglottis. The volume in this cavity was generated with its minimal cross-sectional area ( Fig 5 ).
Statistical analysis
All CBCT, acoustic rhinometry, and acoustic pharyngometry data were imported into an Excel spreadsheet (Microsoft, Redmond, Wash), and statistical analysis was performed using SPSS software (version 22; IBM, Armonk, NY). Normal distribution of the data was tested using the Shapiro-Wilk test. The only variables showing normal distributions were total nasal volume, anterior nasal valve volume, and anterior nasal cavity. Paired t tests were used for variables showing normal distribution, and the Wilcoxon signed rank test was used for data not normally distributed.
Results
The sample included 59 subjects (34 female) with a mean age of 15.4 ± 3.8 years ( Table I ).
| Sex (n) | Age (y) | Race (n) | |
|---|---|---|---|
| Male (25) | 15.12 ± 2.57 | White | 20 |
| Asian | 2 | ||
| Hispanic | 2 | ||
| African American | 1 | ||
| Female (34) | 15.61 ± 4.5 | White | 30 |
| Asian | 1 | ||
| Hispanic | 0 | ||
| African American | 3 | ||
| Total (59) | Mean 15.41 ± 3.8 | Mode white | |
Stay updated, free dental videos. Join our Telegram channel
VIDEdental - Online dental courses


