Introduction
Orthodontic elastomeric chains are commercially available in various colors from many manufacturers. In this study, we investigated the viscoelastic properties of elastomeric chains using dynamic mechanical analysis to perform color and brand comparisons.
Methods
Ten colors of Sunburst chains (GAC International, Bohemia, NY) were selected for the color study. Three colors of Sunburst, Bobbin Alastik (3M Unitek, Monrovia, Calif), and Energy (Rocky Mountain Orthodontics, Denver, Colo) chains were selected for the brand study. Nine specimens of each type were measured and tested. Dynamic mechanical analysis was performed at room temperature at 8 frequencies ranging from 0.125 to 16.0 Hz. Three variables (storage stiffness, loss stiffness, and tan δ) were analyzed by using repeated-measures analysis of variance (ANOVA) and pairwise t tests, comparing all frequencies for each specimen type and all specimen types for each frequency (with Bonferroni corrections). Significance was set at α = 0.05.
Results
Significant differences were found among all specimen dimensions, all frequencies, and all 3 dynamic mechanical analysis variables in both the color and brand studies. Comparisons focused on tan δ, which does not depend on specimen dimensions as do storage stiffness and loss stiffness.
Conclusions
Statistically significant differences in tan δ values among colors were relatively small, so the clinical significance is questionable and requires further investigation. Differences in tan δ values among brands were greater and more likely to be clinically significant. Further studies are needed to relate viscoelastic properties to force decay.
Elastomeric chains are routinely used in orthodontics to close interdental spaces and to reposition teeth. They consist of circular links joined by connectors of varying lengths and are readily available from many commercial sources in a wide variety of colors. Elastomeric chains are easily applied and well tolerated by most patients. However, it is difficult for clinicians to control the forces delivered by elastomeric chains, and there is insufficient information available for clinicians to know whether 1 chain color or brand is clinically superior to another.
Orthodontists began using elastomeric chains in the 1960s, and researchers began investigating their properties in the 1970s. Most elastomeric chains are made from polyurethane combined with proprietary fillers and pigments, and are generally manufactured by die cutting (stamping) or injection molding. Although a few studies have examined residual stresses, microstructures, compositions, and glass transition temperatures, most previous elastomeric chain studies have focused on initial forces and force decay.
In 1994, Baty et al reviewed most of the elastomeric chain studies performed in the 1970s, 1980s, and early 1990s. These authors observed that different types of chains generated widely varying initial force levels when stretched the same amount. They also reported that clinicians should expect most elastomeric chains to lose 50% to 70% of their initial force during the first 24 hours and 60% to 70% of their initial force during the first 3 weeks of activation. More recent articles reported that different brands of chains lose 22% to 72% of their initial force over a 1-month period. These reported differences in initial forces and force decay by the various chains could have considerable clinical significance.
Baty et al noted that there was little evidence of pigmentation effects on initial forces and force decay in the early elastomeric chain studies. Few recent studies have investigated pigment effects on initial forces and force decay in the same brand of elastomeric chains. Lu et al found that gray and clear chains from American Orthodontics had different force decay behaviors. In their laboratory investigation, Baty et al found that force decay of the green and purple chains from Ormco differed from the gray chains at only 1 load level and time point. In contrast, numerous recent articles have shown differences in initial forces and force decay of various brands of elastomeric chains.
Force decay studies of elastomeric chains are inherently tedious and time consuming. A proposed alternate approach to directly measuring force decay of elastomeric chains is to measure their viscoelastic properties. Dynamic mechanical analysis (DMA) is a well-established method for measuring viscoelastic properties of polymers. It is reasonable to expect that chains with more viscous charactereristics will experience more force decay than chains with more elastic characteristics. There are currently no published studies that have used DMA to evaluate elastomeric chains.
Althoughy relating viscoelastic properties to force decay was beyond the scope of this project, the objectives of this study were (1) to demonstrate the use of DMA as a method for evaluating the viscoelastic behavior of elastomeric chains, (2) to determine whether there were differences in the viscoelastic properties among 10 colors of 1 brand of elastomeric chain, and (3) to determine whether there were differences in viscoelastic properties among 3 brands of elastomeric chains.
Material and methods
A testing machine (ElectroForce; Bose, ElectroForce Systems Group, Eden Prairie, Minn) was used for all tests in this study. It was equipped with a 450-N load cell and digital controls, and its displacement range was ±5 mm. Custom test fixtures were designed and fabricated to hold the elastomeric chains during testing.
In the color comparison study, we used short-span, die-cut Sunburst elastomeric chains (GAC International, Bohemia, NY). Ten colors of GAC International chains were obtained in 15-foot spools (1 spool of each color). These 10 colors were selected: clear, silver, black, red, orange, yellow, green, blue, purple, and bright pink. This choice represents a broad spectrum of colors popular among orthodontic patients.
In the brand comparison study, we used 3 brands and 3 popular colors of each brand (black, silver/gray, and clear) of elastomeric chains. All chains were short span/closed link and die cut. One spool of each of the following chain brands and colors was obtained: (1) Sunburst (black, silver, and clear) (GAC International), (2) Bobbin Alastik (black, gray, and clear) (3M Unitek, Monrovia, Calif), and (3) Energy (black, gray, and clear) (Rocky Mountain Orthodontics, Denver, Colo).
The same spools, but different specimens, of the GAC International chains were used for both the color and brand comparison studies. All specimens of a given type were obtained from the same region of the spool, although the GAC International specimens for the color and brand studies were taken from different regions of their spools. All chains were tested in as-received condition at room temperature in laboratory air.
Each test specimen consisted of 5 links. The first and fifth links were attached to the test fixtures, with 3 links between the fixtures. One additional link was included on each end of each specimen to assist with placement on the fixtures. Each specimen was visually inspected before testing to ensure that it was free from gross manufacturing defects.
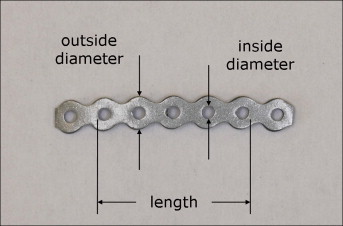
Before testing, the length, thickness, inside diameter, and outside diameter of each specimen were measured by 1 operator (C.L.S. for the color study and H.S. for the brand study) with a generic digital caliper accurate to 0.02 mm ( Fig 1 ). Different calipers were used for the color and the brand studies; for the former, a hand-held magnifying glass was also used to assist with measuring the length and the inside diameter. The 3 middle links were each measured 3 times, and average values were calculated.
To test the measurement reliability for the color study, a set of 20 untested specimens (2 of each color) was measured twice by the same operator (C.L.S.) 1 week apart. To test the measurement reliability for the brand study, a set of 18 untested specimens (2 of each brand and color) was measured twice by the same operator (H.S.) 1 week apart. Intraclass correlations and their 95% CI values were calculated for each of the 4 measured dimensions.
Load-displacement behavior of all specimen types was investigated between 0 and 4.5 mm of displacement. For DMA testing to be reproducible, specimens should be tested within the elastic load-displacement range. From the results for orthodontic elastomeric modules obtained by Kovatch et al, the tensile load-displacement curves when the modules are loaded to failure have the distinctive S-shaped appearance characteristic of rubber elasticity. In our study, when the 5-link specimens were subjected only to small displacements, there was minimal deviation in linearity in any of the 0-mm to 4.5-mm load-displacement curves.
To perform a DMA test, a sinusoidal load is applied to a specimen at a defined amplitude and frequency, and the response is measured. Purely elastic materials produce a load responding immediately to an applied displacement, whereas viscoelastic materials do not. All DMA tests in this study were performed under displacement control between 3.0 and 4.0 mm. The following 8 frequencies were defined for the DMA tests: 0.125, 0.25, 0.5, 1.0, 2.0, 4.0, 8.0, and 16.0 Hz. These frequencies were chosen to represent more than 2 full logarithmic decades that include the range of human chewing frequencies. To minimize the observed effects of cyclic softening on the DMA test results, each specimen was cycled 20 times immediately before DMA testing. These “stabilization” cycles were performed between 0.5 and 4.0 mm at 1 Hz.
The chosen test frequencies were not intended to simulate chewing frequencies, since elastomeric chains experience force decay when stretched and held statically in clinical situations. Rather, DMA testing is inherently dynamic and must be performed at some prescribed frequency. Reporting DMA results over a wide frequency range is meant to demonstrate that viscoelastic properties of elastomeric chains are frequency dependent.
The DMA tests were controlled by the WinTest software (version 4.0; Bose). Sinusoidal loading between 3.0 and 4.0 mm was applied at each of the 8 defined frequencies in immediate succession from lowest to highest. The software determined the optimal data acquisition rate needed to perform DMA calculations by using Fourier transforms. Based on raw data recorded for each DMA test, the software created a summary of the calculated DMA parameters for each frequency. All data were plotted and reviewed for errors.
The DMA calculations of the WinTest software were based on ASTM standard D 5992-96 and SAE standard J1085. The test specimens had a nonstandard geometry, so DMA calculations for this study were structural, representing stiffness rather than modulus values. The DMA parameters calculated for this study, along with their dimensions and relationships to one another, are defined below. These variables describe viscoelastic behavior rather than force decay, and tan δ is dimensionless.
K ∗ = ( measured load amplitude ) / ( applied displacement amplitude ) = dynamic stiffness ( N / mm ) .
δ = angle between applied displacement and measured load = phase angle ( ° ) .
K ′ = K ∗ ( cos δ ) = elastic component of dynamic stiffness = storage stiffness ( N / mm ) .
K ″ = K ∗ ( sin δ ) = viscous component of dynamic stiffness = loss stiffness ( N / mm ) .
Stay updated, free dental videos. Join our Telegram channel
VIDEdental - Online dental courses


