Introduction
Digital 3-dimensional models are widely used for orthodontic diagnosis. The aim of this study was to assess the validity, reliability, and reproducibility of digital models obtained from the Lava Chairside Oral scanner (3M ESPE, Seefeld, Germany) and cone-beam computed tomography scans of alginate impressions for tooth-width measurements and the Bolton analysis.
Methods
A digital model, an intraoral scan, and a plaster model were made for each of 22 subjects. Tooth-width measurements on the digital model and the intraoral scan were compared with those on the corresponding plaster models (gold standard). Intraclass correlation coefficients were calculated to determine the interexaminer reliability of the measurements of each method. The anterior and overall Bolton ratios were calculated for each participant and for each method. The paired t test was used to determine the validity. The scanning time for the intraoral scanner was registered and analyzed.
Results
Tooth-width measurements of each tooth on the digital models and the intraoral scans did not differ significantly from those on the plaster models ( P >0.05). The overall and anterior Bolton ratios from the 2 types of digital models differed significantly from the gold standard ( P <0.05). However, the differences never exceeded 1.5 mm; this could be regarded as clinically insignificant. The scanning times of the intraoral scanner decreased significantly with the number of scans performed.
Conclusions
Both intraoral scanning and cone-beam computed tomography scanning of alginate impressions are valid, reliable, and reproducible methods to obtain dental measurements for diagnostic purposes.
Nowadays, digitalization of dental study models is an advancing development in orthodontics. Replacement of plaster models with these new virtual counterparts can benefit orthodontics in a number of ways: improved efficiency, instant retrieval of digital information of patient records, and immediate information exchange for consultation and referral; cost savings with no need for storage of plaster models and no risk of damage or loss of plaster models; time savings with ease of digital measurement; and improved production with the possibility to perform digital setups. The integration of digital 3-dimensional (3D) models with existing 3D imaging technologies such as cone-beam computed tomography (CBCT) and 3D photography has already been described in the literature. It is only a matter of time before there will be a true 3D reconstruction of the patient’s craniofacial complex for orthodontic diagnosis, treatment planning, progress, and outcome assessment. Moreover, digital 3D models can be printed with a rapid prototyping technology if a physical model of the dentition is needed: eg, for the manufacture of orthodontic appliances.
There are currently 3 methods to produce digital 3D models: (1) laser scanning of plaster models and alginate impressions, (2) CBCT scans and CBCT scanning of alginate impressions or plaster models, and (3) direct intraoral scanning of the dentition. Although plaster models have a few drawbacks, their accuracy for dental measurements, often directly made with rulers or calipers, is still regarded as the gold standard for orthodontic diagnosis and research.
After the first digital 3D models were introduced in orthodontics, much research on the validity of laser surface scanning of plaster models generated from alginate or vinylpolysiloxane impressions has been performed. No significant differences were found in the assessments of linear interarch, overjet, overbite, and arch-length measurements obtained from these digital 3D models and their corresponding plaster models. It also appeared that these digital 3D models are suitable for evaluation of the peer assessment rating score and the American Board of Orthodontics score. Importantly, diagnosis and treatment decisions are not different whether digital or plaster models are used.
Digital models can be subtracted from CBCT scans. Unfortunately, these models are not detailed enough and lack accuracy because of the low radiation dose and scattering, although they appear to be as accurate as digital models obtained by laser scanning of plaster models for linear measurements for overjet, overbite, and crowding. For obtaining digital 3D models from CBCT scanning of alginate impressions or plaster models, OrthoProof (Nieuwegein, The Netherlands) is currently the main provider. It uses a high-resolution CBCT (960 × 768 pixels) to digitize alginate impressions, with the advantages that the scan is made directly on the impressions and no plaster models need to be made. However, when making a traditional alginate impression, there is a risk of dimensional deformation, caused by moisture absorption or moisture loss from the impression material. Additionally, permanent deformation of the impression material can occur when there are deep undercuts; this is the case with orthodontic brackets on the teeth. To overcome these disadvantages and eliminate the process of digitizing the alginate impressions and plaster models, direct digitization of the dentition would be preferred. This has been made possible with direct intraoral scanners such as the Lava Chairside Oral Scanner (3M ESPE, Seefeld, Germany). To date, only a few studies have investigated the validity of CBCT scanning of alginate impressions, of which only 1 is a clinical study. Their results show that the CBCT technique is accurate enough for intra-arch linear measurements and the index of complexity, outcome, and need score. However, the validity of the intraoral scanning method has not yet been studied.
The aim of this study was to assess the validity, reliability, and reproducibility of using digital models obtained from the intraoral Lava scanner and from CBCT scans of alginate impressions by OrthoProof for tooth-width measurements and the Bolton analysis. As with any new method, the validity was judged by comparison with the current gold standard: manual measurements on plaster models. In addition and for the first time, the scanning time of the Lava scanner was registered and analyzed.
Material and methods
The experimental group consisted of 22 volunteers, employees of the Department of Orthodontics and students of the Department of Dentistry of the University of Groningen in The Netherlands. All participants gave their informed consent. The study was performed according to the rules of the ethics committee. All volunteers fulfilled the following criteria: (1) complete permanent dentition from first molar to first molar in both arches, (2) no fixed orthodontic appliances, and (3) no severe crowding in the dentition (<6 mm).
Two sets of alginate impressions of each participant were taken; the first set was poured on the same day to obtain the conventional plaster model, and the second set was sent on the same day to OrthoProof, where it was digitized and converted into a DigiModel within 2 to 3 days ( Fig 1 ). The alginate used for the plaster models was Hydrogum 5 (Zhermack, Polesine Badia, Italy), known as a dimensionally stable alginate. The plaster material used was Fuji Rock EP (GC, Leuven, Belgium). The alginate used for the DigiModels was Blueprint (Dentsply, Konstanz, Germany) as recommended by OrthoProof.
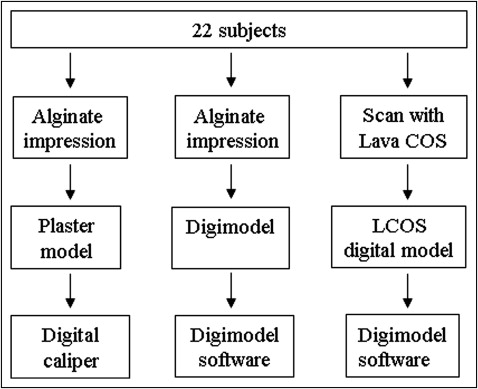
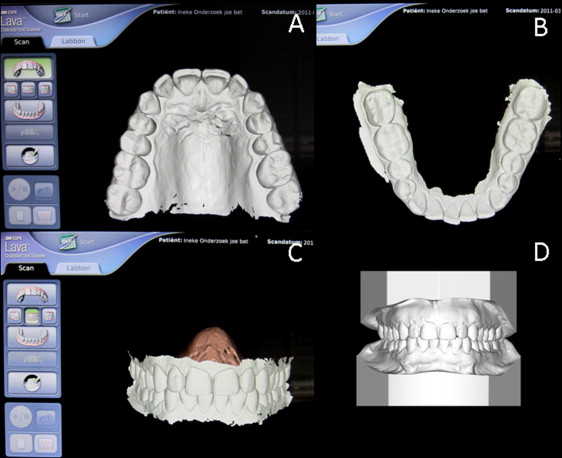
All intraoral scans with the Lava scanner were performed by the same operator (W.P.E.). This 3D-in-motion technology captures 3D data in a video sequence and models the data in real time. Other traditional point-and-click technologies rely on the warping of a laser or light pattern on an object to determine the 3D data. Unlike video imaging, point and click uses individual “snapshots” to assemble a model. The operator was trained and calibrated for the use of the Lava scanner. For making an intraoral scan, the tooth surfaces were first dried and coated with a thin layer of titanium oxide powder; the process of powder coating the dentition takes 1 minute. The maxillary and mandibular dentitions were scanned separately, and then a scan of the teeth in occlusion was made ( Fig 2 ). For each participant, the intraoral scans and the alginate impressions were made successively during the same session. A total of 22 sets of study models were available for digital and manual measurements ( Fig 1 ).
Tooth widths on the plaster models were measured with a digital caliper (FINO, Bad Bocklet, Germany). Tooth widths on the DigiModels and the Lava models were virtually measured on a computer with DigiModel software (version 2.3.7; OrthoProof) ( Fig 1 ). All measurements were done on the same computer and computer screen. Tooth width is defined as the maximum mesiodistal distance between the anatomic contact points when the teeth are aligned. The measurements were made parallel to the occlusal and labial or buccal surfaces of the individual teeth. All mesiodistal widths were measured to the nearest 0.01 mm. Three examiners (M.G.W., W.P.E., and H.E.T.N.) worked independently and measured tooth widths once for all 3 methods. Of the 2 sets of digital models, the examiners were not informed about the scanning method.
The anterior and overall Bolton ratios were calculated for each set of models. Measurements made on the plaster models were considered the gold standard. The differences in tooth-width measurements, anterior Bolton ratio, and overall Bolton ratio between the digital models (DigiModels and Lava models) and the corresponding plaster models were calculated to assess the error of the method and to evaluate the validity.
To give an indication of the learning curve of using the Lava scanner, the times needed to scan the dentition of all participants, once the cotton rolls were placed and the teeth were powdered, were registered in minutes. The operator had been trained and calibrated for the use of the Lava scanner but was inexperienced in terms of the number of scans performed (<10) before the start of this study.
Statistical analysis
All measurements were recorded in an Excel spreadsheet (version 2009; Microsoft, Redmond, Wash), and the data were analyzed by using statistical software (version 16.0; SPSS, Chicago, Ill). Intraclass correlation coefficients (ICCs) were calculated to determine the interexaminer reliability of the measurements of each method. After determining the interexaminer reliability, the tooth widths of the same teeth, measured by the 3 examiners, were pooled, and the means were calculated. Measurements from each tooth from the plaster model were compared with those from the Lava model and the DigiModel. The anterior and overall Bolton ratios were calculated for each participant and for each method. The paired t test was used to determine the validity. P <0.05 was considered significant.
Results
The ICC values of the tooth-width measurements among the 3 examiners of each method are shown in Table I . The data demonstrate that the sets of measurements made by the 3 independent examiners on the plaster models, DigiModels, and Lava models were highly correlated (all ICC values exceeded 0.90). This allowed the sets of measurements from the 3 examiners to be pooled.
| Plaster model | DigiModel | Lava model | |||
|---|---|---|---|---|---|
| ICC | 95% CI | ICC | 95% CI | ICC | 95% CI |
| 0.99 | 0.989-0.992 | 0.995 | 0.994-0.996 | 0.993 | 0.992-0.994 |
Table II shows the differences between the manual and digital measurements of each tooth. The differences from the measurements on the plaster models ranged from −0.04 to 0.16 mm for the DigiModels and from −0.24 to 0.07 mm for the Lava models. No measurement on the Lava models was significantly different from those on the plaster models. Of the measurements on the DigiModels, a few showed significant differences ( P <0.05). However, no difference exceeded 0.2 mm.
| Tooth | Plaster model | DigiModel | Lava model | |||||
|---|---|---|---|---|---|---|---|---|
| Mean | SD | Mean difference from plaster model | 95% CI of the mean difference | Mean difference from plaster model | 95% CI of the mean difference | |||
| Max R central incisor | 8.47 | 0.55 | ∗ 0.07 | 0.02 | 0.12 | −0.24 | −0.5 | 0.02 |
| Max R lateral incisor | 6.61 | 0.41 | ∗ 0.16 | 0.08 | 0.24 | 0.07 | −0.27 | 0.42 |
| Max R canine | 7.69 | 0.53 | 0.01 | −0.05 | 0.07 | −0.07 | −0.43 | 0.3 |
| Max R first premolar | 6.9 | 0.42 | 0 | −0.07 | 0.07 | −0.15 | −0.38 | 0.09 |
| Max R second premolar | 6.66 | 0.48 | ∗ 0.08 | 0.01 | 0.14 | −0.2 | −0.45 | 0.04 |
| Max R first molar | 10.31 | 0.53 | 0 | −0.09 | 0.09 | −0.08 | −0.45 | 0.29 |
| Max L central incisor | 8.45 | 0.54 | 0.07 | −0.01 | 0.14 | −0.21 | −0.52 | 0.1 |
| Max L lateral incisor | 6.69 | 0.54 | ∗ 0.09 | 0.02 | 0.17 | −0.11 | −0.52 | 0.31 |
| Max L canine | 7.68 | 0.46 | −0.04 | −0.1 | 0.01 | −0.12 | −0.43 | 0.2 |
| Max L first premolar | 6.91 | 0.45 | 0.03 | −0.05 | 0.1 | −0.1 | −0.34 | 0.15 |
| Max L second premolar | 6.67 | 0.48 | ∗ 0.10 | 0.04 | 0.16 | −0.05 | −0.33 | 0.24 |
| Max L first molar | 10.25 | 0.57 | 0.04 | −0.05 | 0.13 | −0.19 | −0.56 | 0.18 |
| Mand L central incisor | 5.27 | 0.27 | −0.02 | −0.09 | 0.04 | −0.01 | −0.18 | 0.16 |
| Mand L lateral incisor | 5.8 | 0.34 | −0.02 | −0.08 | 0.03 | −0.14 | −0.34 | 0.07 |
| Mand L canine | 6.59 | 0.45 | −0.04 | −0.1 | 0.02 | −0.11 | −0.37 | 0.15 |
| Mand L first premolar | 7.05 | 0.35 | −0.03 | −0.09 | 0.03 | −0.14 | −0.38 | 0.1 |
| Mand L second premolar | 7.1 | 0.47 | −0.01 | −0.08 | 0.06 | −0.21 | −0.45 | 0.03 |
| Mand L first molar | 10.89 | 0.42 | 0 | −0.07 | 0.08 | −0.15 | −0.49 | 0.18 |
| Mand R central incisor | 5.23 | 0.31 | 0 | −0.07 | 0.07 | −0.02 | −0.24 | 0.2 |
| Mand R lateral incisor | 5.77 | 0.33 | −0.04 | −0.08 | 0.01 | −0.12 | −0.31 | 0.06 |
| Mand R canine | 6.6 | 0.43 | −0.04 | −0.11 | 0.02 | −0.02 | −0.29 | 0.25 |
| Mand R first premolar | 6.96 | 0.38 | 0 | −0.08 | 0.07 | −0.17 | −0.39 | 0.04 |
| Mand R second premolar | 7.07 | 0.47 | 0.03 | −0.04 | 0.1 | −0.21 | −0.49 | 0.07 |
| Mand R first molar | 10.84 | 0.42 | −0.03 | −0.1 | 0.05 | −0.2 | −0.56 | 0.16 |
The anterior and overall Bolton ratios of the different methods are shown in Tables III and IV. The means, standard deviations, and 95% confidence intervals of the differences in Tables III and IV are the mean differences in the anterior and overall Bolton ratios of all 22 participants between the plaster and the digital models (DigiModels and Lava models). The anterior and overall Bolton ratios of both the DigiModels and the Lava models were smaller than those of the plaster models; this difference was significant ( P <0.05). When the values were calculated, the differences between the DigiModels and the plaster models were 0.44 ± 0.44 mm for the anterior Bolton ratio (95% CI, 0.25-0.64 mm) and 0.75 ± 0.74 mm for the overall Bolton ratio (95% CI, 0.43-1.08 mm), and the differences between the Lava and the plaster models were 0.40 ± 0.55 mm (95% CI, 0.15-0.64 mm) for the anterior Bolton ratio and 1.03 ± 0.84 mm for the overall Bolton ratio (95% CI, 0.66-1.40 mm).
| Participant | Plaster model | DigiModel | Difference between DigiModel and plaster model | Lava | Difference between Lava and plaster model |
|---|---|---|---|---|---|
| 1 | 80.53 | 80.71 | 0.18 | 80.61 | 0.09 |
| 2 | 80.47 | 79.58 | −0.89 | 80.8 | 0.33 |
| 3 | 78.53 | 77.01 | −1.52 | 75.86 | −2.67 |
| 4 | 78.61 | 77.58 | −1.03 | 77.72 | −0.88 |
| 5 | 77.69 | 74.83 | −2.87 | 76.77 | −0.92 |
| 6 | 78.42 | 78.86 | 0.44 | 76.24 | −2.18 |
| 7 | 77.73 | 78.53 | 0.81 | 79.55 | 1.82 |
| 8 | 79.92 | 80.01 | 0.09 | 79.66 | −0.26 |
| 9 | 73.36 | 72.14 | −1.22 | 74.35 | 0.99 |
| 10 | 78.3 | 78.31 | 0 | 77.52 | −0.78 |
| 11 | 72.99 | 71.68 | −1.31 | 71.81 | −1.18 |
| 12 | 77.2 | 76.02 | −1.19 | 76.49 | −0.71 |
| 13 | 76.43 | 75.29 | −1.14 | 76.79 | 0.36 |
| 14 | 77.93 | 77.47 | −0.46 | 75.68 | −2.25 |
| 15 | 75.81 | 74.59 | −1.22 | 74.61 | −1.2 |
| 16 | 78.28 | 75.68 | −2.6 | 77.2 | −1.08 |
| 17 | 75.38 | 74.76 | −0.62 | 73.57 | −1.81 |
| 18 | 80.29 | 77.12 | −3.18 | 79.21 | −1.08 |
| 19 | 75.3 | 74.49 | −0.81 | 75.25 | −0.05 |
| 20 | 72.27 | 70.79 | −1.48 | 69.64 | −2.63 |
| 21 | 82.99 | 81.7 | −1.29 | 81.01 | −1.98 |
| 22 | 75.04 | 74.82 | −0.22 | 74.18 | −0.87 |
| Mean ± SD | 77.43 ± 2.68 | 76.45 ± 2.89 | ∗ −0.98 ± 1.01 | 76.57 ± 2.92 | ∗ −0.86 ± 1.15 |
| 95% CI of the difference | ∗ −1.43 to −0.53 | ∗ −1.37 to −0.35 | |||
| Mean ± SD in mm | 0.44 ± 0.44 | 0.40 ± 0.55 | |||
| 95% CI of the difference in mm | 0.25-0.64 | 0.15-0.64 |
Stay updated, free dental videos. Join our Telegram channel
VIDEdental - Online dental courses


