Introduction
The demand for tooth whitening has grown almost exponentially in the last 20 years, but there are no published reports regarding how bleaching is used in contemporary orthodontic practices in the United States.
Methods
A weighted sample of American Association of Orthodontists members (3601) was surveyed via electronic and paper questionnaires to quantitatively, by logistic regression, and qualitatively assess orthodontists’ current practices regarding tooth-whitening procedures.
Results
Of the surveys, 1222 were completed, and 1182 surveys were eligible for analysis. Nationwide, 88.8% of orthodontists had patients who requested tooth whitening, and 76.2% of orthodontists had recently recommended whitening procedures for some patients, typically less than 25% of their total patient population. Approximately a third (32.8%) of orthodontists provided whitening, and nearly two thirds (65.8%) referred whitening procedures to other dental professionals. The geographic region of the country had a statistically significant effect on the proportion of orthodontists who received whitening requests ( P = 0.004), recommended whitening procedures ( P <0.0006), and provided whitening services in their specialty practices ( P <0.0001).
Conclusions
Almost all orthodontists encounter patients who request whitening procedures, and most recommend whitening procedures for a small percentage of their patients. The proportion of orthodontists who refer such procedures to other providers is nearly double the proportion that provides them.
Tooth whitening changed dramatically in the late 1980s when the first commercial tooth whitening agent became available and the nightguard vital bleaching technique was first described in the literature. Fueled by direct consumer marketing and the media’s role in reporting scientific advances, the focus of tooth whitening shifted from the bleaching of individually discolored nonvital teeth or tetracycline-stained teeth to a general desire for a whiter smile for an esthetically conscious public. The demand for tooth whitening has grown almost exponentially in the last 20 years, and tooth-whitening products are now a popular oral care product category. Today, whiter teeth might even be culturally important, because research has shown that a person’s dental appearance can influence how he or she is perceived by others.
Whitening procedures could be indicated for orthodontic patients for a number of reasons. Most children think that their teeth are too yellow, and children are more critical of their tooth color than their own parents and dentists. Younger patients also express a greater preference for white teeth than do older patients, although adults still identify tooth color and poor tooth alignment as the primary factors that influence their satisfaction with their dental esthetics. In view of these findings, it has been suggested that issues of both color aberrations and tooth positioning should be discussed before orthodontic treatment.
Tooth whitening also has been recommended to reduce the appearance of a common complication of orthodontic treatment—white spot lesions. After allowing time for the lesions to remineralize naturally, bleaching is recommended to reduce the contrast between the white spot lesion and adjacent enamel, a conservative approach before microabrasion or restorative treatments are considered. This camouflage technique has been shown to be effective by colorimetry and patients’ evaluations of the outcome. Furthermore, authors of a randomized clinical trial found that patients reported greater satisfaction with their orthodontic outcome when it was followed by cosmetic whitening, irrespective of whether an in-office or an at-home technique was used.
Perhaps the most overlooked application of whitening agents in orthodontics is their ability to maintain or improve oral health during active treatment. As early as 1978, gingival benefits were demonstrated in orthodontic patients by the incorporation of carbamide peroxide into their daily oral hygiene regimen. Research also has shown that the urea component of carbamide peroxide causes a rise in the salivary and plaque pH levels of the mouth, overcoming the intrinsically acidic nature of some bleaching agents. This buffering capacity of urea elevates plaque and salivary pH levels far above the critical pH at which enamel and dentin begin to dissolve, resulting in a potentially cariostatic benefit of carbamide peroxide whitening agents. The use of carbamide peroxide-based whitening products and procedures during active orthodontic treatment could both improve gingival health and reduce caries susceptibility, although the clinical research to confirm this theory is still lacking.
Currently, no data have reported how whitening products and procedures are used by orthodontists in the United States. The purpose of this study was to conduct a nationwide survey of private-practice members of the American Association of Orthodontists (AAO) to assess their current practices regarding tooth whitening.
Material and methods
To develop the survey, the data collection instrument was designed specifically for this project. The instrument was pilot tested by 8 private practice orthodontists who teach part time in the Department of Orthodontics at the University of North Carolina at Chapel Hill. Their comments regarding clarity, content, and length were used to develop the final national survey.
The final questionnaire consisted of closed-ended items on practitioner demographics and frequency categories of current practice behaviors regarding patient requests for whitening procedures and provider recommendation, provision, and referral of whitening procedures. If whitening procedures were recommended, provided, or referred, the survey asked which types of procedures were used.
The project was approved by the University of North Carolina at Chapel Hill’s Biomedical Institutional Review Board and the AAO Survey Review Committee.
The sampling frame consisted of the 9160 active AAO members in the United States obtained directly from the AAO in October 2010. The sampling frame was organized by the 9 geographic regions used in the Journal of Clinical Orthodontics practice surveys. Because the numbers of orthodontists varied among the regions, a weighted random sample was drawn from each region, yielding a total sample of 3601 ( Table I ). The sampling procedures were designed to obtain information for a representative sample of orthodontists.
| Sampling frame (initial) | Sampled | Response rate | Sampling weight | |
|---|---|---|---|---|
| New England: Conn, Me, Mass, NH, RI, Vt |
574 | 319 | 28.5% | 0.82 |
| Middle Atlantic: NJ, NY, Pa |
1361 | 471 | 28.9% | 1.30 |
| South Atlantic: Del, DC, Fla, Ga, Md, NC, SC, Va, WVa |
1600 | 497 | 36.8% | 1.13 |
| East South Central: Ala, Ky, Miss, Tenn |
459 | 280 | 36.8% | 0.58 |
| East North Central: Ill, Ind, Mich, Ohio, Wis |
1252 | 457 | 38.1% | 0.94 |
| West North Central: Iowa, Kan, Minn, Mo, Neb, ND, SD |
528 | 305 | 34.8% | 0.64 |
| Mountain: Ariz, Colo, Idaho, Mont, Nev, NM, Utah, Wyo |
718 | 360 | 28.6% | 0.91 |
| West South Central: Ark, La, Okla, Tex |
945 | 409 | 32.5% | 0.92 |
| Pacific: Alaska, Calif, Hawaii, Ore, Wash |
1663 | 503 | 30.4% | 1.43 |
E-mail addresses for the potential respondents were located by using the AAO online and printed member directories. For those with an e-mail address, a message was sent describing the project, explaining the rights of research participants, and asking them to complete an online survey (Qualtrics Labs, Provo, Utah). Reminder e-mails were sent 1 and 2 weeks after the initial contact for a total of 3 electronic contacts. After closing the electronic version of the survey, a paper questionnaire (Cardiff TeleForm, Vista, Calif) was mailed to all nonrespondents and members who did not have an e-mail address initially available. The mailing included a postage-paid envelope and a cover letter. To maintain confidentiality, all electronic and paper surveys were numerically coded, and participants were asked not to include any personal information on the survey. To prevent duplicate mailings, a linkage file was maintained by the primary investigator (M.E.S.) and destroyed at the end of the study. Respondents were excluded if they refused to complete the survey, the survey was illegible, or the respondent was not currently working in a private orthodontic specialty practice.
Data from the electronic surveys were downloaded from the Qualtrics online account and merged with the paper survey responses after the Teleform questionnaires were scanned and entered into a database (Access 2010; Microsoft, Redmond, Wash). The primary outcomes (receipt of whitening requests from patients, active engagement in recommending whitening procedures, active engagement in providing whitening procedures, and active engagement in referring whitening procedures) were analyzed separately by logistic regression. The time frame for responses to all questions was “within the past 6 months.” The geographic region of the country and the community size of the orthodontic practice were considered the primary explanatory variables. The South Atlantic region and rural community size were used as reference cells reflecting the state in which University of North Carolina is located. The estimates from each logistic regression (Proc Surveyfreq and Proc Surveylogistic, version 9.2; SAS, Cary, NC) were adjusted for the unequal probabilities of selection and nonresponse, and a finite population correction was used, because of the high sampling rate, when variance estimates were determined ( Table I ). The level of significance was set at 0.05.
Results
Data collection began on June 7, 2011, and ended on December 2, 2011. Four hundred forty-five electronic surveys were completed, and 777 paper surveys were returned, for a total of 1222 surveys. Thus, the overall national response rate was 33.9% (1222 returned of 3601 in the sampling frame). Of the returned surveys, 41 did not meet the inclusion criteria and were excluded before analysis, leaving 1182 eligible respondents for analysis.
Respondents to the survey represented all geographic regions of the United States. The response rates were similar for the geographic regions, although the East North Central region had the highest response rate (38.1%), and the New England (28.5%), Mountain (28.6%), and Middle Atlantic (28.9%) regions had the lowest rates. Most respondents practiced full time (average, 31.7 hours per week) and were quite experienced (average, 20.7 years postgraduation). Mountain region respondents completed their training most recently (average, 13.5 years postgraduation), and New England respondents had the most years of experience (average, 22.0 years postgraduation). Communities of all sizes in the United States were represented ( Table II ).
| Mean | 95% CI | |
|---|---|---|
| Years in practice | 20.7 | 19.8-21.5 |
| Hours/week in practice | 31.7 | 31.3-32.0 |
| Community size (%) | ||
| Rural | 9.7 | 8.1-11.3 |
| Small city | 31.4 | 28.9-34.0 |
| Large city | 34.5 | 31.9-37.2 |
| Metropolitan | 24.3 | 21.9-26.7 |
| Orthodontists (%) | ||
| Whitening procedures requested | 88.8 | 87.0-90.6 |
| Whitening procedures recommended | 76.2 | 73.9-78.6 |
| Whitening procedures provided | 32.8 | 30.2-35.4 |
| Whitening procedures referred out | 65.8 | 63.2-68.5 |
| Minimum age recommendation (y) | 14.9 | 14.7-15.1 |
| Minimum age provision (y) | 14.6 | 14.4-14.9 |
Nationwide, 88.8% of the orthodontists reported that patients had requested whitening procedures within the last 6 months ( Table II ). Of these orthodontists, nearly 78% reported that fewer than 25% of their patients requested whitening.
Geographic region of the country ( P = 0.004) had a statistically significant effect on the proportion of orthodontists who had patients requesting whitening procedures, whereas community size ( P = 0.40) did not. The region with the highest percentage of orthodontists whose patients made whitening requests was the East South Central, (95.2%), and the West North Central region had the lowest (82.1%).
Relative to North Carolina and other states in the South Atlantic region, orthodontists in the East South Central, East North Central, Mountain, and West South Central regions were more likely to receive whitening requests, and orthodontists in the New England, Middle Atlantic, West North Central, and Pacific regions were less likely to receive whitening requests ( Table III ).
| Odds ratio for patient request | Odds ratio for recommendations | Odds ratio for provision | |
|---|---|---|---|
| New England: Conn, Me, Mass, NH, RI, Vt |
0.75 | 0.65 | 0.54 |
| Middle Atlantic: NJ, NY, Pa |
0.80 | 0.76 | 0.60 |
| South Atlantic: Del, DC, Fla, Ga, Md, NC, SC, Va, WVa |
Reference | Reference | Reference |
| East South Central: Ala, Ky, Miss, Tenn |
2.12 | 0.88 | 0.86 |
| East North Central: Ill, Ind, Mich, Ohio, Wis |
1.21 | 0.59 | 0.77 |
| West North Central: Iowa, Kan, Minn, Mo, Neb, ND, SD |
0.48 | 0.40 | 0.48 |
| Mountain: Ariz, Colo, Idaho, Mont, Nev, NM, Utah, Wyo |
1.03 | 1.20 | 2.37 |
| West South Central: Ark, La, Okla, Tex |
1.67 | 1.05 | 1.31 |
| Pacific: Alaska, Calif, Hawaii, Ore, Wash |
0.55 | 0.49 | 1.14 |
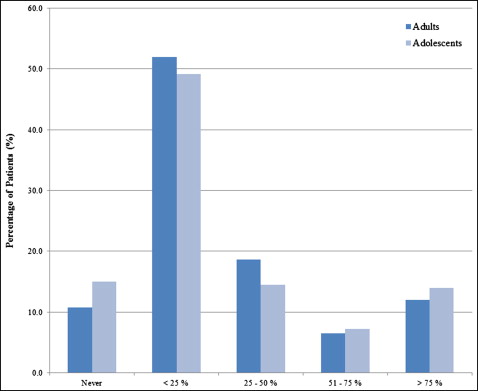
Approximately three fourths of orthodontists nationwide (76.2%) had recommended whitening procedures for some patients within the last 6 months ( Table II ). Most orthodontists who recommended whitening procedures did so for less than 25% of their patients; however, small percentages (12% for adults, 14% for adolescents) recommended over-the-counter whitening products for more than 75% of their patients ( Fig 1 ).
Stay updated, free dental videos. Join our Telegram channel
VIDEdental - Online dental courses


