Introduction
The aim of this study was to evaluate the deglutitive tongue movements in patients with skeletal Class II malocclusion.
Methods
Fifty-nine patients (26 male, 33 female) with skeletal Class II relationship were divided into 3 groups according to cephalometric analysis. Group 1 (n = 19) had mandibular retrognathism, group 2 (n = 20) had maxillary prognathism, and group 3 (n = 20) had both mandibular retrognathism and maxillary prognathism. Twenty-two skeletal Class I patients (10 male, 12 female) were also included as the controls.
Results
In the mandibular retrusion group, the posterior portion of the dorsal tongue moved downward at stage 2 and upward at stage 3; the root of the dorsal tongue was in an inferior and anterior position at stage 2. In patients with both mandibular retrognathism and maxillary prognathism, the middle portion of the dorsal tongue was positioned superiorly at stage 3 relative to stage 1; the tongue tip was retruded at stage 3 relative to stages 1 and 2. In the control group, the middle portion of dorsal tongue was positioned superiorly at stage 3 relative to stages 1 and 2; the posterior portion of the tongue moved upward at stage 2 and downward at stage 3, and tongue-tip retrusion was observed at stage 2 relative to stage 1. Contact of the anterior portion of the tongue with the rugae area of the hard palate decreased in the Class II malocclusion groups relative to the control group. The middle portion of the dorsal tongue was positioned more superiorly in patients with Class II malocclusion during all stages of deglutition. The root of the tongue was more inferior and anterior, and the tongue tip was retruded in patients with Class II malocclusion compared with the control group. The posterior portion of the dorsal tongue was more inferiorly positioned in patients with mandibular retrusion than in the other Class II groups or the controls. In the third stage of deglutition, this portion of the tongue had a superior position in groups 2 and 3 relative to the control group.
Conclusions
Dentofacial morphology affects the position and movements of the tongue during deglutition, and adaptive changes occur in the tip, dorsum, and root of the tongue. Deglutitive tongue movements in patients with a skeletal Class II relationship are different from those with a skeletal Class I relationship.
The development of an occlusion is the result of the interactions among the genetically developmental factors and a number of environmental factors, including the orofacial functions. The environment of the teeth and alveolar bone includes conflicting forces and pressures, especially from muscular functions, which in part determine tooth positions.
The tongue is an organ that occupies a large portion of the oral cavity and performs complex movements during mastication, deglutition, and speech. It also plays important roles in the transport of bolus from the anterior oral cavity to the pharynx. There is debate over the role of the tongue in the development and morphology of the dental arches and dentofacial forms. Many investigators have tried to find the relationship between size, posture, and function of the tongue with the surrounding oral cavity and dentofacial morphology. The frequency of swallowing, the magnitude of the force exerted on the teeth, the counteraction of these forces by other muscular structures such as lips, the resistance of dentoalveolar structures to displacement, and the resting posture of the tongue when no swallowing is occurring are the important factors that might affect the relationship between tongue function and dentofacial form. Melsen et al, who evaluated the relationship between swallowing pattern and different malocclusion traits, reported that malocclusion frequency was higher among children swallowing without tooth contact, and the malocclusion traits most affected by the swallowing pattern were the sagittal discrepancies. They suggested 2 swallowing patterns and reported that a high position of the tongue favored spacing in the maxilla and increased overjet, whereas low tongue position favored spacing in the mandible and decreased overjet, creating a Class III tendency.
In recent years, it has been suggested that there are correlations between deglutitive (swallowing) tongue movements and certain features of maxillofacial morphology. Ichiada et al, who evaluated the relationship between the lingual-palatal contact duration associated with swallowing and maxillofacial morphology, reported that the patients with prolonged contact had tendencies for inclination of the maxillary incisors toward the lip, opening of the mandibular and occlusal planes, and posterior rotation of the mandible. Cheng et al also showed significant correlations between the tongue movements during swallowing and dentofacial morphology. They reported that the movements of the tongue during swallowing are related to dentofacial morphology, especially in the motion magnitude of the early final phase. Fujiki et al showed that patients with open bite had tongue-tip protrusion, slower movement of the rear part of the dorsal tongue, and earlier closure of the nasopharynx during deglutition. In their subsequent study, they found significant correlations between mandibular plane angle, ramus height, or anteroposterior dimension of the maxilla and movement of the front part of the dorsal tongue during deglutition in the patients with anterior open bite. Akin et al also reported compensatory tongue functions in patients with anterior open bites. Gorgulu et al, who evaluated the deglutitive tongue movements in patients with skeletal Class III malocclusion, reported a decreased contact of the anterior portion of the tongue with the rugae area of the hard palate in those with Class III malocclusions. They also showed that the posterior portion of the dorsal tongue was positioned more inferiorly, the root of the tongue was positioned more inferiorly and anteriorly, and the tongue tip was also positioned more anteriorly in patients with Class III malocclusions. Differences were also observed in the manner of bolus transfer. Linear motion of the tongue was observed in patients with Class III malocclusion, whereas a fluctuation motion of the tongue occurred in patients with Class I malocclusion.
As mentioned above, there have been many studies to determine the relationship among oral structures, types of malocclusion, and deglutition. These studies showed that the characteristic tongue movements during deglutition were closely related to the morphologic features of the subjects. The purpose of our study was to investigate tongue posture and tongue movements during 3 stages of deglutition in subjects with Class II malocclusion. Cinematic (cine) images of the tongue were obtained by using real-time balanced turbo field echo cine-magnetic resonance imaging (MRI), which was successfully used in our previous studies to observe deglutitive tongue movements. To our knowledge, this technique has not been used before in the evaluation of swallowing patterns of patients with skeletal Class II malocclusion.
Material and methods
This prospective study was carried out after institutional approval from the Ethics Committee of Gulhane Military Medical Academy in Ankara, Turkey.
Eighty-one patients (45 male, 36 female) were included in the study, and informed consents were obtained from all participants. They were divided into 4 groups according to their skeletal relationships. Skeletal classification was made by the evaluation of the sagittal components of the jaws on the cephalometric radiographs, and it was based on the SNA, SNB, and ANB angles, and N vertical-A and N vertical-Pg linear measurements. Nineteen skeletal Class II patients (5 boys, 14 girls; mean age, 14.05 ± 1.87 years) with mandibular retrognathism (ANB, >4°; SNB, <78°; N vertical-Pg, <−6 mm) were included in the first group. In the second group, there were 20 skeletal Class II patients (9 boys, 11 girls; mean age, 14.20 ± 1.39 years) with maxillary prognathism (ANB, >4°; SNA, >84°; N vertical-A, >2 mm). The third group comprised 20 skeletal Class II patients (12 boys, 8 girls; mean age, 14.15 ± 2.05 years) with both mandibular retrognathism and maxillary prognathism (ANB, >4°; SNA, >84°; SNB, <78°; N vertical-A, >2 mm; N vertical-Pg, <−6 mm). Finally, 22 subjects (10 male, 12 female; mean age 18.26 ± 5.22 years) with skeletal Class I relationship (ANB, 2° ± 2°; SNA, 82° ± 2°; SNB, 80° ± 2°; N vertical-A, 0 ± 1 mm; N vertical-Pg, −6 ± 1 mm) composed the control group. The values of the measured cephalometric parameters and the mean ages of the groups are given in Table I .
| Mean age (y) | SNA (°) | SNB (°) | ANB (°) | N vertical-A (mm) | N vertical-Pg (mm) | |||||||
|---|---|---|---|---|---|---|---|---|---|---|---|---|
| Mean | SD | Mean | SD | Mean | SD | Mean | SD | Mean | SD | Mean | SD | |
| Group 1 | 14.05 | 1.87 | 78.42 | 2.54 | 72.21 | 2.55 | 6.21 | 0.41 | −4.18 | 2.46 | −12.10 | 4.62 |
| Group 2 | 14.20 | 1.39 | 86.45 | 1.39 | 79.85 | 1.18 | 6.60 | 0.99 | 4.35 | 1.30 | −5.00 | 1.62 |
| Group 3 | 14.15 | 2.05 | 84.45 | 0.99 | 76.70 | 1.45 | 7.75 | 1.25 | 3.30 | 1.08 | −9.55 | 1.70 |
| All Class II groups | 14.13 | 1.77 | 83.10 | 1.64 | 76.25 | 1.72 | 6.85 | 0.88 | 1.15 | 1.61 | −8.88 | 2.64 |
| Group 4 | 18.26 | 5.22 | 81.27 | 1.01 | 79.36 | 1.12 | 1.91 | 0.83 | 0.10 | 1.30 | −6.73 | 2.05 |
All patients were examined with a 1.5-T super conducting magnetic resonance scanner with a quad H coil and version 9 software (New Intera Nova, Philips Medical Systems, Best, The Netherlands). Real-time balanced turbo field echo images (shortest TR/TE:2.1/1.09 ms) were taken with a 50° flip angle in the midsagittal plane, 10 mm thickness, 350 × 350 mm field of view dimensions, and 96 × 96 matrix width during the patient’s water swallowing. A hundred dynamic scans were captured in 11 seconds.
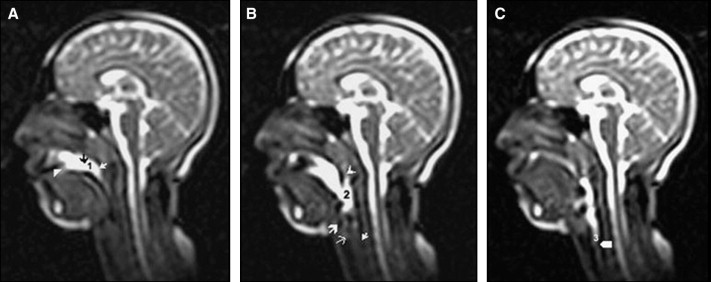
The images were obtained while the subjects were swallowing 10 mL of water that was taken with a syringe just before imaging. For each patient, images matching the following 3 stages were determined by a consensus of 3 specialists and printed out on a radiograph: stage 1 (oral): loss of contact of the dorsal tongue with the soft palate ( Fig 1 , A ); stage 2 (pharyngeal): passage of the bolus head across the posterior or inferior margin of the ramus of the mandible ( Fig 1 , B ); and stage 3 (esophageal): passage of the bolus head through the opening of the esophagus ( Fig 1 , C ).
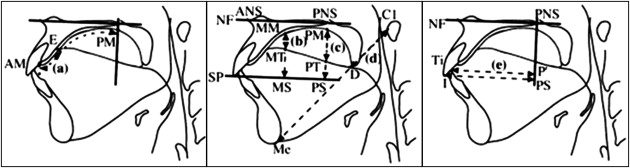
Linear measurements defined by Fujiki et al were made on these radiographs for each stage by 1 author (F.Y.) to prevent interobserver variability. Reference points and planes are shown in Table II . Since AM-E and AM-PM are distances on the palatal mucosa, they were curved lines. A ligature wire was used for the measurement of these parameters. MM-MT, MM-MS, PM-PT, PM-PS, C1-D, C1-Me, and PS-I are straight distances. P′-Ti is the shortest distance from a line crossing at a right angle to the NF plane through PNS to Ti ( Fig 2 ). Magnetic resonance analyses of the groups are presented in Table III .
| ANS | Most anterior point of the maxilla at the level of the palate |
| PNS | Most posterior point on the bony hard palate |
| Me | Lowest point on the symphyseal outline of the chin |
| I | Edge point of the maxillary incisor |
| C1 | Front-most point of the atlas |
| NF | Plane through both ANS and PNS |
| SP | Plane passing the edge of the maxillary incisor and parallel to the palatal plane |
| AM | Boundary point between the maxillary central incisor and the palatal mucosa |
| E | Point nearest the tongue base in the contact region between the tongue and the palatal mucosa |
| MM | Point at which the line crossing at a right angle to NF through the middle point between ANS and PNS intersects the palatal mucosa |
| MT | Point at which the line crossing at a right angle to NF through the middle point between ANS and PNS intersects the dorsum of the tongue |
| MS | Point at which the line crossing at a right angle to NF through the middle point between ANS and PNS intersects SP |
| PM | Point at which the line crossing at a right angle to NF through PNS intersects the palatal mucosa |
| PT | Point at which the line crossing at a right angle to NF through PNS intersects the dorsum of tongue |
| PS | Point at which the line crossing at a right angle to NF through PNS intersects SP |
| D | Point at which the line through Me and C1 intersects the dorsum of the tongue |
| Ti | Tongue tip |
| Group 1 | Group 2 | Group 3 | Group 4 | |||||
|---|---|---|---|---|---|---|---|---|
| Mean (mm/mm) | SD | Mean (mm/mm) | SD | Mean (mm/mm) | SD | Mean (mm/mm) | SD | |
| Stage 1 | ||||||||
| Anterior contact | 0.158 | 0.155 | 0.095 | 0.082 | 0.095 | 0.055 | 0.266 | 0.057 |
| Middle part | 0.365 | 0.188 | 0.301 | 0.169 | 0.358 | 0.147 | 0.607 | 0.157 |
| Posterior part | 0.299 | 0.106 | 0.263 | 0.183 | 0.348 | 0.146 | 0.308 | 0.080 |
| Root of tongue | 0.385 | 0.061 | 0.407 | 0.056 | 0.402 | 0.039 | 0.215 | 0.060 |
| Tip of tongue | 0.708 | 0.139 | 0.775 | 0.127 | 0.675 | 0.207 | 0.945 | 0.120 |
| Stage 2 | ||||||||
| Anterior contact | 0.123 | 0.136 | 0.078 | 0.063 | 0.137 | 0.141 | 0.297 | 0.070 |
| Middle part | 0.337 | 0.153 | 0.222 | 0.106 | 0.323 | 0.184 | 0.663 | 0.153 |
| Posterior part | 0.473 | 0.163 | 0.276 | 0.138 | 0.340 | 0.169 | 0.239 | 0.100 |
| Root of tongue | 0.445 | 0.087 | 0.419 | 0.104 | 0.423 | 0.042 | 0.186 | 0.053 |
| Tip of tongue | 0.780 | 0.142 | 0.753 | 0.197 | 0.755 | 0.094 | 0.850 | 0.125 |
| Stage 3 | ||||||||
| Anterior contact | 0.086 | 0.039 | 0.084 | 0.062 | 0.081 | 0.045 | 0.271 | 0.051 |
| Middle part | 0.275 | 0.092 | 0.227 | 0.140 | 0.225 | 0.073 | 0.403 | 0.219 |
| Posterior part | 0.295 | 0.167 | 0.200 | 0.102 | 0.256 | 0.073 | 0.382 | 0.153 |
| Root of tongue | 0.437 | 0.070 | 0.432 | 0.041 | 0.428 | 0.041 | 0.223 | 0.073 |
| Tip of tongue | 0.773 | 0.077 | 0.773 | 0.068 | 0.799 | 0.093 | 0.904 | 0.147 |
The points and measurements of 25 patients were reevaluated 1 month later, and the method error was determined by using Dahlberg’s formula: method error = √∑d2/2n∑d2/2n−−−−−−−√
∑ d 2 / 2 n
, where n is the number of subjects and d is the difference between the 2 measurements of a pair. The method error did not exceed 0.135 mm. All statistical analyses of the groups were performed with the Statistical Package for Social Sciences for Windows software (version 15, SPSS, Chicago, Ill). The differences between repeated measurements were evaluated by analysis of variance (ANOVA) for repeated measurements. Bonferroni tests were used as post-hoc tests. To analyze the differences within the groups, the paired sample t test was used, and P ≤0.05 was accepted as the level of significant difference. In the comparison of the Class II groups with the control group, the Dunnett test was used.
Results
The stages were compared within the groups. In the mandibular retrusion group (group 1) ( Table IV ), evaluation of the posterior portion of the dorsal tongue (PM-PT/PM-PS) showed a statistically significant increase between stages 1 and 2 ( P <0.01) and a statistically significant decrease between stages 2 and 3 ( P <0.01). These alterations showed that this portion of the tongue moved downward at stage 2 and upward at stage 3. The root of the dorsal tongue (C1-D/C1-Me) showed a significant increase between stages 1 and 2 ( P <0.05) because of the inferior and anterior position of the root of the tongue at stage 2 relative to stage 1.
| Group 1 | Stages | Mean difference (mm/mm) |
SD | P |
|---|---|---|---|---|
| Anterior contact | 1-2 | 0.035 | 0.039 | 1.000 |
| 1-3 | 0.072 | 0.039 | 0.216 | |
| 2-3 | 0.037 | 0.039 | 1.000 | |
| Middle part | 1-2 | 0.028 | 0.049 | 1.000 |
| 1-3 | 0.089 | 0.049 | 0.214 | |
| 2-3 | 0.062 | 0.049 | 0.632 | |
| Posterior part | 1-2 | −0.174 | 0.048 | 0.002 † |
| 1-3 | 0.004 | 0.048 | 1.000 | |
| 2-3 | 0.177 | 0.048 | 0.002 † | |
| Root of tongue | 1-2 | −0.060 | 0.024 | 0.045 ∗ |
| 1-3 | −0.053 | 0.024 | 0.096 | |
| 2-3 | 0.007 | 0.024 | 1.000 | |
| Tip of tongue | 1-2 | −0.071 | 0.040 | 0.242 |
| 1-3 | −0.065 | 0.040 | 0.331 | |
| 2-3 | 0.006 | 0.040 | 1.000 |
Alterations in the contact of the anterior part of the tongue (AM-E/AM-PM) and the movements of the middle portion of the dorsal tongue (MM-MT/MM-MS) and the tongue tip (P′-Ti/P′-I) were statistically insignificant.
In the maxillary protrusion group (group 2) ( Table V ), no parameter showed a statistically significant alteration.
| Group 2 | Stages | Mean difference (mm/mm) | SD | P |
|---|---|---|---|---|
| Anterior contact | 1-2 | 0.017 | 0.022 | 1.000 |
| 1-3 | 0.011 | 0.022 | 1.000 | |
| 2-3 | −0.006 | 0.022 | 1.000 | |
| Middle part | 1-2 | 0.079 | 0.044 | 0.243 |
| 1-3 | 0.074 | 0.044 | 0.311 | |
| 2-3 | −0.005 | 0.044 | 1.000 | |
| Posterior part | 1-2 | −0.014 | 0.046 | 1.000 |
| 1-3 | 0.063 | 0.046 | 0.521 | |
| 2-3 | 0.077 | 0.046 | 0.299 | |
| Root of tongue | 1-2 | −0.012 | 0.023 | 1.000 |
| 1-3 | −0.025 | 0.023 | 0.830 | |
| 2-3 | −0.013 | 0.023 | 1.000 | |
| Tip of tongue | 1-2 | 0.023 | 0.045 | 1.000 |
| 1-3 | 0.002 | 0.045 | 1.000 | |
| 2-3 | −0.021 | 0.045 | 1.000 |
In the mandibular retrognathism and maxillary prognathism group (group 3) ( Table VI ), the distance between the middle portion of the dorsal tongue and the palatal mucosa (MM-MT/MM-MS) was significantly smaller at stage 3 than at stage 1 ( P <0.05), showing that this portion of the tongue was positioned superiorly at stage 3 relative to stage 1. Evaluation of the tongue tip (P′-Ti/P′-I) showed that it was retruded at stage 3 relative to stages 1 and 2 ( P <0.001).
| Group 3 | Stages | Mean difference (mm/mm) |
SD | P |
|---|---|---|---|---|
| Anterior contact | 1-2 | −0.042 | 0.029 | 0.451 |
| 1-3 | 0.014 | 0.029 | 1.000 | |
| 2-3 | 0.056 | 0.029 | 0.171 | |
| Middle part | 1-2 | 0.035 | 0.045 | 1.000 |
| 1-3 | 0.133 | 0.045 | 0.014 ∗ | |
| 2-3 | 0.098 | 0.045 | 0.104 | |
| Posterior part | 1-2 | 0.008 | 0.043 | 1.000 |
| 1-3 | 0.092 | 0.043 | 0.109 | |
| 2-3 | 0.084 | 0.043 | 0.166 | |
| Root of tongue | 1-2 | −0.021 | 0.013 | 0.317 |
| 1-3 | −0.026 | 0.013 | 0.152 | |
| 2-3 | −0.005 | 0.013 | 1.000 | |
| Tip of tongue | 1-2 | −0.080 | 0.044 | 0.217 |
| 1-3 | 0.419 | 0.044 | 0.000 † | |
| 2-3 | 0.499 | 0.044 | 0.000 † |
Stay updated, free dental videos. Join our Telegram channel
VIDEdental - Online dental courses


