Introduction
In this study, we aimed to determine whether the variations in salivary concentrations of soluble receptor activator of nuclear factor kappa B ligand (sRANKL) and osteoprotegerin (OPG), and their ratios, might be linked with the different phases of orthodontic tooth movement.
Methods
Twenty healthy subjects who required fixed appliance therapy not involving tooth extractions or surgical procedures were selected. Unstimulated whole saliva samples were collected from each patient before fitting the orthodontic appliances, and at 24 to 48 hours, 2 weeks, 5 weeks, and 8 weeks after the activation. Salivary sRANKL and OPG concentrations were determined by enzyme-linked immunosorbent assays. The data were analyzed by using nonparametric statistics.
Results
Overall, median values of sRANKL showed significant increases, median OPG salivary values showed a significant downward trend, and the sRANKL/OPG ratio tended to increase significantly over time after the activation visit. However, clear fluctuations in the immunoenzymatic findings were noted at the different sampling times, indicating nonlinear trends in the levels of the biomarkers through time. Post-hoc pairwise comparisons showed significant differences between (1) all sRANKL values relative to those of the 8-week sampling time; (2) baseline/8-week OPG salivary levels; and (3) baseline, 24 to 48 hours, and 2-week sRANKL/OPG ratios compared with those of the 8-week test.
Conclusions
The findings indicate that variations in salivary concentrations of sRANKL and OPG and their ratios might be linked to the different phases of orthodontic tooth movement. Hence, these analytes might serve in a panel of salivary functional biomarkers that could assist in the screening of orthodontic treatment in clinical practice.
Orthodontic tooth movement results from remodeling of the periodontal ligament and alveolar bone that is induced by therapeutic mechanical stress. Although the degree and location of this physical strain might affect the degree of cellular response, based on human studies, it has been thoroughly accepted that orthodontic tooth movement follows a specific pattern in time with 3 phases: an initial phase 24 hours to 2 days after force application representing either rapid displacement of the tooth in the periodontal ligament space or bending of the alveolar bone ; a lag phase, lasting 4 to 20 days, with relatively low rates of tooth displacement or no displacement produced by hyalinization of the periodontal ligament in areas of compression; and an acceleration (postlag) phase during which the rate of orthodontic tooth movement gradually or suddenly increases after the removal of hyalinized tissue formed during the second phase. However, experimental studies in animal models have demonstrated a fourth phase after the acceleration movement, named the linear phase, starting about 40 days after the initial force application during which orthodontic tooth movement continues, maybe because of direct bone resorption. Each phase is determined by tissue-specific reactions involving the recruitment of osteoblast and osteoclast precursors as well as the extravasation and chemotaxis of inflammatory cells. The team of cells carrying out this process is also known as the basic multicellular unit, and its activity can be measured biochemically by determining markers of bone remodeling.
Among these biomarkers, both the receptor activator of nuclear factor kappa B ligand (RANKL) and osteoprotegerin (OPG) have been shown to be key regulators of bone remodeling during orthodontic tooth movement. RANKL, produced by osteoblastic, stromal, and activated T-cells, is the essential factor for osteoclast formation, fusion, activation, and survival, thus resulting in bone resorption and bone loss. RANKL activates its specific receptor RANK, located on osteoclasts and dendritic cells, and its signaling cascade. Two isoforms are produced by alternate splicing: a type II membrane protein (mRANKL), and a soluble molecule (sRANKL) lacking the cytoplasmic and transmembrane domains. Although both forms are bioactive, the membrane-bound protein seems to be the homeostatic form, whereas the production of sRANKL signals pathologic and nonphysiologic conditions. It has been stated that when RANKL is expressed by cells of osteoblastic lineage it is mRANKL, and when expressed by activated T-cells it is sRANKL. The effects of RANKL are counteracted by OPG produced by osteoblastic, hematopoietic, and immune cells, which act as a soluble neutralizing receptor, thus yielding inhibition of terminal stages of osteoclast differentiation, suppression of activation of matrix osteoclasts, and induction of apoptosis. In this way, bone remodeling is controlled by a balance between RANK-RANKL binding and OPG production.
Although there have been many experimental human and animal studies about the association of RANKL and OPG with bone and root remodeling at some point of orthodontic tooth movement, nothing is known concerning the variations in the levels of these 2 biomarkers through the different phases of orthodontic tooth treatment in humans. In addition, because saliva has gained significant recognition as a biologic sample for the detection of biochemical and cellular factors that might reflect the biologic changes related to bone turnover in the oral microenvironment, in this study, we aimed to determine whether the variations in the salivary concentrations of sRANKL and OPG, and their ratios, as detected through a longitudinal follow-up with 5 consecutive visits, could be linked with the different phases of orthodontic tooth movement in healthy subjects.
Material and methods
This prospective longitudinal study was performed with a convenience nonprobabilistic sample of 20 subjects from those who sought treatment at the Postgraduate Orthodontic Clinics of the University of Antioquia in Medellín, Colombia, from January 2010 to December 2011. All potential referred participants were examined at a screening session by an experienced orthodontist (G.A.F.-M.) to establish their suitability for the study. The study conformed to the ethical guidelines of the Helsinki Declaration and was approved by the Institutional Ethics Committee for Human Studies of the University of Antioquia (Technical Research Council-CIFO, Code IORG 0002429). The participants were privately interviewed to obtain medical and demographic information and were given a clinical screening for oral pathology and a periodontal examination. This information included the subject’s sex, age, type of dentofacial pattern, and severity of dental arch crowding.
Eligibility criteria included subjects with a minimum of 20 remaining teeth, need for fixed appliance therapy not involving tooth extractions or surgical procedures, good general and periodontal health (probing depths not exceeding 3 mm in the whole dentition, no radiographic evidence of periodontal bone loss, no more than 10% of sites with bleeding on probing, and no gingival redness or edema). The exclusion criteria included pregnancy and lactation; patients who would not give informed consent; previous history of habits such as alcohol consumption or tobacco use; ongoing orthodontic or orthopedic therapy; any systemic condition that could affect periodontal status and bone metabolism (eg, osteoporosis, gastrointestinal diseases related to nutrition and mineral metabolism, endocrine diseases, immunologic disorders, and connective tissue diseases) or that would require premedication for monitoring or treatment procedures (eg, heart conditions, joint replacements, hormonal or bisphosphonate antiresorptive therapies, and chronic therapy with heparin or corticosteroids); use of antibiotics, corticosteroids, or anti-inflammatory drugs within the last 3 months; and professional cleaning or periodontal treatment within the last 6 months. Preceding the baseline sampling, all subjects received oral hygiene instructions on the use of the toothbrush, dental floss, and interdental brush. The purpose and procedures were fully explained, and informed consents were signed by all participants or the parents or custodians of those less than 18 years of age before their enrollment in the study.
Once the diagnosis and treatment planning were established, before fitting the orthodontic appliances, baseline saliva samples were collected from each patient. About 5 mL of unstimulated whole saliva was collected by having the subjects spit into a 50-mL sterile plastic centrifuge tube (Greiner Bio-one, Frickenhausen, Germany) before breakfast and any dental hygiene procedure. No antiseptic mouth rinse was used before collection. Immediately after collection, whole saliva was clarified by centrifugation for 5 minutes at 800 × g (IEC Centra CL2 centrifuge; Thermo Electron, Milford, Mass). The supernatants were collected and aliquoted into 500-μL volumes and frozen at −75°C until processed.
All subjects were treated with a Roth prescription 0.018 × 0.025-in bracket slot appliance bonded to the maxillary or mandibular teeth. A 0.014-in nickel-titanium conventional archwire was then placed for the initial leveling and alignment stage. Thereafter, saliva samplings were taken at 24 to 48 hours (initial phase), 2 weeks (lag phase), 5 weeks (acceleration phase), and 8 weeks (linear phase) after force application. No further appliance reactivations were performed during these sampling times.
Salivary levels of sRANKL and OPG were measured through an ELISA-based capture assay by using the commercial kits Ampli sRANKL human ELISA and OPG ELISA (Immunodiagnostic Systems, Fountain Hills, Ariz) following the manufacturer’s instructions. Clarified saliva was used undiluted. For both proteins, the optical density was determined within 15 minutes after the 50-μL stop solution was added by using a microplate reader (ChroMate 4300; Awareness Technology, Palm City, Fla) set to 490 nm with reference to 620 nm. To calculate the concentrations, a nonlinear regression model was performed with ChroMate Manager software (Awareness Technology). The standard curves were constructed by using a 4-parameter logistic calibration curve fit and used to calculate the real concentration of each protein in the samples, standards, and internal controls. R-squared values for the typical standard curves were 0.9995 for sRANKL and 0.9998 for OPG. According to the manufacturer, these assays have sensitivities of 0.4 pg/mL minimum detectable dose for sRANKL and 2.8 pg/mL for OPG. In addition, these assays measure the total levels of sRANKL or OPG in the samples, including not only the unbound forms, but also the sRANKL-OPG complex (Immunodiagnostic Systems data).
Statistical analysis
The data collected were analyzed by using a statistical package (version 19.0; IBM SPSS, Chicago, Ill). All study subjects were compared to determine any differences between them that might act as potential confounders and to assist in interpreting the results. Reproducibility for the ELISA assays was determined through double evaluations for each test performed by the same researcher (D.M.I.-G.) with 5 samples selected randomly using a computer-generated randomization code (Epidat version 3.1; PAHO/WHO, Washington, DC). The interval between the 2 tests was 7 days. For comparisons, the reliability between the 2 series of data was assessed by using the intraclass correlation coefficient (ICC) test. An ICC <0.40 indicated poor reproducibility, 0.40 to 0.75 indicated fair to good reproducibility, and ≥0.75 indicated excellent reproducibility.
All parameters were tested for normal distribution by using the Shapiro-Wilks test. Because the data showed nonnormal distributions, probably because of the small sample size, the variables were analyzed with nonparametric methods. Consequently, analysis of categorical variables was based on the Pearson chi-square test or the Fisher exact test (when frequency was <5). Likewise, for the analysis of immunoenzymatic findings against other demographic and clinical parameters, the Kruskal-Wallis H and Mann-Whitney U tests were used when appropriate. Accordingly, demographic and clinical parameters were categorized by focusing on sex (male vs female), age stratum (<18 years vs ≥18 years), dentofacial pattern (Class I, Class II, or Class III relationship), dental arch crowding (mild vs moderate), and location of orthodontic appliance (monomaxillary vs bimaxillary). Also, the Friedman test and the Kendall W coefficient of concordance for repeated measures were used to compare the immunoenzymatic findings over the sampling time periods. In significant cases, the Wilcoxon signed rank test for matched samples was performed as a post-hoc test. All tests were 2-sided, and statistical significance was assumed at a P value <0.05.
Results
No subject showed clinical evidence of gingival or periodontal inflammation before fitting of the orthodontic appliances, and there were no clinical signs of inflammation after appliance activation (data not shown). The study included 9 male subjects from 11 to 19 years (median age, 13 years) and 11 female subjects from 11 to 57 years (median age, 14 years). A Class I relationship was the most common dentofacial pattern (10 subjects). This was followed by a Class II relationship (5 subjects) and a Class III pattern (5 subjects). According to sex and dental arch crowding severity, 10 subjects were mild (6 male, 4 female), and 10 subjects were moderate (3 male, 7 female). Finally, 15 subjects were treated with monomaxillary orthodontic appliances, and 5 subjects were treated with bimaxillary appliances. There were no significant differences between the sexes with respect to age ( P = 0.261; Mann-Whitney U test), dentofacial pattern, dental arch crowding, or location of the orthodontic appliances (all, P >0.05, chi-square and Fisher exact tests; data not shown).
A total of 100 unstimulated whole saliva samples (5 per subject) were processed for each analyte. In general terms, reproducibility was excellent for both sRANKL (ICC = 0.995; P <0.001) and OPG (ICC = 0.891; P = 0.027) quantitative estimations. Furthermore, the statistical power calculation indicated that the sample size could allow the detection of significant differences in the salivary levels of these 2 biomarkers across the sampling times at the 95% confidence level, with an α value of 0.05%, and 78.8% to 81.4% power for OPG and sRANKL, respectively. As depicted in Table I , the assessment of these bone remodeling regulators at each time interval showed no significant differences ( P >0.05; Kruskal-Wallis H and Mann-Whitney U tests) regarding the demographic and clinical parameters, thus allowing optimal comparability of the data between subjects.
| Parameter | n | Immunoenzymatic findings ∗ | |||||||||
|---|---|---|---|---|---|---|---|---|---|---|---|
| sRANKL (pg/mL) | OPG (pg/mL) | ||||||||||
| Baseline test | 24-48 h test | 2-wk test | 5-wk test | 8-wk test | Baseline test | 24-48 h test | 2-wk test | 5-wk test | 8-wk test | ||
| Sex | |||||||||||
| Male | 9 | 2.80 (1.10-9.80) | 2.20 (1.40-4.80) | 4.20 (1.90-9.00) | 3.00 (2.20-5.70) | 6.00 (2.70-15.70) | 49.6 (22.0-173.4) | 49.0 (19.9-87.6) | 97.8 (18.1-150.4) | 31.6 (2.80-92.2) | 68.0 (2.80-126.9) |
| Female | 11 | 3.00 (2.40-4.80) | 2.80 (1.80-4.60) | 3.00 (2.00-3.80) | 2.80 (1.60-4.80) | 5.20 (2.80-33.40) | 103.6 (49.6-189.2) | 60.6 (49.6-131.0) | 69.4 (47.4-159.0) | 101.0 (40.2-150.6) | 95.4 (8.20-104.6) |
| P value † | 0.941 | 0.766 | 0.331 | 0.710 | 0.710 | 0.456 | 0.295 | 0.766 | 0.080 | 0.766 | |
| Age (y) | |||||||||||
| <18 | 14 | 2.90 (1.65-8.55) | 2.70 (1.75-4.15) | 3.10 (1.85-3.10) | 3.10 (1.90-5.55) | 8.40 (3.10-27.4) | 96.8 (31.0-190.1) | 74.3 (46.3-122.6) | 83.6 (41.1-203.7) | 77.9 (24.0-124.1) | 62.0 (2.8-104.4) |
| ≥18 | 6 | 2.80 (0.90-6.15) | 2.70 (1.00-8.00) | 2.95 (2.25-9.30) | 2.90 (2.10-6.50) | 3.40 (1.80-9.30) | 76.6 (39.1-166.5) | 46.7 (34.5-143.8) | 96.5 (10.15-151.7) | 66.3 (19.9-150.8) | 97.5 (61.9-154.2) |
| P value † | 0.659 | 0.904 | 0.968 | 1.000 | 0.109 | 0.718 | 0.353 | 0.841 | 0.968 | 0.312 | |
| Dentofacial pattern | |||||||||||
| Class I relationship | 10 | 4.30 (2.55-8.55) | 2.90 (1.45-4.55) | 4.70 (2.90-10.6) | 3.50 (2.60-6.90) | 11.50 (5.50-26.2) | 92.6 (31.0-196.9) | 49.3 (37.3-122.8) | 48.7 (27.2-203.0) | 44.2 (2.80-193.0) | 50.0 (2.80-110.0) |
| Class II relationship | 5 | 1.20 (0.50-6.70) | 3.20 (1.70-5.30) | 2.80 (1.80-3.45) | 3.00 (2.20-6.00) | 2.80 (2.40-19.0) | 49.6 (15.6-133.1) | 50.2 (18.4-90.2) | 69.4 (3.50-124.1) | 85.6 (17.2-116.0) | 95.4 (46.6-103.7) |
| Class III relationship | 5 | 2.60 (1.40-6.60) | 1.80 (1.40-4.00) | 2.00 (1.10-4.30) | 2.40 (0.60-4.30) | 3.20 (2.20-15.3) | 189.2 (86.2-198.4) | 91.0 (74.3-277.8) | 151.6 (108.5-259.5) | 108.2 (53.6-136.6) | 109.2 (38.1-151.5) |
| P value ‡ | 0.325 | 0.609 | 0.073 | 0.222 | 0.192 | 0.169 | 0.115 | 0.127 | 0.649 | 0.351 | |
| Dental arch crowding | |||||||||||
| Mild | 10 | 3.20 (1.15-8.65) | 2.70 (1.75-4.40) | 3.60 (2.45-10.6) | 3.20 (1.90-7.35) | 8.40 (4.00-26.2) | 117.4 (41.2-223.3) | 46.6 (26.4-157.9) | 131.1 (36.6-204.8) | 59.9 (19.9-171.4) | 79.2 (2.80-126.3) |
| Moderate | 10 | 2.90 (1.65-6.00) | 2.80 (1.00-4.95) | 2.85 (1.80-4.15) | 2.80 (2.10-4.35) | 3.60 (2.65-15.8) | 64.7 (31.0-188.0) | 70.6 (49.6-98.2) | 59.7 (27.2-118.7) | 80.9 (24.0-135.9) | 88.5 (6.90-105.8) |
| P value † | 0.971 | 0.796 | 0.280 | 0.579 | 0.280 | 0.436 | 0.353 | 0.393 | 0.971 | 1.000 | |
| Location of orthodontic appliance | |||||||||||
| Monomaxillary | 15 | 3.00 (1.20-9.60) | 2.60 (1.60-4.60) | 3.00 (1.40-5.60) | 3.00 (1.60-6.00) | 6.40 (2.80-25.4) | 112.0 (49.6-192.8) | 68.0 (43.6-119.8) | 105.2 (47.4-159.0) | 76.2 (31.0-131.0) | 90.4 (8.20-109.2) |
| Bimaxillary | 5 | 2.60 (1.80-6.30) | 3.20 (1.40-5.10) | 3.10 (2.80-7.80) | 2.80 (2.70-3.50) | 4.00 (1.70-12.0) | 47.0 (12.6-146.4) | 49.8 (21.0-90.6) | 12.2 (4.00-84.6) | 101.0 (2.80-136.2) | 81.6 (2.80-112.4) |
| P value † | 0.800 | 0.800 | 0.553 | 0.866 | 0.266 | 0.168 | 0.395 | 0.053 | 0.866 | 0.735 | |
∗ Results are given as medians and interquartile ranges (25th-75th percentiles) of each measurement
The results of quantitative changes of salivary concentrations of sRANKL and OPG and their ratios at the different sampling times are given in Table II . Clear fluctuations in the immunoenzymatic findings are noticeable at these sampling times, thus indicating nonlinear trends in the levels of the biomarkers through time (all Kendall W values <0.200). Consequently, although the median values of sRANKL showed statistically significant increases through time (chi-square = 13.357; df = 3; P = 0.010; Friedman test), slight reductions in the amounts of the marker at 24 to 48 hours and 5 weeks were also noted. In contrast, median OPG salivary values showed a significant downward trend over time after the activation visit (chi-square = 11.000; df = 3; P = 0.027) with some rise in the amounts of the protein levels at the 2-week and 8-week tests. In addition, the overall sRANKL/OPG ratio tended to increase significantly over time (chi-square = 12.543; df = 3; P = 0.014) except at the 2-week sampling time, when a slight reduction was detected.
| Trial phase | Immunoenzymatic findings | |||||
|---|---|---|---|---|---|---|
| sRANKL (pg/mL) | OPG (pg/mL) | sRANKL/OPG ratio | ||||
| Median (IQR) | Mean rank | Median (IQR) | Mean rank | Median (IQR) | Mean rank | |
| Baseline test | 2.90 (1.35-8.10) | 2.55 | 92.60 (35.75-188.50) | 3.90 | 0.049 (0.015-0.081) | 2.38 |
| 24-48 h test | 2.70 (1.65-4.45) | 2.68 | 55.40 (39.40-112.60) | 2.98 | 0.053 (0.016-0.081) | 2.63 |
| 2-wk test | 3.05 (2.15-5.50) | 2.80 | 83.60 (35.15-151.00) | 3.15 | 0.045 (0.013-0.224) | 2.78 |
| 5-wk test | 2.90 (2.10-5.25) | 2.85 | 77.90 (26.95-128.70) | 2.53 | 0.051 (0.022-0.499) | 3.28 |
| 8-wk test | 5.60 (2.80-22.25) | 4.13 | 86.00 (4.15-108.05) | 2.45 | 0.149 (0.030-0.624) | 3.95 |
| Chi-square | 13.357 | 11.000 | 12.543 | |||
| P value ∗ | 0.010 | 0.027 | 0.014 | |||
| Coefficient of concordance † | 0.167 | 0.138 | 0.157 | |||
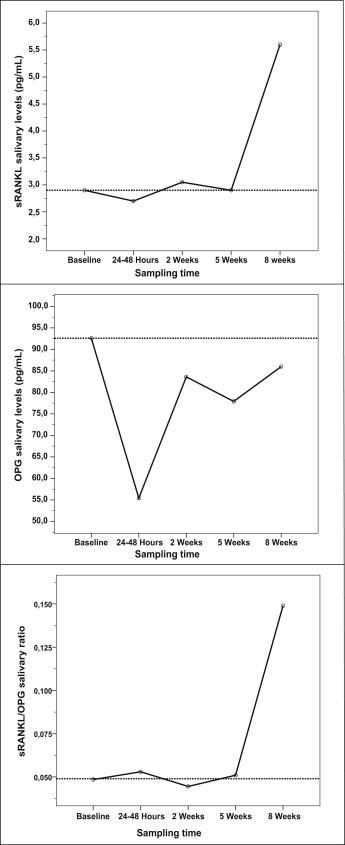
To clarify these results, data about variations for each biomarker and their ratios over time are illustrated in the Figure . As can be seen, shortly after the initial force application (24-48 hours), both sRANKL and OPG salivary concentrations fell below baseline levels; however, OPG levels showed a more substantial decrease, so that the sRANKL/OPG ratio increased with respect to the baseline test. On the contrary, at 2 weeks after force application, although the salivary biomarker concentration increased close to the baseline data, the sRANKL/OPG ratio decreased below the baseline level, mainly because of the major rise of the OPG levels at this sampling time. At longer times (5-week test), the amount of sRANKL decreased toward baseline values, but OPG decreased more than this value, thus leading to an increased sRANKL/OPG ratio. Finally, each protein had a peak at the 8-week sampling time, but the concentration of sRANKL had become greater than the OPG concentration, so that a great rise in the sRANKL/OPG ratio was found.