Introduction
The purpose of this study was to evaluate the concept that the affected and contralateral sides do not grow at the same rate in patients with hemifacial microsomia. Changes in the cranial base, maxilla, mandible, and occlusal plane were evaluated on 3-dimensional images from cone-beam computed tomography data in untreated patients.
Methods
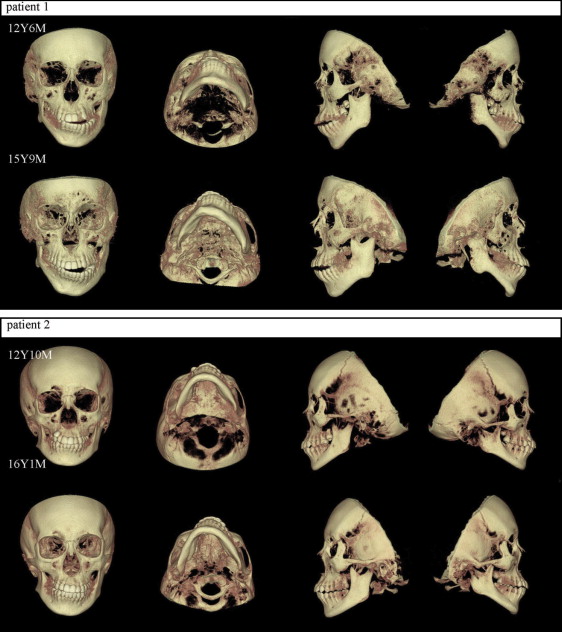
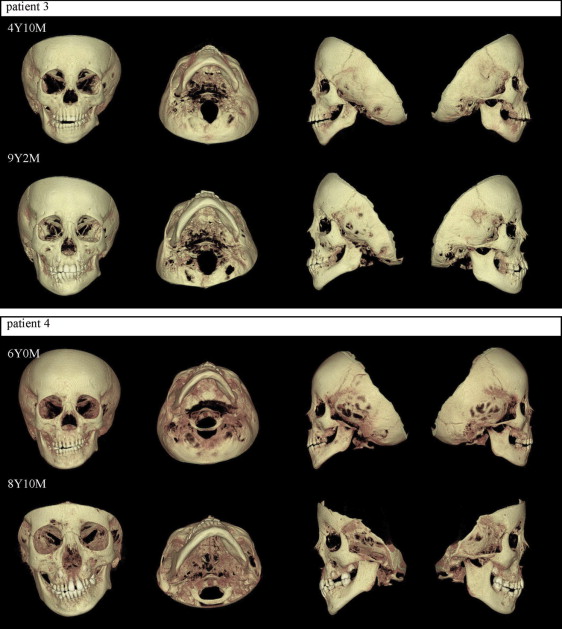
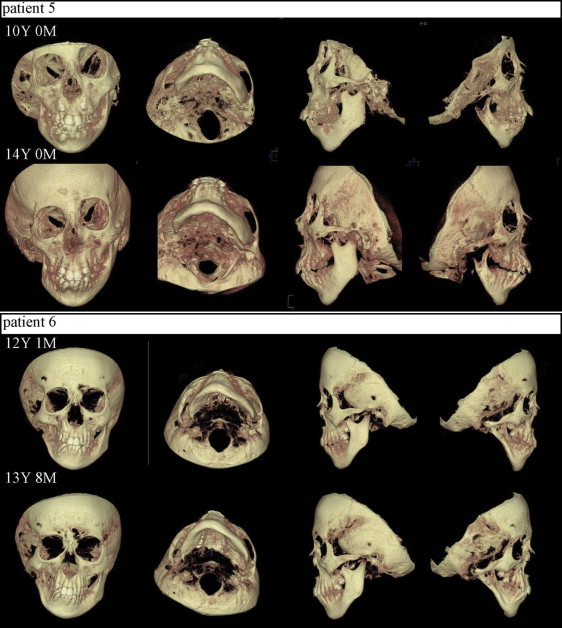
Six patients were classified as having mandibular Pruzansky/Kaban type I, IIA, or IIB hemifacial microsomia. Cone-beam computed tomography (MercuRay; Hitachi, Tokyo, Japan) scans were taken before orthodontic treatment during both growth and postpuberty periods.
Results
The cranial base as defined by the position of the mastoid process was in a different position between the affected and contralateral control sides. The nasomaxillary length or height was shorter on the affected side for all 6 patients with hemifacial microsomia regardless of its severity, and it grew less than on the contralateral control side in 5 of the 6 patients. The occlusal plane angle became more inclined in 4 of the 6 patients. The mandibular ramus was shorter on the affected side in all patients and grew less on the affected side in 5 of the 6 patients. The mandibular body grew slower, the same, or faster than on the control side.
Conclusions
The cranial base, position of the condyle, lengths of the condyle and ramus, and positions of the gonial angle and condyle can vary between the affected and contralateral control sides of patients with hemifacial microsomia, with the ramus and nasomaxillary length usually growing slower than they grow on the control side. These results suggest that many factors affect the growth rate of the craniofacial region and, specifically, the mandible in patients with hemifacial microsomia.
Hemifacial microsomia (HFM) refers to a relatively common craniofacial anomaly that is induced prenatally in the embryonic or fetal stage and that expresses itself postnatally in the development of an asymmetrical mandible and associated disorders of the ipsilateral mandible, maxilla, zygomatic arch, and auditory bones. HFM is a progressive skeletal and soft-tissue deformity. Although the long-term concept has been that local embryonic hemorrhage or disorders in the neuroectodermal migration cause HFM, it is also possible that interference in chondrogenesis induces it. Animal models have been developed that appear similar to HFM and involve administering triazine to pregnant mice to produce hemorrhage in the stapedial artery or exposing animals to retinoic acid, which kills neural crest cells and interferes with their movement. HFM expresses phenotypically in a range of disorders from a mild expression involving the condyle to the most severe condition in which the ramus, condyle, and coronoid process are missing on 1 side, and the cranial bones and orbits of the midface can demonstrate marked asymmetry. HFM is differentiated from asymmetrical mandibles, which develop only postnatally. Whereas postnatally developed asymmetrical mandibles can result from several causes including hypoplastic or hyperplastic condylar growth, the expression of this asymmetrical growth can reflect some characteristics of HFM postnatally. Asymmetrical mandibles can also develop immediately with surgical intervention, often seen in hemimandibulectomy subjects in whom a portion of the mandible on 1 side, often with part of the tongue, is removed for surgical treatment of a specific cancer.
Although HFM is unique in its initial cause, which impairs the normal development of a region of the craniofacial skeleton in the embryologic or fetal stage, its postnatal expression might depend on several additional factors that contribute to the asymmetry. These factors include an imbalanced occlusion distributing forces through the bones differently from a normally symmetrical mandible, and jaw muscles such as the temporalis, masseter, and medial pterygoid contributing more imbalanced recruitment in the asymmetrical mandible that might further enhance or extend its abnormal development.
Approaches to treat HFM vary with different investigators and clinicians and include the concept of early surgical intervention to correct the abnormal side, extending the mandible by distraction ontogenesis, or replacing the missing condyle with tissue that includes growth sites or growth center tissues such as a joint from the ribs. Other investigators have supported the second concept of waiting much later and not intervening in a young subject, hence decreasing the episodes of surgical intervention, because the mandibular asymmetry does not progress. Some investigators advocate modifying the occlusion with a functional appliance and providing support for the mandibular muscles to function with a more symmetrically positioned mandible in anticipation of completing surgery on the abnormal side of the mandible. Three-dimensional (3D) studies of the muscles in HFM with helical computed tomography (CT) have indicated that the volumes of the temporalis, masseter, medial, and lateral pterygoid muscles are significantly smaller on the affected side. Surface electromyographic recordings from the temporalis and masseter muscles in patients with HFM have shown that subjects with types I and IIA demonstrate relatively normal recruitment patterns of clenching, chewing, and biting, but patients with type IIB demonstrate significant modifications in recruiting these muscles on the affected side. Magnetic resonance imaging studies of the temporomandibular joint indicate that the condyle-fossa and disc-condyle relationships are fairly normal on the unaffected side but demonstrate much variation on the affected side. Distraction ontogenesis or osteodistraction has proven to be valuable in developing a stable change in the anteroposterior direction, whereas vertical lengthening occurs less often. However, some investigators suggest that scientific evidence is still needed from randomized controlled trials on early distraction ontogenesis in treating patients with HFM. In addition, costrocondral grafts replacing the ramus and the condyle have had mixed results in patients with HFM.
The field of craniofacial biology and medicine has advanced with several techniques and systems that can provide new directions in evaluating patients with HFM and patients who develop asymmetrical mandibles postnatally. Computerized 3D models have been developed from lateral and posteroanterior cephalograms using a vector intercept algorithm. Spiral CT analysis has been used to evaluate patients with HFM 3 dimensionally, but it has long scan times and high levels of radiation, and is expensive, thus limiting its value in longitudinal analysis. Cone-beam CT (CBCT) is a major step forward because it provides multiplanar scans and surface-rendered 3D volumetric data with much lower radiation than traditional spiral CT scanners and much shorter scans (<1 minute), allowing more than 1 time point in analysis. Data generated with CBCT can be inserted into sophisticated finite element models that are developed from each patient’s unique craniofacial skeleton, providing a method to assess how forces are developed on both condyles and in the bones as the occlusion is altered during treatment in a patient with HFM. Computer models are now available that allow placing the characteristics of the jaw muscles for each patient into a model that shows the craniofacial region and that can be modified to simulate the actual structures of that HFM patient, so that the forces generated by the jaw muscles can be predicted, and the stresses and strains that they generate in the abnormal bony skeleton can be followed with treatment. These 3 new tools of CBCT, CBCT-generated finite element models, and computer real-life simulations of muscle-bone interaction in the craniofacial region provide powerful approaches to assess how the surgical intervention to treat the HFM patient is working. Such analysis is critical to improving treatment of these patients and any patients developing true mandibular asymmetries.
Even though HFM can result from early abnormal development in the embryo or fetus, its resulting morphologic development over the postnatal period might be a combination of factors that include abnormal tissues without the normal potential for growth, and an asymmetrical craniofacial region including the mandible, which develops forces differently than in a normal, bilaterally symmetrical system with normal muscles bilaterally. Underdeveloped tissues of the craniofacial region of HFM, as in the condyle, can lack the full cellular potential of the proliferative and hypertrophic zones of the cartilage, as well as the translation of cartilage into bone. In addition, in the extreme cases of HFM patients with missing ramus and condyle and much smaller jaw muscles, the muscles on the intact side provide an asymmetrical set of forces through the craniofacial skeleton assisted by the malocclusion of the dentition so that the asymmetrical mandible and craniofacial skeleton experience strains and stresses that could maintain or enhance the asymmetry.
Several longitudinal studies in untreated patients with HFM have suggested different viewpoints as to how the asymmetry develops. Some investigators believe that the facial asymmetry continues to develop during maturation including puberty. One hypothesis to explain this phenomenon is that the major affected side has little potential for growth even if it has both structures (ie, condyle, ramus) and grows slower than the unaffected side. Other investigators believe that facial asymmetry does not increase with maturation, and treatment can be delayed until adolescence, because the growth of the affected side is similar to that of the contralateral side.
Treatment of patients with HFM has often focused on correcting the mandible and its temporomandibular joint, with the concept that a more normal mandible with a bilateral occlusion will not only provide the more symmetrical face sought by the patient, but also address the underlying biologic concepts that maintain these tissues. The practicality of replacing the underdeveloped bone and muscle tissues in patients with HFM is continually being pursued. This approach includes osteodistraction, implanting transplanted grafts or rib joints with growth potential to replace the condyle, or transplanting muscle with its own nerve and blood supply to supplement the bony surgery. Exciting new research approaches include developing condylar matrices and implanting 3D matrices that induce development of a condyle. The concept of directly injecting specific chemicals (such as parathyroid hormone) into the temporomandibular joint has been tried and suggests potential future ideas of implanting long-term releases of specific factors that could modify condylar growth.
A second animal model also suggests potential chemical mediators that might be injected and applied to the condyle. In experimental studies in young, rapidly growing animals that force them to close to 1 side during chewing, biting, and gnawing because of an occlusal splint on the incisors, the animals develop an asymmetrical mandible and an altered condylar shape. This animal model has provided 2 new important facts comparing how and when the jaw muscles adapt as the craniofacial skeleton becomes asymmetrical and detailed analysis of the genetic and cellular responses in the condyle. Altering a normally developing mandible when the jaw closes to 1 side changes the genetic expression of insulin-like growth factor-1 and fibroblast growth factor-2 and their receptors, particularly on the side that protrudes during function. The identification of key chemical markers that affect condyle growth could be important to new long-term treatment concepts for controlling the growth of the underdeveloped condyle in patients with HFM.
Many previous studies of HFM have focused on potential causes and defining the resulting morphology. Current classification systems for HFM focus on mandibular hypoplasia. The original classification system of Pruzansky indicated that the mandible has either a grossly distorted ramus without identifiable landmarks or complete loss of the condyle and coronoid process defining grades I, II, and III ( Table I ). Kaban et al expanded the classification by subdividing grade II into type IIA, which has a small condyle and glenoid fossa anatomically oriented, and type IIB with a nonaligned condyle and ramus with displacement of the ramus from the glenoid fossa. Most of these previous morphologic studies were based on 2-dimensional systems, but CT and CBCT have allowed defining the craniofacial morphology using 3-dimensionally generated volumetric images. Huisinga-Fische et al defined a craniofacial deformity scoring system that scores both the craniofacial and the mandibular deformities. The purpose of our study was to evaluate the concept that the affected and contralateral sides do not grow at the same rate in patients with HFM.
| Patient | Sex | Age | Period ∗ | Skeletal type † | Affected side | Craniofacial deformity scoring system ‡ | |||
|---|---|---|---|---|---|---|---|---|---|
| Examination 1 | Examination 2 | MDS | CDS | CFDS | |||||
| 1 | Male | 12 y 6 mo | 15 y 9 mo | 3 y 3 mo | I | Right | 4 | 3 | 7 |
| 2 | Female | 12 y 10 mo | 16 y 1 mo | 3 y 3 mo | I | Right | 4 | 1 | 5 |
| 3 | Male | 4 y 10 mo | 9 y 2 mo | 4 y 3 mo | IIA | Left | 5 | 9 | 14 |
| 4 | Female | 6 y 0 mo | 8 y 10 mo | 2 y 10 mo | IIA | Left | 6 | 9 | 15 |
| 5 | Male | 10 y 0 mo | 14 y 0 mo | 4 y 0 mo | IIB | Right | 13 | 14 | 27 |
| 6 | Male | 12 y 1 mo | 13 y 8 mo | 1 y 7 mo | IIB | Right | 11 | 13 | 24 |
Material and methods
This was a longitudinal analysis of patients with HFM seen in the Department of Orthodontics at the dental hospital of Showa University. Data were gathered by reviewing dental records to find patients with 2 consecutive CBCT scans and measuring from CBCT 3D volumetric surface-rendered images. Criteria for inclusion in this study were unilateral HFM, no associated craniofacial anomaly, and CBCT scans (CB MercuRay; Hitachi, Tokyo, Japan) taken before orthodontic treatment, and before or after growth. Six patients were classified as having mandibular type I, IIA, or IIB HFM ( Table I ; Figs 1-3 ) based on the schema of Kaban et al ( Table II ).
| Pruzansky | ||||
| Grade I | Difference in size from the assumed normal side in the same person, characteristics of the ramus are clearly present. | |||
| Grade II | Condyle, ramus, and sigmoid notch, while still identifiable, are grossly distorted, and the mandible is strikingly different in size and shape from any concept of normal. | |||
| Grade III | Either a grossly distorted ramus with loss of identifiable landmarks or complete agenesis of the ramus. | |||
| Kaban et al | ||||
| Type I | All components are present but hypoplastic to varying degrees. Temporomandibular joint is present but with reduced cartilage and joint space; hinge movement is normal, but there is reduced translation during jaw opening. | |||
| Type IIA | An articulation that allows hinge but not translatory movement is present; there is no morphologically normal joint. The condylar process is cone shaped and positioned anterior and medial of the normal position. Coronoid process and gonial angle are well developed. | |||
| Type IIB | No condylar process that articulates with the temporal bone is present, but there is a coronoid process of varying size. In some persons, there is a small bony extension at the posterior border of the ramus. | |||
| Type III | No condylar or coronoid process and no gonial angle area are present. | |||
| Harvold et al | ||||
| Type I (A) | Classic type | |||
| Unilateral congenital facial underdevelopment without microphthalmos or ocular dermoids, but with or without abnormalities of the vertebrae, heart, or renal system. Abnormalities of any type (microtia, auricular tags or pits, malar hypoplasia, ptosis) on the contralateral side of the face exclude patients from this category. | ||||
| Type I (B) | Microphthalmic type | |||
| Same as type I (A) except for presence of microphthalmos. | ||||
| Type I (C) | Bilateral asymmetrical type | |||
| Bilateral congenital facial underdevelopment in which 1 side of the face is more severely involved. Except for the bilateral requirement, this type can have any other feature of type I A and B | ||||
| Type I (D) | Complex type | |||
| Not fitting into any of the above types (I A-C), but no limb deficiency, frontonasal phenotype, or ocular dermoids. | ||||
| Type II | Limb deficiency type | |||
| Unilateral or asymmetrical facial underdevelopment with unilateral or bilateral limb deficiency with or without ocular abnormalities, including ocular dermoids. | ||||
| Type III | Frontonasal type | |||
| Relative unilateral underdevelopment of the face with hypertelorism with or without nares separation, ocular dermoids, and vertebrae, heart, or renal abnormalities. | ||||
| Type IV (A, B) | Goldenhaar type | |||
| Unilateral (type A) or bilateral (type B) facial underdevelopment associated with unilateral or bilateral ocular dermoids with or without upper lid coloboma. | ||||
| Huisinga-Fische et al (Craniofacial deformity scoring system = mandibular deformity score + cranial deformity score) | ||||
| 0 | 1 | 2 | 3 | |
| Mandibular deformity score (Maximum score, 16) | ||||
| Gonial notch | Not present | Present | ||
| Mandibular body | Normal | Minimally hypoplastic | Moderately hypoplastic | Absent |
| Condyle | Normal | Minimally hypoplastic | Moderately hypoplastic | Absent |
| Coronoid process | Normal | Minimally hypoplastic | Moderately hypoplastic | Absent |
| Ramus | Normal | Minimally hypoplastic | Moderately hypoplastic | Absent |
| Temporomandibular joint | Normal | Minimally affected | Moderately affected | Absent |
| Cranial deformity score (Maximum score, 19) | ||||
| Maxillary cleft | Not present | Present | ||
| Foramen magnum | Not affected | Affected | ||
| Maxilla | Not affected | Affected | ||
| Calvarium | Not affected | Affected | ||
| Temporal fossa | Not affected | Affected | ||
| Orbit | Normal location and shape | Abnormal location or shape | Abnormal location and shape | |
| Pterygoid process | Normal | Dislocation or hypoplastic | Partially absent | Totally absent |
| Malar bone | Normal | Hypoplastic | Partially absent | Totally absent |
| Zygomatic arch, maxillary part | Normal | Hypoplastic | Partially absent | Totally absent |
| Zygomatic arch, temporal part | Normal | Hypoplastic | Partially absent | Totally absent |
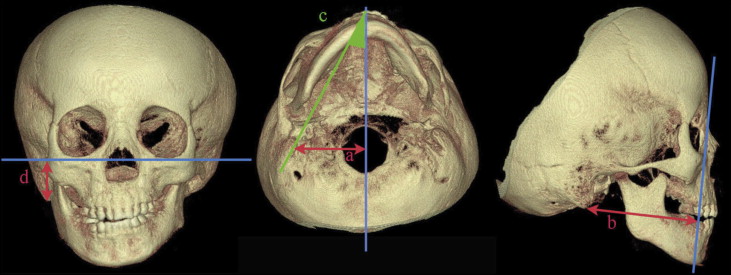
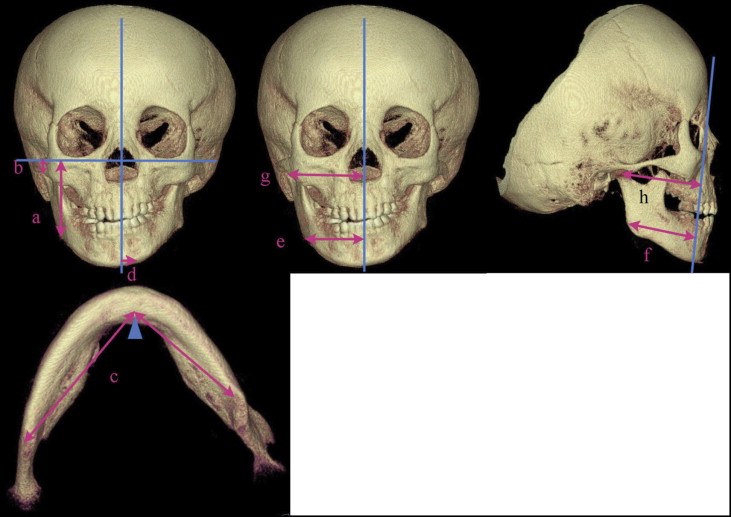
The measurements, made by 1 investigator (R.S.-Y.), were obtained from the anatomically accurate 3D volumetric images with the analysis software CB works (Hitachi). Measurements were taken in 3 dimensions and included 3 sets of data based on the site: cranial base ( Fig 4 ), maxilla ( Fig 5 ), and mandible ( Fig 6 , Table III ). The depth, height, and angle of the cranial base were determined. Each measurements was made 3 times and compared between the 2 time points, and between the affected and unaffected sides, using analysis of variance at a significance level of P <0.05.
| Cranial | |
| Cranial base width (R, L) | Distance from the lower border of the mastoid process perpendicular to the sagittal plane (nasion-anterior nasal spine-posterior edge of foramen magnum) |
| Cranial base depth (R, L) | Distance from the lower border of the mastoid process perpendicular to the facial plane (nasion-lower border point of orbitale [R]-lower border point of orbitale [L]) |
| Cranial base angle (R, L) | Angle between the sagittal plane and nasion-lower border of the mastoid process |
| Cranial base height (R, L) | Distance from the lower border of the mastoid process perpendicular to the Frankfort horizontal plane (orbitomeatal plane) |
| Maxillary | |
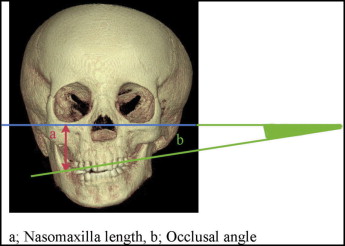
| Nasomaxillary length (R, L) | Distance from the mesiobuccal cusp of the maxillary first molar perpendicular to the Frankfort horizontal plane |
| Occlusal plane angle | Angle between the Frankfort horizontal plane and the line between the mesiobuccal cusps of (R, L) of the maxillary first molars |
| Mandibular | |
| FH-gonial length (R, L) | Distance from the lower border of gonion perpendicular to the Frankfort horizontal plane |
| FH-condyle length (R, L) | Distance from the lateral condylar apex perpendicular to the Frankfort horizontal plane |
| Body length (R, L) | Distance from the lower border of the symphysis perpendicular to the Frankfort horizontal plane |
| Bony midline | Distance from the lower border of the symphysis perpendicular to the sagittal plane |
| Gonion width (R, L) | Distance from the lower border of gonion perpendicular to the sagittal plane |
| Gonion depth (R, L) | Distance from the lower border of gonion perpendicular to the facial plane |
| TMJ position width (R, L) | Distance from the lateral condylar apex perpendicular to the sagittal plane |
| TMJ position depth (R, L) | Distance from the lateral condylar apex perpendicular to the facial plane |
Landmarks were determined based on traditional sites used in normal craniofacial anatomy and often used in cephalometric 2-dimensional analysis. Some landmarks were more difficult to define because the anatomy would significantly alter its form, leading to the concept that some new landmarks, particularly appropriate for 3D analysis, need to be developed. The validity of such measurements can be based on both the 3D surface-rendered volumetric image and scans of slices through planes. Schlicher et al showed that the most inconsistent landmark was the right porion evaluated in 19 normal patients by 9 orthodontists, and the most imprecise was the right orbitale, supporting the concept that alternative landmarks are needed. However, as Ulrich indicated, the right orbitale had wide variations in his 5 patients: 1 was extremely asymmetric, but only along the x-axis when the 3 planes were evaluated for each landmark. Similar findings were also shown by Lagravère et al. Studies of landmarks by Brown et al showed that the medio-orbitale and the zygomaticofrontal medial suture point might provide effective landmarks.
The reliability of the measurements was evaluated by determining the coefficient of variation for all 18 measurements; this varied from the lowest of 0.24% (cranial base on the control side) to 5.2% (condylar length on the control side), with an average of 0.99% (<1%). The coefficient of variation was not greater with the measurements on the affected side vs the control side. Although the measurements were highly consistent when repeated by 1 investigator, future studies should assess the most stable landmarks that can be used in 3D evaluations of the craniofacial region and include the landmarks used by Ulrich (foramen rotundum, zygonion point, glenoid fossa superior). Ulrich’s analysis using the Bland-Altman test for reproducibility in 3 planes over 3 time points for 16 measurements showed that each measurement varied by less than 0.4 mm.
Results
The cranial base width measured from the sagittal plane to the mastoid process was similar in size between the 2 sides in the patients with types I and IIA but larger on the affected side, both laterally and sagittally, in the patients with type IIB, and it grew slower on the affected side than on the contralateral control side in these patients ( Fig 4 , Table IV ). The cranial base depth or the posterior distance of the mastoid from the facial plane was shorter on the affected side in 1 type I patient and both type IIA patients, but larger on the affected side of the type IIB patients. The length of the cranial base depth did not change in the type IIA and IIB patients on the affected side, but it increased on the contralateral control side. The cranial base angle from the sagittal plane to the mastoid was larger on the affected side in 5 of the 6 patients with HFM. The cranial base height was shorter on the affected side in the type IIA and IIB patients but similar to the contralateral control side in the type I patients. The cranial base height increased at a greater rate on the affected side in 5 of the 6 patients with HFM.
| Patient | Skeletal type ∗ | Affected side | Age | Cranial base width (mm) | Cranial base depth (mm) | Cranial base angle (°) | Cranial base height (mm) | ||||||||||||||||
|---|---|---|---|---|---|---|---|---|---|---|---|---|---|---|---|---|---|---|---|---|---|---|---|
| Affected side | SD | Control side | SD | Control-affected difference | Affected side | SD | Control side | SD | Control-affected difference | Affected side | SD | Control side | SD | Control-affected difference | Affected side | SD | Control side | SD | Control-affected difference | ||||
| 1 | I | Right | 12 y 6 mo | 52.96 | 0.05 | 52.76 | 0.25 | −0.20 | 67.75 | 0.09 | 71.97 | 0.12 | 4.22 | 26.78 | 0.04 | 28.31 | 0.14 | 1.53 | 18.00 | 0.02 | 21.08 | 0.02 | 3.08 |
| 15 y 9 mo | 56.22 | 0.08 | 53.02 | 0.04 | −3.20 | 73.38 | 0.41 | 73.93 | 0.10 | 0.55 | 26.47 | 0.02 | 26.27 | 0.02 | −0.20 | 28.23 | 0.04 | 26.94 | 0.02 | −1.29 | |||
| Change | 3.26 | 0.26 | 5.63 | 1.96 | −0.31 | −2.04 | 10.23 | 5.86 | |||||||||||||||
| % change | 106.16% | 100.49% | 108.31% | 102.72% | 98.84% | 92.79% | 156.83% | 127.80% | |||||||||||||||
| 2 | I | Right | 12 y 10 mo | 48.16 | 0.16 | 48.09 | 0.12 | −0.07 | 71.21 | 0.17 | 70.53 | 0.02 | −0.68 | 24.61 | 0.01 | 23.60 | 0.10 | −1.01 | 27.83 | 0.11 | 28.49 | 0.01 | 0.66 |
| 16 y 1 mo | 48.80 | 0.12 | 48.06 | 0.01 | −0.74 | 77.77 | 0.37 | 76.71 | 0.04 | −1.06 | 25.56 | 0.01 | 23.77 | 0.04 | −1.79 | 29.31 | 0.16 | 28.52 | 0.01 | −0.78 | |||
| Change | 0.64 | −0.03 | 6.56 | 6.18 | 0.95 | 0.17 | 1.48 | 0.03 | |||||||||||||||
| % change | 101.33% | 99.94% | 109.21% | 108.76% | 103.86% | 100.72% | 105.32% | 100.11% | |||||||||||||||
| 3 | IIA | Left | 4 y 10 mo | 47.63 | 0.37 | 48.15 | 0.25 | 0.52 | 67.29 | 0.30 | 72.40 | 0.11 | 5.11 | 27.47 | 0.07 | 25.19 | 0.01 | −2.28 | 12.31 | 0.01 | 18.48 | 0.05 | 6.17 |
| 9 y 2 mo | 50.58 | 0.36 | 51.49 | 0.12 | 0.91 | 67.29 | 0.18 | 78.80 | 0.15 | 11.60 | 27.64 | 0.06 | 25.38 | 0.04 | −2.26 | 18.01 | 0.06 | 25.01 | 0.05 | 7.00 | |||
| Change | 2.95 | 3.34 | 0.00 | 6.40 | 0.17 | 0.19 | 5.70 | 6.53 | |||||||||||||||
| % change | 106.19% | 106.94% | 100% | 108.84% | 100.62% | 100.75% | 146.30% | 135.34% | |||||||||||||||
| 4 | IIA | Left | 6 y 0 mo | 46.70 | 0.69 | 47.93 | 0.01 | 1.23 | 60.14 | 0.08 | 68.00 | 0.11 | 7.86 | 26.88 | 0.09 | 24.05 | 0.01 | −2.83 | 17.18 | 0.02 | 29.61 | 0.03 | 12.43 |
| 8 y 10 mo | 48.11 | 0.11 | 49.88 | 0.54 | 1.77 | 60.94 | 0.37 | 72.58 | 0.01 | 11.64 | 27.03 | 0.08 | 24.44 | 0.08 | −2.59 | 26.63 | 0.03 | 30.43 | 0.03 | 3.80 | |||
| Change | 1.41 | 1.95 | 0.80 | 4.58 | 0.15 | 0.39 | 9.45 | 0.82 | |||||||||||||||
| % change | 103.02% | 104.07% | 101.33% | 106.74% | 100.56% | 101.62% | 155.01% | 102.77% | |||||||||||||||
| 5 | IIB | Right | 10 y 0 mo | 49.68 | 0.34 | 36.15 | 0.34 | −13.53 | 58.64 | 0.03 | 54.82 | 0.33 | −3.82 | 28.49 | 0.10 | 23.19 | 0.03 | −5.30 | 17.82 | 0.03 | 21.75 | 0.03 | 3.93 |
| 14 y 0 mo | 53.55 | 0.04 | 46.44 | 0.34 | −7.11 | 58.84 | 0.08 | 55.02 | 0.14 | −3.82 | 29.00 | 0.06 | 25.03 | 0.03 | −3.97 | 19.98 | 0.07 | 22.17 | 0.40 | 2.19 | |||
| Change | 3.87 | 10.29 | 0.20 | 0.20 | 0.51 | 1.84 | 2.16 | 0.42 | |||||||||||||||
| % change | 107.79% | 128.46% | 100.34% | 100.36% | 101.79% | 107.93% | 112.12% | 101.93% | |||||||||||||||
| 6 | IIB | Right | 12 y 1 mo | 51.23 | 0.09 | 38.94 | 0.30 | −12.29 | 64.11 | 0.02 | 60.72 | 0.03 | −3.39 | 27.65 | 0.13 | 22.59 | 0.15 | −5.06 | 19.06 | 0.44 | 20.77 | 0.06 | 1.71 |
| 13 y 8 mo | 53.06 | 0.49 | 42.33 | 0.58 | −10.73 | 64.29 | 0.45 | 61.08 | 0.15 | −3.21 | 28.46 | 0.25 | 22.88 | 0.35 | −5.58 | 21.30 | 0.28 | 22.09 | 0.01 | 0.79 | |||
| Change | 1.83 | 3.39 | 0.18 | 0.36 | 0.81 | 0.29 | 2.24 | 1.32 | |||||||||||||||
| % change | 103.57% | 108.71% | 100.28% | 100.59% | 102.93% | 101.28% | 111.75% | 106.36% | |||||||||||||||
The nasomaxillary length (height) as measured from the Frankfort horizontal plane to the tip of the maxillary first molar was always shorter on the affected side than on the contralateral control side in all 6 patients with HFM, and also it grew less than the control side in 5 of the 6 patients ( Fig 5 , Table V ). The occlusal plane became more inclined over time in 4 patients with HFM. One type I subject had more growth of nasomaxillary length (height) on the affected side than on the contralateral side, and the occlusal plane became flatter during this time.
| Patient | Skeletal type ∗ | Affected side | Age | Nasomaxillary length (mm) | Occlusal plane angle (°) | ||||||
|---|---|---|---|---|---|---|---|---|---|---|---|
| Affected side | SD | Control side | SD | Control-affected difference | SD | Control side | |||||
| 1 | I | Right | 12 y 6 mo | 40.45 | 0.03 | 42.10 | 0.02 | 1.65 | 1.38 | 0.02 | Right |
| 15 y 9 mo | 38.51 | 0.02 | 45.90 | 0.03 | 7.39 | 4.96 | 0.02 | Right | |||
| Change | −1.94 | 3.80 | 3.58 | ||||||||
| % Change | 95.20% | 109.03% | 359.42% | ||||||||
| 2 | I | Right | 12 y 10 mo | 32.45 | 0.03 | 38.51 | 0.01 | 6.06 | 6.79 | 0.01 | Right |
| 16 y 1 mo | 37.28 | 0.01 | 42.02 | 0.03 | 4.74 | 3.86 | 0.01 | Right | |||
| Change | 4.83 | 3.51 | −2.93 | ||||||||
| % Change | 114.88% | 109.11% | 56.85% | ||||||||
| 3 | IIA | Left | 4 y 10 mo | 30.81 | 0.01 | 31.75 | 0.01 | 0.94 | 3.05 | 0.01 | Left |
| 9 y 2 mo | 34.36 | 0.05 | 39.71 | 0.02 | 5.35 | 4.68 | 0.02 | Left | |||
| Change | 3.55 | 7.96 | 1.63 | ||||||||
| % Change | 111.52% | 125.07% | 153.44% | ||||||||
| 4 | IIA | Left | 6 y 0 mo | 31.17 | 0.04 | 34.72 | 0.02 | 3.55 | 4.14 | 0.02 | Left |
| 8 y 10 mo | 31.45 | 0.01 | 36.99 | 0.02 | 5.54 | 7.13 | 0.01 | Left | |||
| Change | 0.28 | 2.27 | 2.99 | ||||||||
| % Change | 100.90% | 106.54% | 172.22% | ||||||||
| 5 | IIB | Right | 10 y 0 mo | 32.81 | 0.54 | 37.62 | 0.01 | 4.81 | 9.01 | 0.11 | Right |
| 14 y 0 mo | 33.86 | 0.05 | 43.15 | 0.01 | 9.29 | 8.11 | 0.17 | Right | |||
| Change | 1.05 | 5.53 | −0.90 | ||||||||
| % Change | 103.20% | 114.70% | 90.01% | ||||||||
| 6 | IIB | Right | 12 y 1 mo | 35.48 | 0.33 | 41.01 | 0.01 | 5.53 | 6.23 | 0.01 | Right |
| 13 y 8 mo | 36.49 | 0.15 | 45.27 | 0.03 | 8.78 | 9.22 | 0.01 | Right | |||
| Change | 1.01 | 4.26 | 2.99 | ||||||||
| % Change | 102.85% | 110.39% | 147.99% | ||||||||
The length from the Frankfort horizontal plane to the gonial angle defined as the length of the ramus was always smaller on the affected side in all 6 patients ( Fig 6 , Table VI ). The change in the vertical growth rate of the ramus was less on the affected side in 5 of the 6 patients with HFM except for 1 type IIA patient. The condylar length was longer on the affected side than the contralateral control side in 5 subjects except for 1 type I subject, and it also grew at a slower rate on the affected side.
| Patient | Skeletal type ∗ | Affected side | Age | FH-gonial length (mm) | FH-condyle length (mm) | Corpus length (mm) | ||||||||||||
|---|---|---|---|---|---|---|---|---|---|---|---|---|---|---|---|---|---|---|
| Affected side | SD | Control side | SD | Control-affected difference | Affected side | SD | Control side | SD | Control-affected difference | Affected side | SD | Control side | SD | Control-affected difference | ||||
| 1 | I | Right | 12 y 6 mo | 50.16 | 0.12 | 54.46 | 1.38 | 4.30 | 4.76 | 0.01 | 4.04 | 0.01 | 0.72 | 65.81 | 4.87 | 68.49 | 0.72 | 2.68 |
| 15 y 9 mo | 56.91 | 0.04 | 66.04 | 0.40 | 9.13 | 6.66 | 0.32 | 8.39 | 0.11 | 1.73 | 67.39 | 1.51 | 76.43 | 0.09 | 9.04 | |||
| Change | 6.75 | 11.58 | 1.90 | 4.35 | 1.58 | 7.94 | ||||||||||||
| % Change | 113.50% | 121.30% | 139.90% | 207.70% | 102.40% | 111.60% | ||||||||||||
| 2 | I | Right | 12 y 10 mo | 43.35 | 0.14 | 51.94 | 0.47 | 8.59 | 6.68 | 0.04 | 3.46 | 0.31 | 3.22 | 68.09 | 0.30 | 69.19 | 0.40 | 1.10 |
| 16 y 1 mo | 47.96 | 0.02 | 57.84 | 0.46 | 9.88 | 7.93 | 0.40 | 7.03 | 0.05 | 0.90 | 73.14 | 1.53 | 74.49 | 0.65 | 1.35 | |||
| Change | 4.61 | 5.90 | 1.25 | 3.57 | 5.05 | 5.30 | ||||||||||||
| % Change | 110.63% | 111.36% | 118.71% | 203.18% | 107.42% | 107.66% | ||||||||||||
| 3 | IIA | Left | 4 y 10 mo | 35.48 | 0.69 | 43.75 | 0.34 | 8.27 | 6.18 | 0.16 | 3.08 | 0.12 | 3.10 | 41.50 | 0.76 | 38.72 | 0.18 | −2.78 |
| 9 y 2 mo | 42.62 | 1.00 | 53.05 | 0.28 | 10.43 | 7.38 | 0.15 | 3.66 | 0.15 | 3.72 | 67.83 | 2.01 | 64.89 | 0.04 | −2.94 | |||
| Change | 7.14 | 9.30 | 1.20 | 0.58 | 26.33 | 26.17 | ||||||||||||
| % Change | 120.12% | 121.30% | 119.42% | 118.83% | 163.45% | 167.59% | ||||||||||||
| 4 | IIA | Left | 6 y 0 mo | 40.47 | 0.24 | 48.07 | 0.30 | 7.60 | 7.52 | 0.11 | 1.16 | 0.23 | 6.36 | 57.91 | 0.28 | 57.19 | 0.19 | −0.72 |
| 8 y 10 mo | 43.28 | 0.11 | 49.35 | 0.10 | 6.07 | 2.59 | 0.03 | 0.72 | 0.23 | 1.87 | 60.56 | 0.04 | 60.07 | 0.05 | −0.49 | |||
| Change | 2.81 | 1.28 | −4.93 | −0.44 | 2.65 | 2.88 | ||||||||||||
| % Change | 106.94% | 102.66% | 34.44% | 62.07% | 104.58% | 105.04% | ||||||||||||
| 5 | IIB | Right | 10 y 0 mo | 37.88 | 1.47 | 44.73 | 0.26 | 6.85 | 15.93 | 0.24 | 3.51 | 0.44 | 12.41 | 48.18 | 0.10 | 52.34 | 0.26 | 4.16 |
| 14 y 0 mo | 32.73 | 1.03 | 47.19 | 0.03 | 14.46 | 12.40 | 0.10 | 2.98 | 0.08 | 9.42 | 58.53 | 0.13 | 58.88 | 0.24 | 0.35 | |||
| Change | −5.15 | 2.46 | −3.53 | −0.53 | 10.35 | 6.54 | ||||||||||||
| % Change | 86.40% | 105.50% | 77.84% | 84.90% | 121.48% | 112.50% | ||||||||||||
| 6 | IIB | Right | 12 y 1 mo | 46.22 | 0.01 | 55.88 | 0.57 | 9.66 | 13.29 | 0.35 | 2.61 | 0.47 | 10.68 | 45.73 | 0.33 | 55.27 | 0.33 | 9.54 |
| 13 y 8 mo | 40.67 | 0.94 | 59.28 | 0.46 | 18.61 | 9.11 | 0.56 | 1.99 | 0.06 | 7.12 | 47.22 | 0.03 | 65.06 | 0.43 | 17.84 | |||
| Change | −5.55 | 3.40 | −4.18 | −0.62 | 1.49 | 9.79 | ||||||||||||
| % Change | 87.99% | 106.08% | 69.01% | 76.25% | 103.26% | 117.71% | ||||||||||||
Stay updated, free dental videos. Join our Telegram channel
VIDEdental - Online dental courses


