Introduction
Bone-anchored maxillary protraction has been shown to be an effective treatment modality for the correction of Class III malocclusions. The purpose of this study was to evaluate 3-dimensional changes in the maxilla, the surrounding hard and soft tissues, and the circummaxillary sutures after bone-anchored maxillary protraction treatment.
Methods
Twenty-five consecutive skeletal Class III patients between the ages of 9 and 13 years (mean, 11.10 ± 1.1 years) were treated with Class III intermaxillary elastics and bilateral miniplates (2 in the infrazygomatic crests of the maxilla and 2 in the anterior mandible). Cone-beam computed tomographs were taken before initial loading and 1 year out. Three-dimensional models were generated from the tomographs, registered on the anterior cranial base, superimposed, and analyzed by using color maps.
Results
The maxilla showed a mean forward displacement of 3.7 mm, and the zygomas and the maxillary incisors came forward 3.7 and 4.3 mm, respectively.
Conclusions
This treatment approach produced significant orthopedic changes in the maxilla and the zygomas in growing Class III patients.
Maxillary hypoplasia is frequently found in patients with Class III malocclusion. Conventional treatments involve the use of a protraction facemask to advance the maxilla. However, such appliances often have unwanted side effects including maxillary incisor proclination and clockwise rotation of the mandible. New treatment methods with skeletal anchorage in the maxillary buttress have been developed to minimize dentoalveolar compensations. These protocols, however, still need a facemask. De Clerck et al suggested the use of Class III elastics between miniplate skeletal anchorage in both jaws (bone-anchored maxillary protraction). Preliminary studies based on conventional 2-dimensional (2D) cephalometric data after active therapy show significantly favorable results from bone-anchored maxillary protraction compared with control and facemask groups.
The precise response to protraction of the maxilla with bone-anchored maxillary protraction, including remodeling and adaptation of the adjacent bones, sutures, and soft tissues, has yet to be clarified. Furthermore, the envelope of correction that is possible with bone-anchored maxillary protraction needs to be established. These morphologic changes and their clinical relevance cannot be well addressed with 2D imaging methods alone. Advances in 3-dimensional (3D) imaging of facial structures provide an alternative tool to analyze skeletal changes. The development and validation of a method for 3D longitudinal assessments by using surface registration on the anterior cranial base as a reference could identify the location and nature of the orthopedic effects after bone-anchored maxillary protraction.
In a pilot study on 3D assessments of treatment outcomes of bone-anchored maxillary protraction, Heymann et al reported marked variability in responses to the therapy. Our study expands these preliminary 3D findings to a larger sample, to evaluate overall facial changes relative to the cranial base at the end of active treatment with bone-anchored maxillary protraction. The purpose of this study was to evaluate in 3 dimensions the growth and treatment effects of the bone-anchored maxillary protraction protocol on the maxillary dentition, the midface, and the adjacent soft tissues of consecutively treated patients.
Material and methods
This prospective sample consisted of 25 consecutively treated patients (13 girls, 12 boys) with dentoskeletal Class III malocclusion. All patients were treated by 2 operators (H.D.C. and M.A.C.) with the bone-anchored maxillary protraction technique.
At the initial observation (T1), all patients had Class III malocclusion in the mixed or permanent dentition characterized by a Wits appraisal of −1 mm or less (mean, −4.8 ± 2.8 mm), anterior crossbite or incisor end-to-end relationship, and Class III molar relationship. All patients were of white ancestry, with a prepubertal stage of skeletal maturity according to the cervical vertebral maturation method (CS1-CS3). Twenty-one of the 25 patients were still prepubertal at the end of treatment (T2), and 4 patients were at CS4. The mean ages for the bone-anchored maxillary protraction sample were 11.9 ± 1.8 years at T1 and 13.1 ± 1.7 years at T2. The mean duration of the T1 to T2 interval was 1.2 ± 1.0 years. Institutional review board approval for the study was obtained from the University of North Carolina.
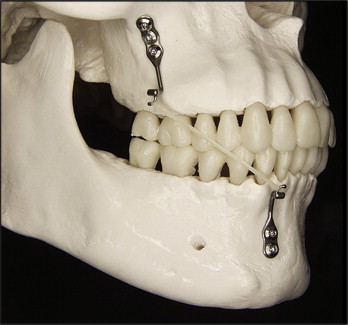
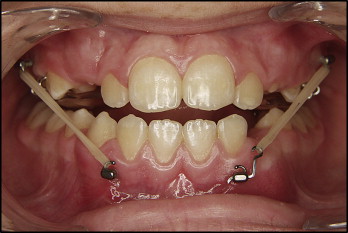
Each patient had miniplates placed on the left and right infrazygomatic crests of the maxillary buttress and between the mandibular left and right lateral incisors and canine ( Fig 1 ). Small mucoperiosteal flaps were elevated, and the modified miniplates (Bollard, Tita-Link, Brussels, Belgium) were secured to the bone by 2 (mandiblular) or 3 (maxillary) screws (diameter, 2.3 mm; length, 5 mm). The extensions of the plates perforated the attached gingiva near the mucogingival junction ( Fig 2 ). Three weeks after surgery, the miniplates were loaded. Class III elastics applied an initial force of 100 g on each side, increased to 150 g after 1 month of traction and to 250 g after 3 months. The patients were asked to replace the elastics at least once a day and to wear those 24 hours per day. In 14 patients, after 2 to 3 months of intermaxillary traction, a removable bite plate was inserted in the maxillary arch to eliminate occlusal interference.
Cone-beam computed tomography (CBCT) scans were taken at T1 and T2 by using an iCat machine (Imaging Sciences International, Hatfield, Pa) with a 16 × 22-cm field of view. Virtual 3D surface models were constructed from the CBCT images with a voxel dimension of 0.5 × 0.5 × 0.5 mm. Construction of 3D surface models of the anatomic structures of interest and the 3D graphic renderings were done by using the ITK-SNAP (open-source software; www.itksnap.org ).
The T1 and T2 images were registered by using the anterior cranial fossa as a reference. A fully automated voxel-wise rigid registration method was performed with IMAGINE (open-source software; http://www.ia.unc.edu/dev/download/imagine/index.htm ). This method, developed by Cevidanes et al, masks anatomic structures altered by treatment or growth to prevent observer-dependent reliance on subjectively defined anatomic landmarks. In this study, the initial and final 3D models were registered on anterior cranial fossa structures, specifically the endocranial surfaces of the cribiform plate region of the ethmoid bone and the frontal bone. These regions were chosen because of their early completion of growth. The software compares 2 images by using the intensity gray scale for each voxel of the T1 and T2 images.
After the registration step, all reoriented virtual models were superimposed to quantitatively evaluate the greatest surface displacement by using the CMF application software (developed at the M. E. Müller Institute for Surgical Technology and Biomechanics, University of Bern, Bern, Switzerland, under the funding of the Co-Me network; http://co-me.ch ). This tool calculates thousands of color-coded point-to-point comparisons (surface distances in millimeters) between the 3D models, so that the difference between 2 surfaces at any location can be quantified.
For quantitative assessment of the changes between the 3D surface models, the isoline tool allows the user to define a surface-distance value to be expressed as a contour line (isoline) that corresponds to regions having a surface distance equal to or greater than the defined value. The isoline tool was used to quantitatively measure the greatest displacements between points in the 3D surface models for the maxillary incisors, the maxilla, the right and left zygomas, the upper lip, and the soft-tissue nose ( Fig 3 ). Positive values indicated anterior displacement, and negative values posterior displacement. For the maxillary incisor, the maximum surface distance was measured at the incisor’s most labial surface. The maxillary region was defined as the anterior surface of the maxilla between the canines. The right and left zygomas were defined as the surfaces adjacent and superior to the bone anchors. The soft-tissue nose region was defined as the tip of the nose. The upper lip was defined as the area below the nose between the lip commissures.
Statistical analysis
The largest displacements between T1 and T2 were computed at each anatomic region of interest. The error of the method as determined in previous studies showed excellent reliability. Descriptive statistics were used to describe the sample percentiles, means, standard deviations, and ranges. Pearson correlation coefficients were used to assess the associations between changes at each anatomic region. The levels of significance were set at 0.05 for P values and 0.5 for r values.
Results
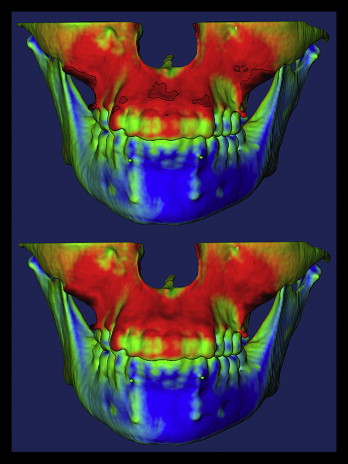
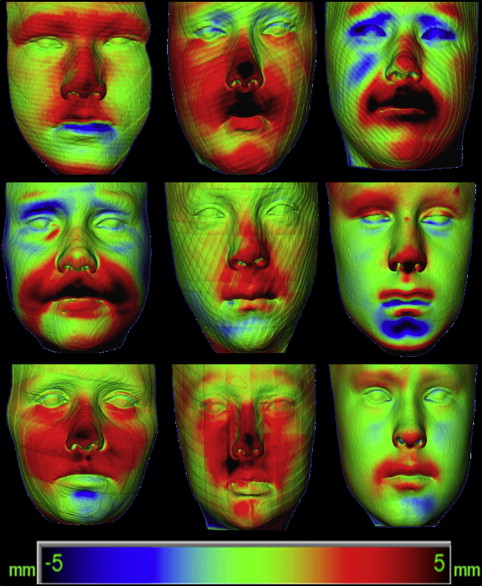
Table I summarizes the descriptive statistics for the skeletal and soft-tissue changes observed from T1 to T2 for the 25 consecutively treated bone-anchored maxillary protraction patients. The maxilla showed a mean displacement of 3.73 mm, whereas the maxillary incisors and the right and left zygomas advanced 4.27, 3.60, and 3.76 mm, respectively. Although all subjects had anterior displacements of the skeletal and dental structures of interest, there were considerable variations in the magnitudes ( Fig 4 ). Skeletal changes between T1 and T2 are displayed as color maps or semitransparencies ( Figs 5 and 6 ).
| Maxillary incisor | Maxilla | Right zygoma | Left zygoma | Soft-tissue upper lip | Soft-tissue nose | |
|---|---|---|---|---|---|---|
| Mean and SD | 4.27 ± 1.66 | 3.73 ± 1.66 | 3.60 ± 1.32 | 3.76 ± 1.53 | 3.98 ± 1.82 | 3.82 ± 1.36 |
| Range | 1.65-8.50 | 1.45-8.5 | 1.58-6.86 | 1.35-7.81 | 0.33-9.32 | 1.01-6.36 |
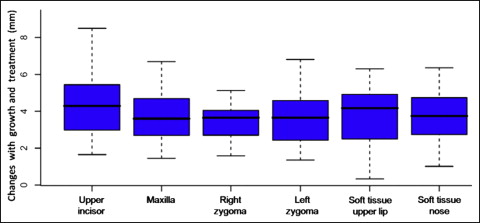

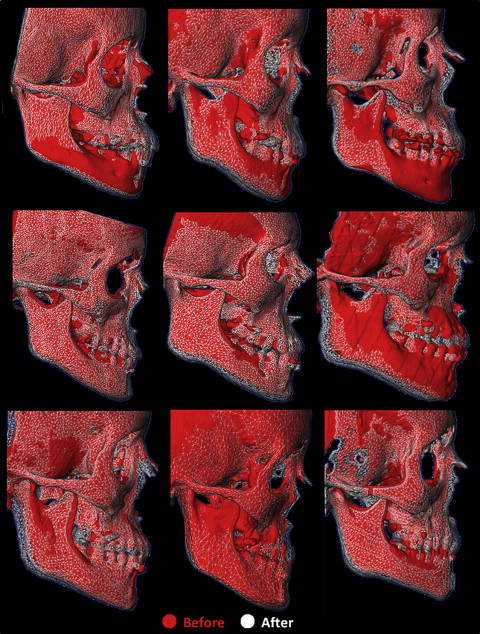
The soft-tissue upper lip advanced 3.98 mm, and the nose translated forward 3.82 mm. Soft-tissue displacements also showed a wide range of variations. A color map and mesh superimpositions showing these changes between T1 and T2 for 9 subjects are given in Figures 7 and 8 , respectively.
Pearson analysis showed significant correlations between the displacement of the maxillary incisors, the maxilla, the zygomas, and the soft-tissue upper lip ( Table II ). There was a significant correlation among the regions except for the soft-tissue nose with the left and right zygomas.


