When statistical comparisons of clinical orthodontic trials evaluate 2 or more therapies, tests are reported with corresponding P values, which indicate significance or nonsignificance. But what is a P value and the associated statistically significant or nonsignificant result? A P value has a range from 0 to 1, and it is the probability of observing the result found from our study or a more extreme one when the null hypothesis (H 0 ) is true.
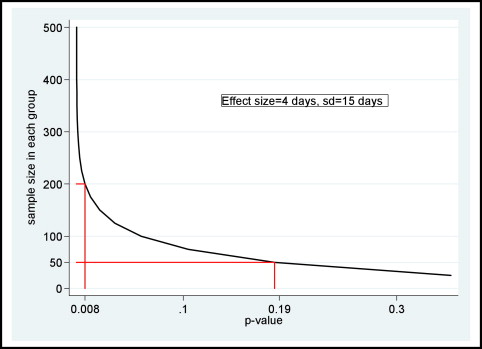
Let us use an example with 2 hypothetical scenarios to better understand the meaning of the P value. We are conducting 2 similar clinical trials to compare the time to align mandibular incisors using 2 bracket systems. The Table shows the details and results of those 2 hypothetical trials, which differ only in the number of patients they have included (either 200 or 50 patients per treatment arm). The H 0 states that there is no difference in treatment duration between the 2 bracket systems, and the alternative hypothesis is that there is a difference. The Table shows that in both hypothetical scenarios the difference in treatment duration is 4 days; however, the P value in the first case is low ( P = 0.008) and significant; in the second scenario, it is not significant ( P = 0.19).
| Bracket A Mean (SD) |
Bracket B Mean (SD) |
Mean difference (95% CI) |
P value | |
|---|---|---|---|---|
| Large-sample-size scenario (n = 200) | ||||
| Days to alignment | 100 (15) | 104 (15) | 4 (1, 7) | 0.008 |
| Small-sample-size scenario (n = 50) | ||||
| Days to alignment | 100 (15) | 104 (15) | 4 (−2, 10) | 0.19 |
A P value of 0.008 indicates that the probability of observing a 4-day difference in treatment duration between the 2 bracket systems, when in reality no difference exists (H 0 is true), is very low (8 in 1000). Therefore, this difference is unlikely to be due to chance alone; thus, we reject the Ho. A P value of 0.19 indicates that the probability of observing a 4-day difference in treatment duration between the 2 bracket systems, when in reality no difference exists (H 0 is true), is rather high (about 20%), and therefore we accept the H 0 . The clinician wants to know which bracket system will align the mandibular incisors faster. The answer depends on how you interpret the findings and what information you use for the interpretation. If you look at the difference in the number of days to reach alignment between the 2 bracket systems, you will probably say for both scenarios (200 or 50 patients per group) that there is no difference that has clinical importance between the 2 systems. If you focus your interpretation on the P values in the first scenario ( P = 0.008), you might claim that bracket A is superior to bracket B in terms of time to align the mandibular incisors. If you look at the second scenario ( P = 0.19), you are likely to say that there is no difference between the 2 bracket systems. Relying only on the P value of the trial results, we would conclude that bracket system A is superior to bracket system B. However, by reporting the actual difference in days (4 days) and the 95% confidence intervals (1 and 7 days), the reader’s interpretation of the significance of the results would be quite different.
But why do we see a difference in the P values between the 2 scenarios? To understand this, we must realize that P values are sensitive to sample size and the standard deviation. As the sample size increases and the standard deviation decreases, the P value becomes smaller for the same mean difference of 4 days. The Figure shows the effect of the sample size on the P value. A P value, although it might indicate a statistically significant result, provides no insight into the clinical relevance. Therefore, even small differences of no clinical importance can appear important if we have a large enough sample size, if we only look at the P value, and if we erroneously associate a small P value with a large size of effect.


