Introduction
The purposes of this study were to characterize enamel surfaces treated with sandblasting, acid etching, or sandblasting followed by acid etching for bonding of orthodontic adhesives and to evaluate the enamel-adhesive interfaces.
Methods
Buccal premolar surfaces were sandblasted, acid etched, sandblasted and subsequently acid etched, or left intact. For 2 treatments (acid etching and sandblasting plus acid etching), orthodontic brackets were bonded for resin infiltration assessment. Surface roughness and enamel loss were evaluated by optical profilometry, and surface morphology and elemental composition were examined by low-vacuum scanning electron microscope/energy dispersive x-ray analysis, whereas interfacial resin infiltration was assessed by high-vacuum scanning electron microscopy. Differences were statistically analyzed by 1-way analysis of variance and Tukey-Kramer multiple comparison tests or t tests (α = 0.05).
Results
The sandblasted and sandblasted-plus-acid-etched groups showed higher surface roughness values than the acid-etched group. Sandblasting plus acid etching removed more enamel than did sandblasting or acid etching alone. Sandblasting plus acid etching demonstrated a more uniform type I etching pattern, without alumina particles implanted in the enamel, unlike sandblasting. No difference was found in the extent of resin infiltration between the bonded acid-etched and sandblasted-plus-acid-etched groups, although the latter showed improved infiltration characteristics.
Conclusions
Sandblasting-plus-acid-etching treatment creates a rough enamel surface, typical of type I etching, with the greatest extent of enamel loss, free of alumina interferences, demonstrating the same extent of resin infiltration as acid etching, but exhibiting improved infiltration quality.
Highlights
- •
We examined surface properties of enamel after alumina sandblasting and acid etching.
- •
Sandblasting causes a significant loss of enamel and an increase in roughness.
- •
It does not increase resin infiltration but improves interfacial characteristics.
Acid-etch bonding technology, initially introduced by Buonocore in 1955, has significantly changed clinical practice in all areas of dentistry, including orthodontics. Acid dissolution of the enamel surface creates microporosities, thereby increasing the surface area available for bonding and simultaneously the surface energy because of greater exposure of bulk enamel relative to surface enamel; the latter may also be susceptible to adsorption of intraoral impurities. This substrate is subsequently infiltrated with orthodontic bonding resins.
Intraoral sandblasting with alumina particles was first described in 1945 by Black. This technique increases the surface area and has been proven to augment the adhesive strength of bonded brackets to restorative materials such as amalgam, metals, composites, and ceramics. The question of whether sandblasting an enamel surface before or instead of etching it would enhance bonding properties is discussed in the literature, but the pertinent investigations are inconclusive. Some authors claim that no improvement in bonding strength is obtained with sandblasting before etching, whereas others observed a tendency for increased bond strength but without statistical significance. Conversely, various investigations showed significant improvement of bond strength with sandblasting before etching, but some of them questioned the relevance of their findings. It is known and well documented in the orthodontic literature that bracket bonding to prismless and hypermineralized enamel is problematic, and sandblasting has been suggested as a reliable method to increase the adhesive strength.
Most of the tests performed to validate the contribution of sandblasting were limited to shear bond strength tests or juxtapositions of adhesive remnant index scores. However, the alteration of enamel surface properties after sandblasting has received scant attention in scientific reports. Moreover, the resin infiltration capacity of sandblasted and acid-etched surfaces has not been assessed.
The aim of this study was therefore to determine the surface properties of enamel treated with sandblasting or acid etching and the characteristics of such surfaces after bonding of an orthodontic adhesive. The null hypotheses tested were that there are no differences in surface roughness, enamel loss, and extent of infiltration among the groups.
Material and methods
Thirty sound premolars extracted for orthodontic reasons were rinsed with water. The tooth crowns were cleaned with a fluoride-free pumice and a rubber cap at low speed and stored for an undefined period of time in 0.1% thymol solution at 8°C. The teeth were divided into 6 groups (n = 5), as described in Table I .
| Group | Surface treatment |
|---|---|
| IE | Intact enamel |
| SB | Sandblasted |
| AE | Acid etched |
| SBAE | Sandblasted and acid etched |
| AEB | Acid etched and bonded |
| SBAEB | Sandblasted, acid etched, and bonded |
Only the buccal surfaces of the teeth were studied. The group with enamel left intact (IE) received no further treatment. In the sandblasted (SB), acid-etched (AE), and sandblasted-and-acid-etched (SBAE) groups, half the buccal tooth surfaces were covered with aluminum foil placed at an incisal-cervical direction and burnished on the surface, thus preserving the integrity of the covered enamel. Sandblasting was performed with 50-μm alumina particles (Renfert Cobra Aluoxyd, Hilzingen, Germany) using an intraoral microetcher (model IIA; Danville Materials, San Ramon, Calif) with a 1.2-mm nozzle diameter operated at 2.5-bar pressure, 5-mm distance, and 5-second exposure. The treated surfaces were then rinsed with water for 30 seconds and air dried for 10 seconds with oil-free compressed air. Acid etching was performed with 35% phosphoric acid gel (Ultra-etch; Ultradent Products, South Jordan, Utah) applied for 30 seconds and subsequently rinsed with water and air dried as before. After the treatments, the aluminum foil was removed, and the entire buccal surface of each tooth was rinsed with water and air-dried again.
For the bonded groups of specimens—acid etched and bonded (AEB) and sandblasted, acid etched, and bonded (SBAEB)—the buccal enamel surfaces were treated accordingly, and metallic brackets (Mini Diamond Twin; Ormco, Orange, Calif) were bonded to the pretreated surfaces with a light-cured primer (Transbond XT primer; 3M Unitek, Monrovia, Calif) and a light-cured adhesive (Transbond XT paste; 3M Unitek). The primer was applied with a microbrush (Microbrush International, Grafton, Wis) and light-cured for 10 seconds, whereas the adhesive was irradiated for 20 seconds (10 seconds from the incisal and 10 seconds from the cervical directions). Light-curing was performed with a light-emitting diode unit (mini LED ortho 2; Acteon, Merignac, France), emitting 3000 mW per square centimeter of light intensity.
The surface analyses were done with optical profilometry. The surface roughness of each group (IE, SB, AE, and SBAE) was examined at 5 regions per specimen with an optical interferometric profiler (Wyko NT1100; Veeco, Tucson, Ariz) operated under the following conditions: Mirau 20-times objective lens, 2-times field-of-view lens, vertical scanning mode, 20-μm vertical scan length, 113 × 148.5-μm analysis area (41.6 times total magnification), cylinder/tilt corrections, with 0.1-nm (z-axis) and 0.2-μm (x-axis and y-axis) resolutions. The surface roughness parameters measured were the amplitude parameters of the arithmetic average of the absolute values of the surface height deviations measured from the best fitting plane (S a ); the standard deviation of the height distribution (S q ); the 10-point height over the surface, representing the average difference between the 5 highest peaks and 5 lowest valleys (S z ); the hybrid parameter, developed interfacial area ratio, the developed area due to the surface texture vs an ideal plane area ratio (S dr ); and the functional parameter, core fluid retention index, describing the volume that a surface would support from 5% to 80% of the bearing ratio in relation to S q (S ci ).
Enamel loss during these treatments was evaluated by recording 3 line profiles per specimen at the intact enamel–treated enamel interface to measure the vertical difference between the untreated and treated regions. The acquisition parameters were as before but at 5 times magnification and a 231.1 × 303.8-μm analysis area. The line profiles were smoothed with negative exponential functions (Sigma Plot version 12; Sysstat, San Jose, Calif).
The enamel morphology of groups IE, SB, AE, and SBAE were investigated using a scanning electron microscope (Quanta 200; FEI, Hillsboro, Ore) operated under the following conditions: 1 torr chamber pressure (low vacuum), 20 kV accelerating voltage, 110-μA beam current, a large field detector for secondary electron imaging, and a solid-state backscattered electron detector for atomic number contrast imaging at 1600-times nominal magnification.
The elemental composition of the treated surfaces was investigated using x-ray energy dispersive spectroscopic analysis. Three spectra per specimen were collected using an XFlash 6|10 silicon drift detector (Bruker, Berlin, Germany) with a slew window under the same operating conditions: a 160 × 160-μm sampling window and a 200-second acquisition time. The quantification was carried out in a standardless mode using atomic number, absorbance, and fluorescence correction factors with the dedicated software (ESPRIT version 1.9; Bruker). Elemental mapping for the distributions of calcium, phosphorus, magnesium, oxygen, and aluminum was performed using a 79 × 68-μm sampling window.
For interfacial analysis, the bonded specimens were treated in the following manner. The teeth with bonded brackets (groups AEB and SBAEB) were embedded in epoxy resin (Caldofix; Struers, Ballerup, Denmark), longitudinally sectioned with a low-speed diamond disk in a microtome (Isomet; Buehler, Lake Bluff, Ill), ground in a grinding/polishing machine (Ecomet III; Buehler) with silicon carbide papers up to 4000 grit size under continuous water cooling, and finally polished with 9-μm diamond paste (Struers) and silica oxide polishing suspension (Struers). The bracket-enamel interfaces of the specimens were subsequently etched for 10 seconds with a 37% phosphoric acid solution to remove polishing smears, rinsed with distilled water, and vacuum coated with a thin layer of conductive carbon in a sputtering unit (SCD 004 sputter coater with OCD 30 unit; Bal-Tec, Vaduz, Liechtenstein). The sections were imaged in the scanning electron microscope under the following conditions: 10 −6 torr chamber pressure (high vacuum), 20 kV accelerating voltage, 98-μA beam current, solid-state backscattered detector for atomic number contrast imaging, and 2400 times nominal magnification. The thickness of the resin infiltrated zone was measured at 3 locations with 5 measurements per location. Measurements were performed with XT-DOCU software (version 3.2; Soft Imaging System GmbH, FEI, Hillsboro, Ore).
Statistical analysis
The roughness parameters, the thickness of the enamel zone removed, and the elemental composition of all surface-treated groups (IE, AE, SB, SBAE) were statistically analyzed by 1-way analysis of variance and the Tukey-Kramer multiple comparison test at a 95% significance level (α = 0.05).
The thickness of the resin-infiltrated enamel zone between the bonded groups, AEB and SBAEB, was statistically analyzed with an unpaired t test at a 95% significance level (α = 0.05).
Results
Figure 1 illustrates the 3-dimensional (3D) profilometric images of the enamel surfaces subjected to the surface treatments. Mean values and standard deviations of the roughness parameters tested are shown in Table II . The SB and SBAE groups demonstrated the highest amplitudes (S a , S q , S z ) and hybrid (S dr ) parameter values, followed by the AE and IE groups, with all differences statistically significant ( P < 0.05). The SB group showed significantly higher S a and S q values and lower S dr values than did the SBAE group ( P < 0.05). The functional parameter S ci showed statistically significant differences between all groups, except between IE and SB, and between SB and SBAE.
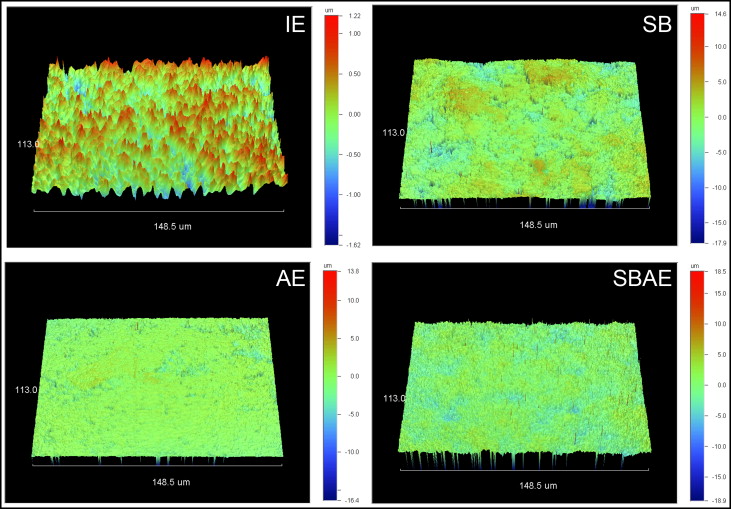
| Group | S a (nm) | S q (nm) | S z (nm) | S dr (%) | S ci |
|---|---|---|---|---|---|
| IE | 232 ± 19 a | 312 ± 21 a | 2121 ± 132 a | 6 ± 2 a | 1.45 ± 0.02 a |
| SB | 1367 ± 92 b | 1587 ± 99 b | 12150 ± 1413 b | 310 ± 19 b | 1.39 ± 0.06 a,b |
| AE | 513 ± 66 c | 801 ± 110 c | 9112 ± 1832 c | 146 ± 29 c | 0.92 ± 0.14 c |
| SBAE | 1094 ± 55 d | 1392 ± 56 d | 13108 ± 1094 b | 423 ± 59 d | 1.28 ± 0.02 b |
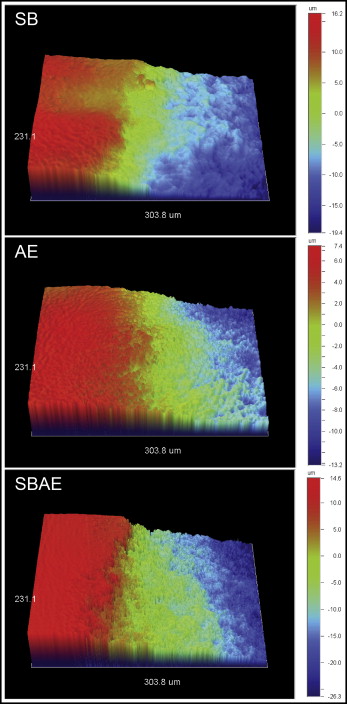
Figure 2 shows the 3D profilometric images of the interface between intact and treated enamel. All treated regions demonstrated enamel tissue loss. Representative normalized line profiles for calculation of the maximum depth of enamel loss are shown in Figure 3 . The results of maximum enamel loss are presented in Table III . The SBAE group had the highest enamel loss, followed by the SB and AE groups. All differences were statistically significant ( P < 0.05).
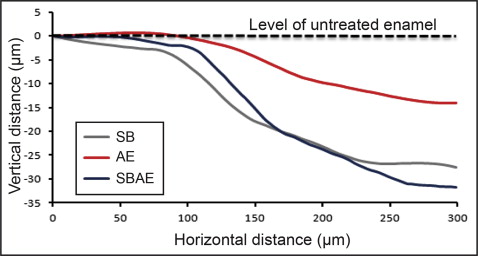
| Group | Enamel loss (μm) |
|---|---|
| SB | 26 ± 5 a |
| AE | 15 ± 4 b |
| SBAE | 32 ± 4 c |
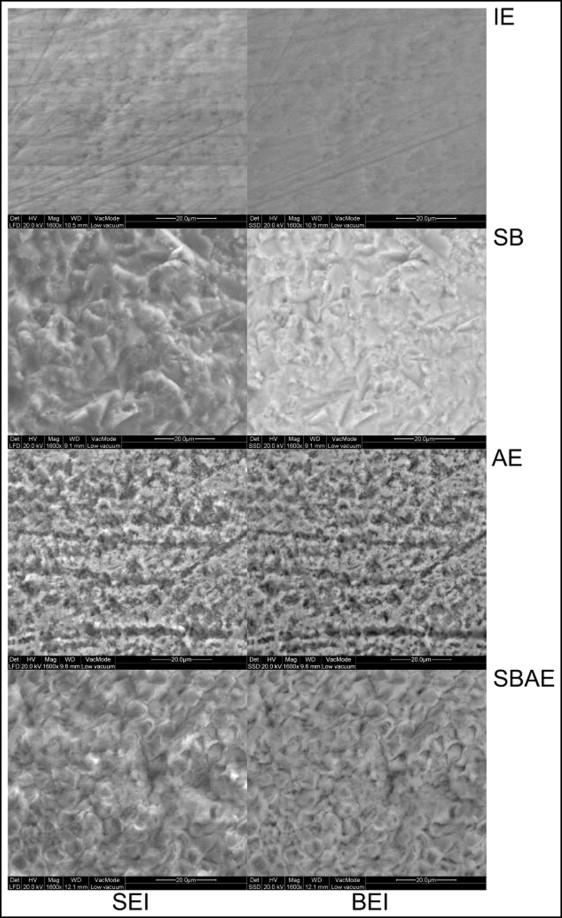
Figure 4 illustrates the secondary electron and the corresponding backscattered electron images of the enamel treatments tested. Intact enamel demonstrated several irregularities (pits, scratches, prismatic boundaries). On the sandblasted treated enamel, characteristic deep, irregular, and sharp pits and fissures from the peening action of the alumina particles were identified, along with some granular material attached to the surface. The surface morphology left was completely different from the IE group. In the AE group, an irregular acid-etching pattern was observed, with randomly distributed regions lacking porosity. The surface still retained intact enamel characteristics, such as the scratches. After sandblasting plus acid etching treatment, a typical type I etching pattern was identified, with protruding enamel prism boundaries and dissolved core structures. The surface texture left was uniform, without any characteristics of the native structures (intact or sandblasted), because of the additional acid-etching step.
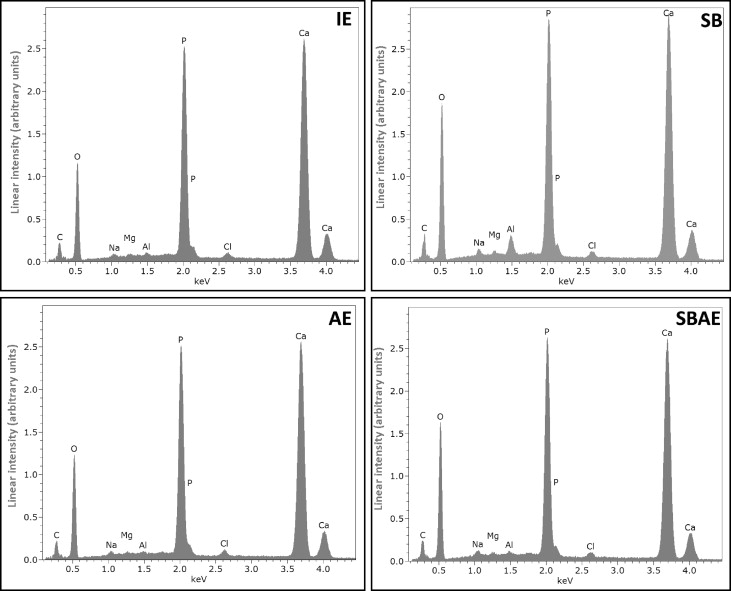
Representative energy dispersive x-ray spectra from the enamel groups tested are presented in Figure 5 . The quantitative results of energy dispersive x-ray analysis are given in Table IV . The elements identified in all groups were carbon, oxygen, sodium, magnesium, aluminum, phosphorus, chlorine, and calcium. Because of the low accuracy of energy dispersive x-rays in carbon quantification, this element was excluded from the quantitative analysis. The aluminum and oxygen contents in the SB group were significantly higher than the other groups, probably because of the retention of alumina particles on the enamel surface. These particles, though, were removed after acid etching (SBAE group), resulting in no statistically significant difference from the IE and AE groups. The mean percentage atomic ratios of calcium/phosphorus were calculated as 1.75 (IE), 1.61 (SB), 1.69 (AE), and 1.62 (SBAE).
| Element | IE | SB | AE | SBAE |
|---|---|---|---|---|
| Oxygen | 41.5 ± 1.5 a | 51.2 ± 0.7 b | 46.5 ± 1.6 c | 52.4 ± 1.7 b |
| Sodium | 0.6 ± 0.1 a | 1.0 ± 0.1 b | 0.7 ± 0.0 c | 1.0 ± 0.1 b |
| Magnesium | 0.2 ± 0.1 a | 0.4 ± 0.0 b | 0.3 ± 0.0 a,c | 0.3 ± 0.0 c |
| Aluminum | 0.2 ± 0.1 a | 1.2 ± 0.1 b | 0.2 ± 0.0 a | 0.3 ± 0.0 a |
| Phosphorus | 14.7 ± 0.2 a | 12.4 ± 0.2 b | 14.9 ± 0.0 a | 13.3 ± 0.4 b |
| Chlorine | 0.4 ± 0.0 a,c | 0.4 ± 0.0 a | 0.5 ± 0.0 c | 0.4 ± 0.0 a |
| Calcium | 33.4 ± 1.5 a | 29.0 ± 0.6 b,c | 33.2 ± 0.1 a,c | 31.8 ± 0.8 a,c |
Stay updated, free dental videos. Join our Telegram channel
VIDEdental - Online dental courses


