Introduction
In this retrospective longitudinal study, we aimed to study differences in the soft-tissue profiles in growing children with clefts in comparison with controls through the period of facial growth from 7 to 18 years.
Methods
Lateral cephalometric measurements made at 7 years (T1), 11.1 years (T2), and 17.9 years (T3) of age of 70 white children (35 boys, 35 girls) with complete unilateral cleft lip and palate (UCLP) who received primary lip and palate repair surgeries at The Hospital for Sick Children, Toronto, were compared with those of a control group of similar ages, sexes, and racial backgrounds, and having skeletal Class I facial growth, selected from the Burlington Growth Study. None of the included subjects had received any surgeries other than the primary lip and palate repairs, and none had undergone nasal septum surgery or nasal molding during infancy. Between-group comparisons were made at each time point using generalized linear models adjusted for age and sex effects. Longitudinal comparisons across all time points were conducted using the mixed model approach, adjusting for these effects and their interactions with time.
Results
Bimaxillary retrognathism, progressive maxillary retrognathism, and increasing lower anterior face height with downward and backward growth rotation of the mandible in the UCLP group were seen. Unlike the hard-tissue face height ratio, their soft-tissue face height ratio was not affected. The upper lips in the UCLP group were shorter by 1.81 mm at T2 ( P <0.001) and by 1.16 mm at T3 ( P = 0.018), whereas their lower lips were 2.21 mm longer at T3 ( P = 0.003). A reduced upper lip to lower lip length ratio at T2 and T3 ( P <0.001) resulted. Their upper lips were relatively retruded by 1.44 mm at T1, 1.66 mm at T2, and 1.86 mm at T3 (all, P <0.001), and their lower lips were relatively protruded by 1.07 mm at T1 ( P = 0.003), 1.40 mm at T2 ( P <0.001), and 1.62 mm at T3 ( P <0.001). Nose depths in the UCLP group were shallower by at least 1 mm from T1 to T3, and columellar length was shorter by almost 2 mm (all, P <0.001). Their columellae and nose tips rotated downward with growth, with the most significant rotations experienced from T2 to T3, and progressive reductions in their soft-tissue profile convexity were seen from T1 to T3 ( P <0.001).
Conclusions
Key attributes of the imbalance in the soft-tissue profile in children with repaired UCLP were identified in the lip and nose regions. Although many profile differences were visible as early as 7 years of age, they became more apparent by 11 years of age and increased in severity thereafter. The short upper lip combined with a long lower lip resulted in the characteristic lip length imbalance, whereas the progressively retruding upper lip and protruding lower lip led to developing a step relationship in the sagittal lip profile during the adolescent growth period. Their columellae and nose tips rotated downward during this time.
The effect of facial soft tissues on facial esthetics is well known and has been researched extensively. The nose, lips, and chin are the key regions of the face with the most significant impact on facial esthetics. In patients with repaired clefts, craniofacial growth is altered, and relative midfacial retrusion is a characteristic feature that becomes increasingly apparent with longitudinal growth. This retrusion is also seen in the upper lip that remains deficient in both height and depth, in contrast to the lower lip that is longer, protruded, and frequently everted.
Sagittal and vertical nose-lip-chin imbalances are deterrents to facial esthetics in everyone. Rhinoplasty is the most commonly performed esthetic facial plastic surgery procedure, and botulin toxin and hyaluronic acid injections are the most common nonsurgical esthetic facial procedures performed by facial plastic surgeons in the United States. Not surprisingly, patients with clefts, who frequently have facial imbalances in the lip and nose regions, report these as having the most unfavorable impacts on their facial attractiveness, self-image, and self-esteem. The lip, nose, and columella also most frequently receive surgical revision in persons with clefts. One major goal of orthognathic surgery in these patients is to improve the soft-tissue profile esthetics by correcting the imbalances. Patients with facial malformations, including those with clefts, have been reported to suffer significant disadvantages in their social lives with higher prevalences of depression and anxiety.
Although the importance of the soft-tissue profile in patients with clefts is well recognized, several limitations of previous studies have not allowed a complete understanding of this important aspect of their facial growth. The published literature comprises studies that either were cross-sectional or did not describe a sufficiently longitudinal comparison with control subjects of similar ages and sexes, or had fewer subjects or measurements, or fewer female subjects represented in the data, or were outcome studies that compared the effects of one surgical protocol with another and did not study the soft-tissue profile as their main focus. Table I includes a summary of literature reports that provided data on the soft-tissue profile in patients with unilateral cleft lip and palate (UCLP). We aimed to detail the differences in the soft-tissue profiles of patients with repaired complete UCLP from those of noncleft controls with comparable age, sex, and ethnicity at 7, 11, and 18 years, thus covering the entire period of active facial growth. We also aimed to analyze the differences longitudinally to determine whether the nature and magnitude of these differences changed over the growth period. Our objective was to study the soft-tissue profile differences and investigate the longitudinal differences in growth of the soft-tissue profile in general. We did not intend to evaluate the outcome of one surgical protocol or one surgeon with another.
| Author (year); study design | Ethnicity; region of sample | Number of soft-tissue measurements reported | UCLP sample | Surgery | Comparison group |
|---|---|---|---|---|---|
| Sadowsky et al (1973); mixed longitudinal | White; Chicago | 15 | n = 75 (54 M, 21 F), no Simonart`s band | Lip repair: Tennison, LeMesurier, Millard Palate repair: Wardill push-back, von- Langenbeck/vomer flap |
Noncleft data from Subtelny (1959); and Posen (1967): n = 30; 15 M, 15 F, with normal skeletal profiles |
| Pensler and Mulliken (1988); cross-sectional, mesh analysis | Mixed ethnicity; Boston | 7 | n = 3 | Not described | Normal values for the mesh diagram analysis from Moorrees et al (1976) |
| Enemark et al (1990); longitudinal | White; Copenhagen and Aarhus | 8 | n = 57 (42 M, 15 F), ages 5, 8, 12, 16 and 21 y, no Simonart`s band | Lip repair: Tennison Palate repair: push-back palatoplasty and vomer flap Other surgery: pharyngeal flap, alveolar bone grafting |
Noncleft data from Michigan Growth Study norms from Riolo et al (1974) |
| Semb (1991); mixed longitudinal | White; Oslo | 27 | n = 177 (126 M, 51 F), complete UCLP without Simonart`s band | Lip repair: modified LeMesurier, Millard Hard palate: superiorly based single layer vomer flap Posterior palate: von Langenbeck Other surgery: alveolar bone grafting; a few lip revisions, superiorly based pharyngeal flap (20%) |
Bolton normal values (white, 16 M, 16 F, excellence in static occlusion, esthetically favorable faces) |
| Friede et al (1991); cross-sectional | White; Goteborg, Aarhus, Oslo, Linkoping | 11 | 15 consecutive patients at each center: Goteborg (10 M, 5 F), Oslo (11 M, 4 F), Aarhus (12 M, 3 F), and Linkoping (15 M, 0 F). Age range, 7-10 y, Simonart`s band included | Lip repair: not described. Palate repair: Linkoping used 1-stage push-back. Aarhus used 2 stages—vomer flap and push-back. Oslo used 2 stages—vomer flap and von Langenbeck. Goteborg operated on velum first and delayed hard palate closure until mixed dentition |
Intercenter comparison |
| Molsted et al (1992); cross-sectional | White; Eurocleft study | 13 | n = 151; age, 8-9 y; n = 18-41 for each center. M:F varying between 1:0.8 and 1:0.3 Total number of surgeons = 34 | Lip repair: Millard, Tennison Palate repair: Bardach, Delaire, Wardill- Kilner, vomer flap, von Langenbeck Other surgery: alveolar bone grafting |
Differences between centers; no normative group |
| Brattstrom et al (1992); cross-sectional | White; Stockholm, Oslo, and Toronto | 27 | n = 85 (59 M, 26 F), ages,16-18 y | Lip surgery: Millard and vomer flap, Skoog, Millard, Tennison and 4-flap technique, Randall-Tennison, le Mesurier Palate repair: von Langenbeck, Wardill- Kilner Other surgery: alveolar bone grafting |
Intercenter comparison |
| Smahel et al (1993); mixed longitudinal and cross-sectional | White; Prague | 8 | n = 81 (ages, 8 y, 53; 10 y, 61; 12 y, 43; 14 y, 38) and 24 adults | Lip repair: Tennison, Veau; Palate repair: push-back Other surgery: pharyngeal flap |
8-year- old UCLP were compared with 5-year-old normative data from Smahel and Mullerova (1986); 10-14 year old children were compared with normal adult male volunteers reported in Smahel and Brejcha (1983) |
| Tindlund and Rygh (1993); cross-sectional | White; Bergen | 36 | Group 1 UCLP n = 45; group 2, various cleft types n = 63. Mean age, 6 y | Lip repair: lip, primary and anterior palate. Periosteoplasty (modified Skoog) Palate repair: push-back. No other surgery. |
Normative data taken from Tindlund et al (1993); n = 41 (27 M, 14 F). Normal growth, maxillomandibular relationship (ANB angle, 0°-4°), normal occlusion, matched for age and sex |
| Chaisrisookumporn et al (1995); cross-sectional | White; Texas | 8 | 10 bilateral, 20 unilateral (15 M, 15 F); mean age, 20.8 y (range, 12-42 y) | Lip repair: Millard. Palate repair: Wardill palatoplasty. Other surgery: velopharyngeal flaps, alveolar bone grafting |
Normative cephalometric data taken from Scheideman et al (1980) and Epker and Fish (1986) |
| Roberts-Harry et al (1996); cross-sectional | White; Oslo and Bristol | 22 | n = 40 from Oslo (26 M, 14 F; 9 with Simonart`s band) and 32 from Bristol (23 M, 9 F; 7 with Simonart`s band) at age 10 y | Oslo: lip repair: Millard Palate repair: vomerine flap to close anterior hard palate and von Langenbeck for posterior hard palate. Other surgery: alveolar bone grafting Bristol: lip repair: Millard with Muir or Veau type mucoperiosteal flaps and vomerine flap to repair the hard palate, nasal correction at the same time. Palate repair: 2 or 3 flap Veau type repair Other surgery: alveolar bone grafting |
Comparative study between 2 centers (Frenchay Hospital, Bristol, United Kingdom, and the Rikshospitalet, Oslo, Norway), no control group |
| Spyropoulos and Linder Aronson (1997); cross-sectional | White; Greek and Swedish | 8 | n = 23 (14 M, 9 F) from each center. Age range, 4-19 y | Insufficient surgical details provided; some patients in the Swedish sample had received presurgical infant orthopedics and primary alveolar bone grafting | Intercenter comparison |
| Smahel et al (1998); cross-sectional | White; Prague | 9 | n = 84 M, older than 18 y | Lip repair: Veau and Tennison-Randall. Palate repair: push-back, Schweckendiek. Other surgery: primary alveolar bone grafting, primary periosteoplasty |
Normal adult male volunteers reported in Smahel and Brejcha (1983) |
| Leonard et al (1998); Cross-sectional | White; Irish | 11 | n = 25 (14 M, 11 F), mean age, 9.4 y, Simonart`s band included; compared with Eurocleft study | Lip repair: Millard and vomer flap, Skoog. Palate repair: von Langenbeck, Wardill-Kilner. Other surgery: alveolar bone grafting at 9 y |
Intercenter comparison |
| Smahel et al (1999); Cross-sectional | White; Prague | 5 | n = 30 M, mean age, 15.5 y; group 2 without repositioning of nasal septum, n = 32 M, mean age, 15.2 y | Lip repair: Tennison and primary perioplasty. Palate repair: push-back Other surgeries: pharyngeal flap, repositioning of nasal septum, corrective lip surgery |
No normative group (comparison between the 2 cleft groups, with and without repositioning of nasal septum) |
| Stoll et al (2002); Cross-sectional | White; Berlin | 21 | n = 84 (51 M, 33 F; mean age, 20.9 y; range, 16-29 y) | Lip repair: Millard. Palate repair: Veau-Rosenthal-Kriens. Other surgeries: velopharyngoplasty, alveolar bone grafting |
n = 58 (29 M, 29 F; mean age, 27 y), white subjects with harmonious face in terms of general perception of attractiveness; complete dentition, including molar and a stable neutrocclusion in the canine and molar regions |
| Bearn et al (2002); Cross-sectional | White; United Kingdon | 7 angles | n = 182 (ages, 12-14 y) | Surgical details not provided, sample taken from Clinical Standards Advisory Group Study (United Kingdom) | Published data from other studies |
| Toygar et al (2004); Cross-sectional | Turkish children | 10 lower lip measurements | n = 24 (15 M, 9 F; mean age, 12.3 y) | Not described | n = 20 (M:F not described; mean age, 12.3 y), harmonious profile and Class I neutral occlusion |
| Dogan et al (2005); Cross-sectional | White; Turkish children | 22 | n = 42 (20 M, 22 F; mean age, 13 y), almost all operations done by same surgeon | Lip repair: Millard. Palate repair: von Langenbeck. |
n = 45 (21 M, 24 F; mean age, 15 y) |
| Nollet et al (2008); longitudinal | White; Nijmegen | 8 | n = 43 (27 M, 16 F), ages, 9,12, and 18 y | Lip repair: Millard; Soft palate repair: modified von Langenbeck; Hard palate repair: delayed until 9-11 y. with alveolar bone grafting; Other surgeries: alveolar bone grafting, lip/nose correction (15-19 y) |
Descriptive data presented at 9, 12, and 18 y; no comparison group |
| Daskalogiannakis et al (2011); Cross-sectional | White; Americleft | 7 | n = 148 children, ages 8-9 y; n = 18-40 for each center. M:F varying between 1:0.6 and 1:0.3 |
Lip repair: Millard, Delaire, Tennison. Palate repair: Bardach, Delaire, Wardill Kilner, vomer flap, von Langenbeck, Veau pushback, Furlow. |
Intercenter comparison |
| This study; Longitudinal; comparison at ages 7, 11.1, and 17.9 y | White; Toronto | 22 | n = 70 (35 M, 35 F), ages 7, 11.1, and 17.9 y | Lip repair: rectangular or lower triangular flaps or their modifications. Palate repair: push-back palatoplasty, von Langenbeck repair or their modifications |
n = 70 (35 M, 35 F) comparable age and sex from Burlington Growth Center, Toronto |
Material and methods
After research ethics board approval, the lateral cephalograms of 70 white subjects (35 boys, 35 girls) with nonsyndromic complete UCLP who had received their lip and palate surgeries at the Hospital for Sick Children, Toronto, were retrospectively obtained from the archives of the hospital’s craniofacial center. In this sample, 5 surgeons and their teams had performed the lip repairs using rectangular or lower triangular flaps or their modifications. Palate repair surgeries had been conducted by 5 surgeons and their teams using techniques that included push-back palatoplasty, von Langenbeck repair, or their modifications. No patients with Simonart’s bands were included in the sample. To prevent effects of any other surgery than the primary lip and palate repairs on the soft-tissue profile, only patients who had not received any primary septoplasty, nasal revision, or alveolar bone graft surgery were selected. Furthermore, no subjects had received nasal molding in their presurgical maxillary orthopedic treatment during infancy. Lateral cephalograms available at 3 time points—T1 (7 years), T2 (11 years), and T3 (18 years)—were used ( Table II ). The T3 cephalograms had been taken before the orthognathic surgery if surgery had been provided for any subject. These steps ensured that our data were relatively homogeneous and free from any effects that secondary surgery or any ancillary procedure might have had on the skeletal or soft-tissue measurements. With the participation of experts from many disciplines involved in providing long-term craniofacial care of patients at the center, it is reasonable to state that our sample, which was under long-term follow-up and treatment of over 18 years at the center, included children who had been accurately diagnosed with nonsyndromic UCLP.
| Time | UCLP | Control | ||
|---|---|---|---|---|
| Boys (n = 35) | Girls (n = 35) | Boys (n = 35) | Girls (n = 35) | |
| T1 (y) | 6.8 ± 0.8 | 7.3 ± 0.7 | 6.7 ± 0.8 | 7.1 ± 0.8 |
| T2 (y) | 11.0 ± 0.9 | 11.3 ± 1.1 | 11.1 ± 0.9 | 11.3 ± 1.0 |
| T3 (y) | 18.1 ± 0.9 | 17.5 ± 1.6 | 18.1 ± 1.1 | 17.7 ± 1.5 |
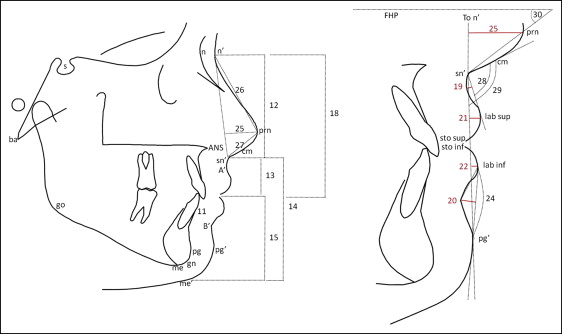
The lateral cephalograms had been taken with the teeth in occlusion and the lips in repose. Cephalometric details, including soft-tissue profiles, were traced by 1 investigator (I.M.) and digitized by an experienced digitizer. For each subject with UCLP, radiographs from a white control subject with normal skeletal Class I growth and comparable age and sex were obtained from the Burlington Growth Center archives at the Faculty of Dentistry, University of Toronto, and were similarly traced and digitized. A customized cephalometric analysis was developed using the Dentofacial Planner software (Dentofacial Planner, Toronto, Ontario, Canada) to include relevant measurements from conventional analyses, with additional measurements specific for studying the soft-tissue profile, as demonstrated in Figure 1 . No adjustment for radiographic magnification (9.66% in the radiographs from the Hospital for Sick Children and 9.84% in those from the Burlington Growth Center) was made. To estimate method error, a total of 45 cephalograms (15 radiographs from the UCLP and control groups at each of the 3 time points) were retraced and redigitized 8 weeks later. Intraclass correlation coefficients and Dahlberg’s method of determining intraexaminer error ( Table III ) showed that the method errors were small, and the repeatability was excellent.
| Measurement | Tracing 1 | Tracing 2 | Intraexaminer measurement error | Intraexaminer ICC | P value | ||
|---|---|---|---|---|---|---|---|
| Mean | SD | Mean | SD | ||||
| Hard tissues | |||||||
| Anterior cranial base (mm) | 71.5 | 4.8 | 71.42 | 4.74 | 0.30 | 0.996 | <0.001 |
| Total cranial base (mm) | 105.87 | 7.07 | 105.77 | 7.07 | 0.50 | 0.995 | <0.001 |
| Upper anterior face height (mm) | 52.41 | 5.97 | 52.36 | 6.02 | 0.35 | 0.997 | <0.001 |
| Lower anterior face height (mm) | 65.44 | 6.06 | 65.46 | 5.98 | 0.36 | 0.996 | <0.001 |
| SNA (°) | 78.86 | 3.36 | 78.88 | 3.27 | 0.46 | 0.98 | <0.001 |
| SNB (°) | 76.4 | 3.5 | 76.36 | 3.54 | 0.31 | 0.992 | <0.001 |
| ANB (°) | 2.47 | 2.64 | 2.53 | 2.63 | 0.42 | 0.974 | <0.001 |
| SN to GoGn (°) | 34.32 | 4.33 | 34.34 | 4.31 | 0.45 | 0.989 | <0.001 |
| Hard-tissue convexity (°) | 170.81 | 4.87 | 170.74 | 5.08 | 0.51 | 0.989 | <0.001 |
| Maxillary incisor height + chin (mm) | 39.93 | 4.81 | 39.99 | 4.75 | 0.34 | 0.995 | <0.001 |
| Soft tissues | |||||||
| Upper anterior face height (mm) | 52.68 | 7.02 | 52.62 | 6.98 | 0.37 | 0.997 | <0.001 |
| Upper lip length (mm) | 20.85 | 3.03 | 20.82 | 2.88 | 0.42 | 0.98 | <0.001 |
| Lower soft-tissue face height (mm) | 45.97 | 5.75 | 46.16 | 5.9 | 0.45 | 0.995 | <0.001 |
| Superior labial sulcus (mm) | 2.01 | 0.68 | 1.92 | 0.67 | 0.26 | 0.852 | <0.001 |
| Inferior labial sulcus (mm) | 2.73 | 1.55 | 2.82 | 1.69 | 0.36 | 0.951 | <0.001 |
| Upper lip protrusion (mm) | 4.45 | 2.3 | 4.3 | 2.17 | 0.34 | 0.978 | <0.001 |
| Lower lip protrusion (mm) | 4.63 | 2.53 | 4.73 | 2.55 | 0.28 | 0.988 | <0.001 |
| Lower lip projection (mm) | 8.9 | 2.6 | 9.05 | 2.6 | 0.32 | 0.987 | <0.001 |
| Inferior labial sulcus angle (°) | 135.24 | 12.78 | 135.19 | 12.9 | 0.48 | 0.999 | <0.001 |
| Nose depth (mm) | 15.31 | 3.46 | 15.5 | 3.43 | 0.38 | 0.989 | <0.001 |
| Nose length (mm) | 44.61 | 6.76 | 44.73 | 6.68 | 0.57 | 0.993 | <0.001 |
| Columellar length (mm) | 19.05 | 3.86 | 19.1 | 3.98 | 0.53 | 0.981 | <0.001 |
| Nasolabial angle (°) | 103.81 | 15.66 | 103.69 | 15.73 | 0.48 | 0.999 | <0.001 |
| Columellar angle (°) | 68.78 | 9.48 | 68.7 | 9.6 | 0.38 | 0.998 | <0.001 |
| Columellar inclination (°) | 25 | 9.47 | 25.1 | 9.62 | 0.34 | 0.998 | <0.001 |
| Soft-tissue convexity – nose (°) | 167.04 | 7.36 | 166.84 | 7.31 | 0.65 | 0.992 | <0.001 |
| Soft-tissue convexity + nose (°) | 137.74 | 7.85 | 137.79 | 7.81 | 0.50 | 0.996 | <0.001 |
| Nasal tip convexity (°) | 91.12 | 9.63 | 91.21 | 9.62 | 0.48 | 0.997 | <0.001 |
Measurements between groups (UCLP and control) were compared at each time point using generalized linear models adjusted for age and sex effects. Longitudinal comparisons across all time points were conducted using the mixed model approach, adjusting for these effects and their interactions with time, to determine the effects of the group (UCLP and control) on growth differences. P <0.05 was considered significant.
Results
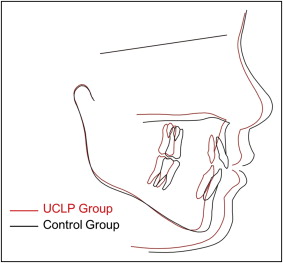
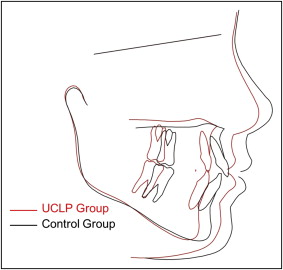
Upper anterior face height was smaller in the UCLP group at T1 and T2 ( Figs 2 and 3 ), but the differences decreased with adolescent growth so that they were not significant at T3 ( Fig 4 ). However, lower anterior face height, which was not significantly different at T1, showed greater increments with growth and became distinctly longer in the UCLP group, especially during adolescence ( Figs 3 and 4 ). The hard-tissue face height ratio remained 4% to 5% smaller in the UCLP group ( Tables IV-VI ). Although both jaws were relatively retrognathic in the UCLP group, the maxilla became particularly more retrognathic with growth, leading to a negative ANB angle at age 18 years ( Fig 5 , Table VI ). This was despite the relatively larger mandibular plane angle (SN to GoGn) at all 3 times. The difference in the mandibular plane angle between the UCLP and control groups became progressively larger with growth. This angle was ultimately 5° larger in the UCLP group than in the control group at T3 ( Fig 4 , Table VI ). The erupted height of the mandibular incisor to the mandibular border was not significantly different at any time point studied. The hard-tissue convexity (angle N-ANS-Me) was significantly larger in the UCLP group at T3 ( Table VI ). An overall growth effect was observed in the hard-tissue measurements, with the differences between the groups generally increasing from T1 to T3. The longitudinal analysis of the hard-tissue measurements showed that overall, the growth changes from T1 to T3 were significantly smaller in the UCLP group for upper anterior face height, hard-tissue face-height ratio, and the SNA, SNB, and ANB angles, whereas the changes were greater for lower anterior face height and the mandibular plane angle.
| Measurement | UCLP group (n = 70) | Control group (n = 70) | Estimated difference (UCLP – control) | |||||
|---|---|---|---|---|---|---|---|---|
| Adjusted mean | 95% CI | Adjusted mean | 95% CI | Mean | SE | P value | Sig | |
| Hard tissues | ||||||||
| Anterior cranial base (mm) | 66.82 | (66.14, 67.51) | 67.59 | (66.9, 68.27) | −0.77 | 0.49 | 0.121 | |
| Total cranial base (mm) | 97.51 | (96.56, 98.45) | 98.71 | (97.77, 99.66) | −1.21 | 0.68 | 0.077 | |
| Upper anterior face height (mm) | 44.46 | (43.85, 45.06) | 46.38 | (45.77, 46.98) | −1.92 | 0.43 | <0.0001 | ‡ |
| Lower anterior face height (mm) | 61.21 | (60.14, 62.29) | 59.96 | (58.88, 61.04) | 1.25 | 0.77 | 0.108 | |
| Hard-tissue face height ratio | 0.73 | (0.72, 0.75) | 0.78 | (0.76, 0.79) | −0.04 | 0.01 | 0.000 | ‡ |
| SNA (°) | 78.93 | (78.08, 79.78) | 80.34 | (79.49, 81.2) | −1.41 | 0.61 | 0.022 | * |
| SNB (°) | 74.57 | (73.77, 75.38) | 76.71 | (75.91, 77.52) | −2.14 | 0.58 | 0.000 | ‡ |
| ANB (°) | 4.36 | (3.73, 4.98) | 3.64 | (3.01, 4.27) | 0.71 | 0.45 | 0.115 | |
| SN to GoGn (°) | 36.65 | (35.57, 37.72) | 33.89 | (32.81, 34.96) | 2.76 | 0.77 | 0.001 | ‡ |
| Hard-tissue convexity (°) | 166.29 | (164.91, 167.68) | 167.63 | (166.25, 169.02) | −1.34 | 0.99 | 0.178 | |
| Mandibular incisor height + chin (mm) | 35.64 | (35.07, 36.2) | 35.29 | (34.73, 35.86) | 0.34 | 0.40 | 0.396 | |
| Soft tissues | ||||||||
| Upper soft-tissue face height (mm) | 45.06 | (44.28, 45.85) | 45.44 | (44.65, 46.22) | −0.38 | 0.56 | 0.505 | |
| Upper lip length (mm) | 19.95 | (19.3, 20.6) | 20.47 | (19.82, 21.12) | −0.52 | 0.47 | 0.263 | |
| Lower soft-tissue face height (mm) | 60.97 | (59.9, 62.04) | 62.53 | (61.46, 63.6) | −1.56 | 0.77 | 0.043 | * |
| Lower lip + soft-tissue chin (mm) | 41.02 | (40.13, 41.91) | 42.06 | (41.17, 42.95) | −1.04 | 0.64 | 0.104 | |
| Soft-tissue face height ratio | 0.74 | (0.73, 0.76) | 0.73 | (0.71, 0.75) | 0.01 | 0.01 | 0.280 | |
| Upper lip:lower lip + soft-tissue chin (mm) | 0.49 | (0.47, 0.51) | 0.49 | (0.47, 0.51) | 0.00 | 0.01 | 0.796 | |
| Upper face height.+ upper lip length (mm) | 65.01 | (63.99, 66.03) | 65.91 | (64.89, 66.93) | −0.90 | 0.73 | 0.220 | |
| Superior labial sulcus (mm) | 1.32 | (1.19, 1.46) | 1.47 | (1.34, 1.6) | −0.15 | 0.10 | 0.129 | |
| Inferior labial sulcus (mm) | 3.99 | (3.72, 4.25) | 3.93 | (3.67, 4.19) | 0.06 | 0.19 | 0.757 | |
| Upper lip protrusion (mm) | 3.24 | (2.84, 3.63) | 4.67 | (4.28, 5.07) | −1.44 | 0.28 | <0.0001 | ‡ |
| Lower lip protrusion (mm) | 4.59 | (4.09, 5.09) | 3.52 | (3.02, 4.01) | 1.07 | 0.36 | 0.003 | † |
| Lower lip projection (mm) | 8.03 | (7.54, 8.51) | 7.70 | (7.21, 8.18) | 0.33 | 0.34 | 0.341 | |
| Inferior labial sulcus angle (°) | 137.20 | (134.23, 140.18) | 139.92 | (136.94, 142.89) | −2.71 | 2.13 | 0.205 | |
| Nose depth (mm) | 11.70 | (11.35, 12.04) | 12.96 | (12.61, 13.31) | −1.26 | 0.25 | <0.0001 | ‡ |
| Nose length (mm) | 38.22 | (37.44, 39.01) | 37.92 | (37.13, 38.7) | 0.31 | 0.56 | 0.584 | |
| Columellar length (mm) | 14.71 | (14.28, 15.14) | 16.54 | (16.11, 16.97) | −1.83 | 0.31 | <0.0001 | ‡ |
| Nasolabial angle (°) | 108.29 | (105.27, 111.3) | 109.09 | (106.07, 112.1) | −0.80 | 2.16 | 0.711 | |
| Columellar angle (°) | 70.03 | (68, 72.05) | 67.21 | (65.18, 69.24) | 2.82 | 1.45 | 0.055 | |
| Nose tip inclination (°) | 21.65 | (19.53, 23.77) | 28.09 | (25.97, 30.21) | −6.44 | 1.52 | <0.0001 | ‡ |
| Soft-tissue convexity – nose (°) | 167.89 | (166.37, 169.41) | 163.22 | (161.7, 164.74) | 4.67 | 1.09 | <0.0001 | ‡ |
| Soft-tissue convexity + nose (°) | 140.63 | (139.48, 141.77) | 134.49 | (133.34, 135.63) | 6.14 | 0.82 | <0.0001 | ‡ |
| Nasal tip convexity (°) | 92.06 | (89.99, 94.12) | 92.65 | (90.58, 94.72) | −0.59 | 1.48 | 0.690 | |
| Measurement | UCLP group (n = 70) | Control group (n = 70) | Estimated difference (UCLP – control) | |||||
|---|---|---|---|---|---|---|---|---|
| Adjusted mean | 95% CI | Adjusted mean | 95% CI | Mean | SE | P value | Sig | |
| Hard tissues | ||||||||
| Anterior cranial base (mm) | 70.26 | (69.56, 70.97) | 71.26 | (70.56, 71.97) | −1.00 | 0.51 | 0.049 | * |
| Total cranial base (mm) | 104.11 | (103.11, 105.11) | 105.62 | (104.62, 106.62) | −1.51 | 0.71 | 0.036 | * |
| Upper anterior face height (mm) | 50.38 | (49.73, 51.03) | 51.97 | (51.31, 52.62) | −1.58 | 0.47 | 0.001 | ‡ |
| Lower anterior face height (mm) | 65.23 | (64.14, 66.33) | 63.58 | (62.48, 64.67) | 1.66 | 0.78 | 0.036 | * |
| Hard-tissue face height ratio | 0.78 | (0.76, 0.79) | 0.82 | (0.8, 0.84) | −0.04 | 0.01 | 0.000 | ‡ |
| SNA (°) | 76.19 | (75.3, 77.08) | 80.36 | (79.47, 81.25) | −4.16 | 0.64 | <0.0001 | ‡ |
| SNB (°) | 74.48 | (73.71, 75.24) | 77.49 | (76.72, 78.25) | −3.01 | 0.55 | <0.0001 | ‡ |
| ANB (°) | 1.72 | (1.14, 2.29) | 2.87 | (2.3, 3.44) | −1.15 | 0.41 | 0.006 | † |
| SN to GoGn (°) | 36.60 | (35.49, 37.71) | 32.88 | (31.77, 33.99) | 3.72 | 0.79 | <0.0001 | ‡ |
| Hard-tissue convexity (°) | 171.18 | (169.8, 172.55) | 170.49 | (169.12, 171.87) | 0.68 | 0.98 | 0.488 | |
| Maxillary incisor height + chin (mm) | 39.19 | (38.59, 39.78) | 38.96 | (38.36, 39.55) | 0.23 | 0.43 | 0.589 | |
| Soft tissues | ||||||||
| Upper soft-tissue face height (mm) | 50.84 | (49.94, 51.74) | 51.02 | (50.12, 51.92) | −0.18 | 0.64 | 0.777 | |
| Upper lip length (mm) | 20.03 | (19.36, 20.7) | 21.84 | (21.17, 22.51) | −1.81 | 0.48 | 0.000 | ‡ |
| Lower soft-tissue face height (mm) | 65.62 | (64.48, 66.76) | 67.14 | (66, 68.28) | −1.52 | 0.81 | 0.065 | |
| Lower lip + soft-tissue chin (mm) | 45.59 | (44.73, 46.46) | 45.30 | (44.43, 46.17) | 0.29 | 0.62 | 0.638 | |
| Soft-tissue face height ratio | 0.78 | (0.76, 0.8) | 0.76 | (0.74, 0.78) | 0.02 | 0.01 | 0.276 | |
| Upper lip:lower lip + soft-tissue chin (mm) | 0.44 | (0.43, 0.46) | 0.49 | (0.47, 0.5) | −0.04 | 0.01 | 0.000 | ‡ |
| Upper face height + upper lip length (mm) | 70.86 | (69.83, 71.9) | 72.86 | (71.82, 73.89) | −1.99 | 0.74 | 0.008 | † |
| Superior labial sulcus (mm) | 1.47 | (1.32, 1.63) | 1.68 | (1.53, 1.84) | −0.21 | 0.11 | 0.059 | |
| Inferior labial sulcus (mm) | 4.60 | (4.32, 4.88) | 4.85 | (4.57, 5.13) | −0.25 | 0.20 | 0.214 | |
| Upper lip protrusion (mm) | 3.00 | (2.55, 3.45) | 4.66 | (4.22, 5.11) | −1.66 | 0.32 | <0.0001 | ‡ |
| Lower lip protrusion (mm) | 5.17 | (4.67, 5.68) | 3.77 | (3.26, 4.28) | 1.40 | 0.36 | 0.000 | ‡ |
| Lower lip projection (mm) | 8.82 | (8.35, 9.3) | 8.60 | (8.12, 9.08) | 0.22 | 0.34 | 0.515 | |
| Inferior labial sulcus angle (°) | 137.03 | (134.4, 139.65) | 135.91 | (133.28, 138.54) | 1.12 | 1.88 | 0.554 | |
| Nose depth (mm) | 13.92 | (13.49, 14.34) | 15.22 | (14.8, 15.65) | −1.30 | 0.30 | <0.0001 | ‡ |
| Nose length (mm) | 43.65 | (42.7, 44.61) | 43.36 | (42.41, 44.31) | 0.30 | 0.68 | 0.663 | |
| Columellar length (mm) | 16.99 | (16.49, 17.49) | 18.88 | (18.38, 19.38) | −1.89 | 0.36 | <0.0001 | ‡ |
| Nasolabial angle (°) | 105.34 | (102.54, 108.14) | 110.34 | (107.54, 113.14) | −5.00 | 2.00 | 0.014 | * |
| Columellar angle (°) | 70.92 | (69.06, 72.78) | 68.08 | (66.22, 69.94) | 2.84 | 1.33 | 0.035 | * |
| Nose tip inclination (°) | 19.89 | (17.88, 21.89) | 29.22 | (27.22, 31.22) | −9.34 | 1.43 | <0.0001 | ‡ |
| ST convexity – nose (°) | 171.00 | (169.6, 172.4) | 162.87 | (161.47, 164.27) | 8.13 | 1.00 | <0.0001 | ‡ |
| ST convexity + nose (°) | 141.06 | (139.88, 142.24) | 132.76 | (131.58, 133.94) | 8.31 | 0.84 | <0.0001 | ‡ |
| Nasal tip convexity (°) | 90.39 | (88.51, 92.28) | 91.23 | (89.35, 93.12) | −0.84 | 1.35 | 0.534 | |
| Measurement | UCLP group (n = 70) | Control group (n = 70) | Estimated difference (UCLP – control) | |||||
|---|---|---|---|---|---|---|---|---|
| Adjusted mean | 95% CI | Adjusted mean | 95% CI | Mean | SE | P value | Sig | |
| Hard tissues | ||||||||
| Anterior cranial base (mm) | 74.37 | (73.52, 75.22) | 75.85 | (75, 76.7) | −1.48 | 0.61 | 0.016 | * |
| Total cranial base (mm) | 111.08 | (110.01, 112.15) | 112.34 | (111.27, 113.41) | −1.26 | 0.76 | 0.103 | |
| Upper anterior face height (mm) | 56.16 | (55.39, 56.93) | 57.06 | (56.29, 57.83) | −0.91 | 0.55 | 0.102 | |
| Lower anterior face height (mm) | 72.60 | (71.42, 73.79) | 69.20 | (68.02, 70.39) | 3.40 | 0.85 | 0.000 | ‡ |
| Hard-tissue face height ratio | 0.78 | (0.76, 0.79) | 0.83 | (0.81, 0.84) | −0.05 | 0.01 | <0.0001 | ‡ |
| SNA (°) | 74.52 | (73.58, 75.47) | 80.81 | (79.87, 81.76) | −6.29 | 0.67 | <0.0001 | ‡ |
| SNB (°) | 75.38 | (74.55, 76.2) | 78.97 | (78.15, 79.8) | −3.60 | 0.59 | <0.0001 | ‡ |
| ANB (°) | -0.86 | (-1.51, -0.21) | 1.84 | (1.19, 2.49) | −2.69 | 0.46 | <0.0001 | ‡ |
| SN to GoGn (°) | 35.50 | (34.34, 36.66) | 30.36 | (29.19, 31.52) | 5.15 | 0.83 | <0.0001 | ‡ |
| Hard-tissue convexity (°) | 176.72 | (175.04, 178.39) | 173.57 | (171.9, 175.25) | 3.15 | 1.20 | 0.010 | † |
| Mandibular incisor height + chin (mm) | 43.44 | (42.72, 44.15) | 42.81 | (42.09, 43.53) | 0.63 | 0.51 | 0.222 | |
| Soft tissues | ||||||||
| Upper soft-tissue face height (mm) | 57.29 | (56.27, 58.31) | 57.51 | (56.49, 58.53) | −0.22 | 0.73 | 0.762 | |
| Upper lip length (mm) | 20.87 | (20.2, 21.54) | 22.03 | (21.35, 22.7) | −1.16 | 0.48 | 0.018 | * |
| Lower soft-tissue face height (mm) | 73.98 | (72.69, 75.27) | 72.93 | (71.64, 74.23) | 1.05 | 0.92 | 0.258 | |
| Lower lip + soft-tissue chin (mm) | 53.11 | (52.09, 54.14) | 50.91 | (49.89, 51.93) | 2.21 | 0.73 | 0.003 | † |
| Soft-tissue face height ratio | 0.78 | (0.76, 0.8) | 0.79 | (0.77, 0.81) | −0.01 | 0.01 | 0.436 | |
| Upper lip:lower lip + soft-tissue chin (mm) | 0.39 | (0.38, 0.41) | 0.44 | (0.42, 0.45) | −0.04 | 0.01 | 0.000 | ‡ |
| Upper face height + upper lip length (mm) | 78.16 | (77.04, 79.28) | 79.54 | (78.42, 80.66) | −1.38 | 0.80 | 0.087 | |
| Superior labial sulcus (mm) | 2.03 | (1.85, 2.21) | 1.99 | (1.8, 2.17) | 0.04 | 0.13 | 0.750 | |
| Inferior labial sulcus (mm) | 5.92 | (5.59, 6.25) | 5.38 | (5.05, 5.72) | 0.53 | 0.24 | 0.027 | * |
| Upper lip protrusion (mm) | 2.17 | (1.69, 2.65) | 4.02 | (3.55, 4.5) | −1.86 | 0.34 | <0.0001 | ‡ |
| Lower lip protrusion (mm) | 5.03 | (4.45, 5.61) | 3.41 | (2.83, 3.99) | 1.62 | 0.42 | 0.000 | ‡ |
| Lower lip projection (mm) | 9.30 | (8.74, 9.86) | 8.79 | (8.23, 9.34) | 0.52 | 0.40 | 0.198 | |
| Inferior labial sulcus angle (°) | 130.12 | (127.29, 132.96) | 135.35 | (132.51, 138.18) | −5.22 | 2.03 | 0.011 | * |
| Nose depth (mm) | 17.49 | (16.97, 18.01) | 18.61 | (18.09, 19.13) | −1.12 | 0.37 | 0.003 | † |
| Nose length (mm) | 50.22 | (49.2, 51.24) | 49.80 | (48.78, 50.82) | 0.41 | 0.73 | 0.570 | |
| Columellar length (mm) | 20.45 | (19.82, 21.08) | 22.34 | (21.71, 22.97) | −1.89 | 0.45 | <0.0001 | ‡ |
| Nasolabial angle (°) | 100.36 | (97.39, 103.33) | 110.01 | (107.04, 112.98) | −9.65 | 2.12 | <0.0001 | ‡ |
| Columellar angle (°) | 74.93 | (72.96, 76.9) | 69.90 | (67.93, 71.87) | 5.03 | 1.41 | 0.001 | † |
| Nose tip inclination (°) | 16.07 | (13.96, 18.18) | 28.48 | (26.37, 30.59) | −12.41 | 1.51 | <0.0001 | ‡ |
| Soft-tissue convexity – nose (°) | 175.42 | (173.85, 176.98) | 164.15 | (162.59, 165.71) | 11.26 | 1.12 | <0.0001 | ‡ |
| Soft-tissue convexity + nose (°) | 140.94 | (139.6, 142.28) | 130.68 | (129.35, 132.02) | 10.26 | 0.96 | <0.0001 | ‡ |
| Nasal tip convexity (°) | 84.61 | (82.68, 86.54) | 88.04 | (86.11, 89.97) | −3.43 | 1.38 | 0.014 | * |
Stay updated, free dental videos. Join our Telegram channel
VIDEdental - Online dental courses


