Introduction
The goal of this study was to determine whether cone beam-computed tomography (CBCT) images with resolutions similar to those produced in orthodontic offices have sufficient resolution to accurately quantify root resorption defects.
Methods
Teeth containing simulated root defects were scanned by microcomputed tomography (microCT) and CBCT at 0.2- and 0.4-mm resolutions and were radiographed by the periapical technique. Root length was measured with digital calipers. Comparisons were made to establish significance between imagining modalities and to compare defects of differing severity and position.
Results
The mean absolute difference in volumetric measurements of lateral defects from 0.2-mm-resolution CBCT images compared with those from microCT images was significantly smaller than those from 0.4-mm-resolution CBCT images (0.20 ± 0.2 mm 3 vs 0.30 ± 0.3 mm 3 ; P = 0.002). A Bland-Altman analysis showed that the 95% limits of agreement range between low-resolution CBCT and microCT volumetric measurements was1.44-fold greater than that between high-resolution CBCT and microCT measurements (−0.87-0.68 vs −0.49-0.59 mm 3 ). The accuracy of the volumetric measurements was also significantly influenced by defect size ( P = 0.004 for high-resolution CBCT, P = 0.005 for low-resolution CBCT) and, on low-resolution scans, by the defect’s vertical position ( P = 0.012). Linear measurements of apical defects from both the 0.2- and 0.4-mm-resolution CBCT images were significantly more similar to the measurements made with digital calipers than the measurements from the periapical radiographs ( P <0.0001 and P <0.0001, respectively).
Conclusions
Our results demonstrated that, compared with measurements from microCT images, high-resolution CBCT scans lead to more accurate volumetric quantifications of lateral resorption defects than do low-resolution scans. Both high- and low-resolution CBCT scans can also be used to more accurately measure external apical root resorption defects than periapical radiographs. Because these results are from CBCT scans of static images, measurements of root resorption defects from scans of patients will most likely be less accurate because of patient movement.
External root resorption associated with orthodontic treatment is unpredictable in severity and an unavoidable side effect. External root resorption is undesirable because it can affect the long-term viability of the dentition. Root resorption associated with orthodontic treatment is a complex and multifactorial phenomenon that most likely results from individual physiologic and genetic risk factors, as well as from suboptimal treatment mechanics. The vast majority of root resorption seen in association with orthodontic treatment is usually minor, averaging only 0.4 to 1.5 mm of total root shortening. Additionally, although most patients lose some root structure during orthodontic treatment, they do not appear to experience premature tooth loss. However, more severe root resorption in association with orthodontic treatment, though rare, can have clinically significant consequences, including a reduced crown-to-root ratio and premature tooth loss. Therefore, it is important to identify patients who have a higher risk for severe external root resorption so that treatment plans can be modified to prevent the presumed negative sequelae of excessive tooth mobility or premature tooth loss. Notably, it has been reported that early signs of root resorption during orthodontic treatment are predictive of more severe resorption with continued treatment. Therefore, accurate detection of mild to moderate root resorption in the earlier phases of orthodontic treatment is critical for preventing more severe resorption in patients who are susceptible to resorption.
Clinical diagnosis of external root resorption in orthodontic practice is commonly based on routine orthodontic imaging procedures, such as panoramic, periapical, or lateral cephalographic radiographs. One major limitation with these techniques is that information can be lost when a 3-dimensional structure is compressed into a 2-dimensional image, so that overlapping anatomic structures compromise diagnostic accuracy. These radiographic techniques also depend on correct patient-to-film orientation, which increases the susceptibility to projection errors. Although paralleling techniques can diminish projection and procedural errors, ideal film, x-ray tube, and head orientations can still be difficult to achieve, leading to image distorations. Previous studies have demonstrated that conventional radiographic techniques are inadequate for consistently accurate diagnosis of external root resorption. Panoramic films have been shown to overestimate the loss of root structure by greater than 20% when compared with periapical radiography, and periapical radiographs have been shown to underestimate apical root resorption when compared with that seen on microcomputed tomography (microCT) images. Periapical imaging with the paralleling technique to detect root resorption in human cadaver teeth in skulls has also been shown to yield false-negative results in 52% of cases and false-positive results in 15% of cases. Difficulty in identifying resorption defects can compromise treatment if inappropriate treatment decisions are based on inaccurate radiographic assessments. An accurate diagnosis of root resorption is essential for the development of an appropriate treatment plan.
Cone-beam computed tomography (CBCT), which provides anatomically accurate 3-dimensional images, is becoming more common as a radiographic modality in orthodontic practices today. Some orthodontic offices are substituting CBCT scans for traditional orthodontic radiographic techniques, and others are adding CBCT imaging for specific patients, such as those with impacted canines, significant skeletal abnormalities, or a high risk of root resorption. In these patients, conventional radiographic images might provide insufficient information for ideal treatment-planning decisions. Large field-of-view CBCT scans can currently be taken at 4 resolutions, including super high (0.125 mm), high (0.2 mm), medium (0.3 mm), and low (0.4 mm). Whereas super high- and high-resolution scans are generally reserved for research purposes and rare clinical cases, lower-resolution CBCT scans are more commonly taken in clinical orthodontic settings.
That CBCT scans can provide anatomically more accurate and distortion-free images of tooth roots suggests that they might be a highly accurate method for the study of root resorption. The ability to reconstruct 2-dimensional CBCT image slices into 3 dimensions allows the user to evaluate the loss of root structure both qualitatively and quantitatively. These potential advantages have led to a recent surge of studies investigating the detection of root resorption with CBCT techniques. A comparison of CBCT vs panoramic radiography for detection of incisor root resorption associated with impacted maxillary canines in orthodontic patients demonstrated that approximately 50% of lateral incisors showed evidence of root resorption by CBCT, but only about 30% showed evidence of root resorption by panoramic radiography. These findings indicate that many resorptive lesions involving impacted teeth are missed when information is provided only by conventional radiography. An investigation of cervical root resorption in patients as detected by CBCT or intraoral periapical radiography showed that CBCT has an overall higher sensitivity of detection than periapical radiography. One study comparing the detection of simulated root resorption in extracted teeth by periapical radiography vs CBCT imaging demonstrated that high-resolution CBCT images performed better than intraoral films for detection of resorptive defects ; another study showed that high-resolution CBCT images of simulated root resorption defects in porcine teeth did not lead to better detection compared with periapical radiographs. Although the results from these studies indicated that CBCT imaging might allow for more accurate subjective detection of root resorption than conventional 2-dimensional radiographs, the use of CBCT for the objective quantification of root structure loss has not yet been established. To date, the diagnostic ability of CBCT for detection of root resorption associated with orthodontic treatment has not been sufficiently studied. Recent reviews on CBCT imaging in orthodontics suggest a need for additional studies to assess the efficacy and sensitivity of CBCT for detecting and quantifying this type of root resorption.
Permanent loss of root structure associated with orthodontic treatment primarily occurs at the tooth apex; however, in some cases, there can be a significant loss of root structure in the lateral aspect of the root. The overall goal of this study was to determine whether low-resolution CBCT images, similar to the resolution of CBCT images produced routinely in clinical orthodontic practices, have sufficient resolution to accurately quantify external apical and lateral root resorption.
Material and methods
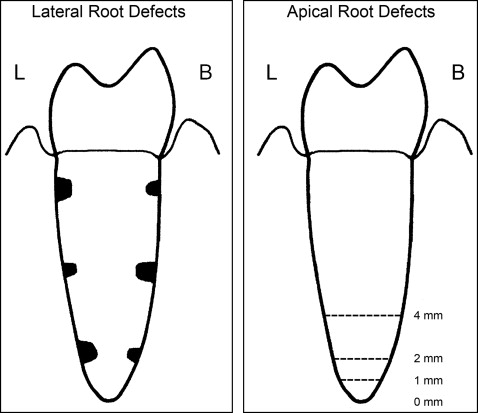
Teeth were obtained from adult human skulls from the School of Dentistry’s Division of Oral Pathology/Medicine/Radiology at the University of Michigan. Ten teeth were used for the volumetric quantification of lateral defects, and 15 teeth were used for the linear quantification of apical defects. Tooth inclusion criteria were monoradicular in shape, fully developed, intact and with an undamaged root structure with fully intact supporting alveolar bone, and removable from the alveolar bone without damage to the tooth or the surrounding structures. As shown in Figure 1 , simulated lateral resorptive defects of 1.0 or 1.8 mm in diameter were created on the tooth roots by using spherical carbide burs. Lateral defects were created at apical, middle, and cervical locations, as well as on the buccal and lingual surfaces of each tooth root, for a total of 30 lateral root defects of 1.0 mm in diameter and 30 lateral root defects of 1.8 mm in diameter. Also, as shown in Figure 1 , simulated apical defects were created to incrementally achieve losses of 1, 2, and 4 mm of apical root structure for a total of 43 apical defects (2 of the 2-mm defects were lost from accidental excessive drilling).
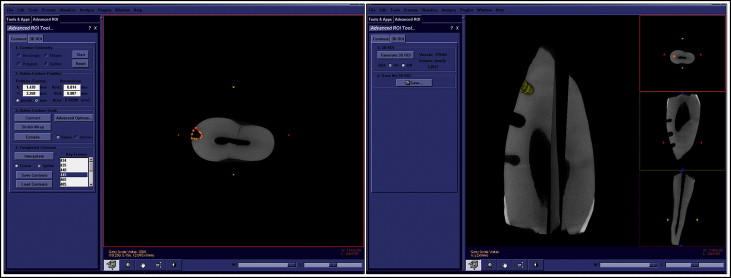
Each tooth was scanned in water at an 18-μm isotropic voxel resolution by using the eXplore Locus SP microCT imaging system (Pre-Clinical Imaging; GE Healthcare, London, Ontario, Canada). Measurements were taken at operating voltage of 80 kV and 80 mA of current, with an exposure time of 1600 milliseconds by using the Parker method scan technique, which rotates the sample 180° plus a fan angle of 20°. The scans were calibrated to a hydroxyapatite phantom, and 3-dimensional images were reconstructed at an effective voxel size of 18 μm 3 . Reconstructed images were analyzed with Microview software (version 2.2; GE Healthcare). A standard threshold of 1400 HU was used to distinguish mineralized from nonmineralized tissues. Positive identification of lateral defects was achieved by viewing the reconstructed images in the axial, coronal, and sagittal planes. As shown in Figure 2 , volumetric measurements of lateral defects were made by outlining approximately every 30th axial slice of each defect, followed by software interpolation between axial slices. This was followed by correction of the outline on every third axial slice of the defect with a second interpolation between slices. This was followed by confirmation as accurate or correction of the outline on each slice of the defect. The volumetric region of interest was established in this manner simply because it is faster to alter the outline of each slice than to create a new outline for each slice. After visual confirmation that the defect was correctly outlined in each axial slice, the volume of the defect was calculated with the Microview imaging software. MicroCT volumetric measurements were considered the gold standard for volumetric measurements of lateral defects because high-resolution microCT has been previously validated for accurate analysis and measurement of mineralized tissues, including teeth and bones.
Teeth were gently and manually repositioned back into their sockets in the skulls. The teeth in the skulls were scanned by CBCT with the i-CAT imaging system (Imaging Sciences International, Hatfield, Pa). These teeth were scanned at low resolution (0.4-mm voxel) and high resolution (0.2-mm voxel) with the following specifications: 120 kVP, 18.66 mA (for the 0.4-mm scans), 36.52 mA (for the 0.2-mm scans), 0.5-mm focal spot, and 6-cm field of view. The acquisition times were 20 seconds for the 0.4-mm resolution and 40 seconds for the 0.2-mm resolution. After acquisition, the raw data were reconstructed and exported as digital imaging and communications in medicine (DICOM) files.
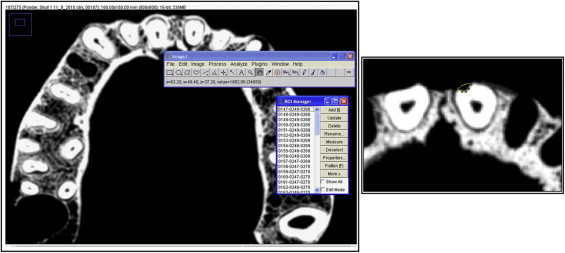
The DICOM files were imported into ImageJ software (National Institutes of Health, Bethesda, Md) for volumetric measurements of the lateral defects. The window level was set at 2395/647 so that pixel intensities above 800 were considered to be the tooth structure. As shown in Figure 3 , the ImageJ polygon tool was used to manually outline the areas of the root defects. The polygon tooth allows the user to outline irregularly shaped areas, as defined by a series of short line segments. Modifier keys were then used to alter the selection as needed, by deleting or adding new vertexes to the polygon. The area of the polygon was calculated by using the measurement tool. This process was performed for every axial slice of each defect, and the defect volume was then calculated.
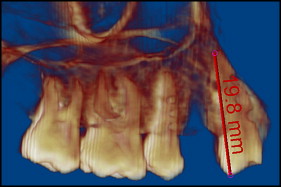
The DICOM files were imported into Dolphin Imaging Premium software (version 11.0; Dolphin Imaging Systems, Chatsworth, Calif) for linear measurements of the apical defects. The images were adjusted for improved quality by using the translucency and segmentation settings so that each root could be clearly identified, and these settings were held constant across the measurements. Portions of the skull were segmented out to focus on the tooth of interest. As shown in Figure 4 , after the most incisal landmark of the crown and the most apical landmark of the root were identified, linear measurements were calculated by using the Dolphin software. Linear measurements from the CBCT images of each apical defect were made by 2 independent examiners (S.N.P. and another).
Periapical radiographs of the teeth in the skulls were taken with F-speed film (Kodak, Rochester, NY) and the Gendex-Gx 770 intraoral x-ray system (Dentsply, Des Plaines, Ill) at 70 kVP, 7 mA, and 0.40-second exposure time. For calibration, a 20-mm, .032-in round stainless steel wire was adhered to the film parallel to each tooth. The periapical radiographs were taken by using the paralleling technique, in which the film was aligned parallel to the long axis of the tooth, and the x-ray tube was directed at a right angle to the film. After film development, linear measurements of tooth length were made with a digital caliper by placing the films on a light box. The landmarks for these measurements were the most incisal portion of the crown and the most apical portion of the root apex. Digital caliper measurements of tooth lengths from the periapical radiographs were repeated, and the average of the 2 measurements was used in the final analysis.
The lengths were measured on each tooth before and after removal of apical root structure with a digital caliper (Fowler/Sylvac Ultra-Cal III; Fred V. Fowler, Newton, Mass), which provided measurements accurate to within 0.01 mm. Linear measurement landmarks were the most incisal portion of the crown and the most apical aspect of the root. Digital caliper linear measurements of each tooth by each examiner were repeated, and the average of the 2 measurements was used in the final analysis. These digital caliper linear measurements were considered to be the gold standard for the linear measurement of apical defects.
Statistical analysis
For the volumetric measurements, descriptive statistics including the mean difference from the microCT measurements, the standard deviation of the mean difference, the mean of the absolute value of difference, and the standard deviation of the absolute value of difference were calculated. The Bland-Altman analysis was used to compare the CBCT volumetric measurements with the microCT volumetric measurements for all defects, and separately for the large and small defects. The data set was then transformed by taking the square root of the absolute difference between the CBCT and the microCT measurements for subsequent analyses of lateral defect measurements. Post-hoc statistical analyses were performed on the square-root transformed data, and all tests for normality were nonsignificant, indicating that the data set was normal. To compare volumetric measurement accuracy from high- and low-resolution CBCT scans and to establish defect parameters that significantly influence volumetric measurement accuracy, a linear mixed model was used for statistical comparisons between groups. Nonpaired t tests assuming unequal variances were also performed on the square roots of the measured defect volumes (variances for large lateral defects were different from variances for small lateral defects), to determine whether microCT, high-resolution CBCT, and low-resolution CBCT images can be used to distinguish between small and large lateral defect volumes.
For linear measurements of the apical defects, descriptive statistics including means, medians, 25th percentiles, 75th percentiles, and standard deviations of the absolute value of differences in measurement from the digital caliper measurements were calculated and presented as a box and whisker plot. The data set was then transformed by taking the square root of the mean of the absolute difference between the CBCT and the periapical measurements and the digital caliper measurements for all subsequent analyses on apical defect measurements. Post-hoc statistical analyses were performed on the square root transformed data, and all tests for normality were nonsignificant, indicating that the data set was normal. To compare linear measurement accuracy from high-resolution CBCT scans, low-resolution CBCT scans, and periapical radiographs, and to determine whether defect severity can significantly influence linear measurement accuracy, a linear mixed model was used for statistical comparisons between the groups. Because the variance was greater for the linear measurements made from the periapical radiographs than from the CBCT scans, variances were allowed to differ in the statistical analysis.
The Pearson correlation coefficient, standard error, and confidence intervals at the 95% confidence level were used to compare intraexaminer measurements and interexaminer measurements and to determine interclass and intraclass reliabilities. Post-hoc power analyses were performed for both volumetric and linear measurements to establish the sufficiency of the sample sizes.
Results
Volumetric measurements of lateral defects from the microCT images ranged in size from 0.82 to 3.93 mm 3 . Volumetric measurements from the different imaging modalities were not systematically different; some measurements were larger and some were smaller when comparing measurements from the different types of scans. Therefore, absolute values of the differences in measurements were calculated, and the mean of the absolute value of the difference between measurements from the different scan types was considered to be the relevant statistical comparison.
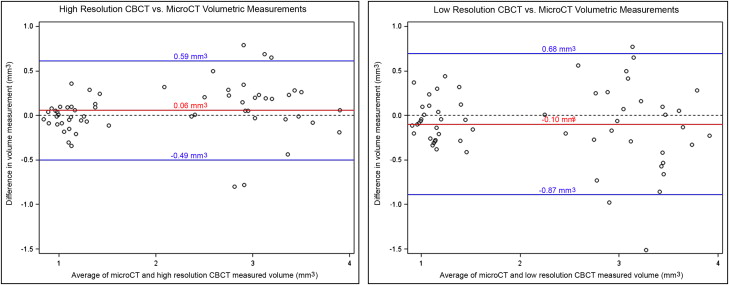
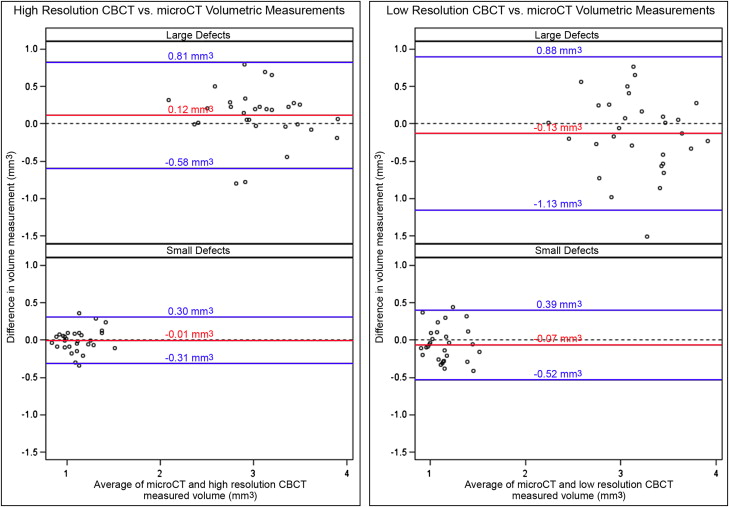
Because correlation values comparing measurements made with different techniques can be misleading, the Bland-Altman analysis was used to compare both high- and low-resolution CBCT volumetric measurements with the microCT volumetric measurements ( Fig 5 ). This analysis demonstrated that volumetric measurements generated from high-resolution CBCT images are closer in value to those generated from microCT images than are volumetric measurements generated from low-resolution CBCT images (high-resolution CBCT mean difference from microCT = 0.06 mm 3 with 95% limits of agreement at −0.49 to 0.59; low-resolution CBCT mean difference from microCT = −0.10 mm 3 with 95% limits of agreement at −0.87 to 0.68). This effect was consistent, regardless of defect size ( Fig 6 ; high-resolution CBCT mean difference from microCT for large defects = 0.12 mm 3 with 95% limits of agreement at −0.58 to 0.81; low-resolution CBCT mean difference from microCT for large defects = −0.13 mm 3 with 95% limits of agreement at −1.13 to 0.88; high-resolution CBCT mean difference from microCT for small defects = −0.01 mm 3 with 95% limits of agreement at −0.31 to 0.30; low-resolution CBCT mean difference from microCT for small defects = 0.07 mm 3 with 95% limits of agreement at −0.52 to 0.39). Analysis of variance (ANOVA) comparing all lateral defects measured from high-resolution vs low-resolution CBCT scans also confirmed that the volumetric measurements of the lateral defects from high-resolution CBCT scans were significantly more accurate than those from low-resolution CBCT scans ( P = 0.002, Table I ).
| Mean difference from microCT measurements ± SD | Mean of the absolute difference from microCT measurements ± SD | ANOVA t statistic (degrees of freedom) | P value | |
|---|---|---|---|---|
| Low resolution | −0.10 ± 0.40 mm 3 | 0.30 ± 0.27 mm 3 | 3.29 (59) | 0.002 ∗ |
| High resolution | 0.06 ± 0.28 mm 3 | 0.20 ± 0.20 mm 3 |
| ANOVA F statistic (degrees of freedom) | P value | |
|---|---|---|
| Resolution | 10.83 (1,48) | 0.002 ∗ |
| Size of defect | 14.87 (1,48) | 0.0003 ∗ |
| Resolution × size | 0.01 (1,48) | 0.941 |
| Lateral position | 0.01 (1,48) | 0.941 |
| Resolution × lateral position | 0.12 (1,48) | 0.727 |
| Size of defect × lateral position | 2.77 (1,48) | 0.102 |
| Vertical position | 2.31 (2,48) | 0.111 |
| Resolution × vertical position | 3.36 (2,48) | 0.043 ∗ |
| Size of defect × vertical position | 4.67 (2,48) | 0.014 ∗ |
| Mean difference from microCT measurements ± SD | Mean of the absolute difference from microCT measurements ± SD | ANOVA F statistic (degrees of freedom) | P value | |
|---|---|---|---|---|
| Large size | 0.12 ± 0.35 mm 3 | 0.28 ± 0.25 mm 3 | 9.15 (1,48) | 0.004 ∗ |
| Small size | −0.01 ± 0.16 mm 3 | 0.12 ± 0.10 mm 3 | ||
| Apical position | 0.12 ± 0.29 mm 3 | 0.23 ± 0.21 mm 3 | 0.68 (2,48) | 0.509 |
| Middle position | −0.03 ± 0.33 mm 3 | 0.21 ± 0.25 mm 3 | ||
| Coronal position | 0.08 ± 0.20 mm 3 | 0.16 ± 0.14 mm 3 | ||
| Buccal position | 0.07 ± 0.25 mm 3 | 0.19 ± 0.17 mm 3 | 0.02 (1,48) | 0.875 |
| Lingual position | 0.04 ± 0.31 mm 3 | 0.20 ± 0.23 mm 3 | ||
| Defect size × defect lateral position | 1.82 (1,48) | 0.183 | ||
| Defect size × defect vertical position | 1.80 (2,48) | 0.176 | ||
| Defect lateral position × defect vertical position | 0.15 (2,48) | 0.865 | ||
| Defect size × defect lateral position × defect vertical position | 0.46 (2,48) | 0.634 | ||
| Mean difference from microCT measurements ± SD | Mean of the absolute difference from microCT measurements ± SD | ANOVA F statistic (degrees of freedom) | P value | |
|---|---|---|---|---|
| Large size | −0.13 ± 0.51 mm 3 | 0.40 ± 0.34 mm 3 | 8.65 (1,48) | 0.005 ∗ |
| Small size | −0.07 ± 0.23 mm 3 | 0.20 ± 0.13 mm 3 | ||
| Apical position | 0.06 ± 0.35 mm 3 | 0.27 ± 0.94 mm 3 | 4.79 (2,48) | 0.012 ∗ |
| Middle position | −0.25 ± 0.52 mm 3 | 0.44 ± 0.37 mm 3 | ||
| Cervical position | −0.10 ± 0.21 mm 3 | 0.20 ± 0.12 mm 3 | ||
| Buccal position | −0.07 ± 0.35 mm 3 | 0.28 ± 0.22 mm 3 | 0.08 (1,48) | 0.775 |
| Lingual position | −0.12 ± 0.44 mm 3 | 0.32 ± 0.32 mm 3 | ||
| Defect size × defect lateral position | 1.5 (1,48) | 0.226 | ||
| Defect size × defect vertical position | 5.11 (2,48) | 0.010 ∗ | ||
| Defect lateral position × defect vertical position | 0.42 (2,48) | 0.657 | ||
| Defect size × defect lateral position × defect vertical position | 0.14 (2,48) | 0.869 | ||
Because a comparison of volumetric measurements of lateral defects by scan resolution, defect size, vertical defect position, and buccal vs lingual defect positions showed that the size of the defect, the vertical position combined with scan resolution, and the vertical position combined with defect size were also significant contributors to volumetric measurement differences ( Table II ), we next compared defects in the scan resolutions to better understand these effects.
The mean of the absolute difference between high-resolution CBCT and microCT volumetric measurements was lower for smaller defects than larger defects, and this difference was statistically significant (0.12 ± 0.10 vs 0.28 ± 0.25 mm 3 ; P = 0.004) ( Table III ). The mean of the absolute difference between high-resolution CBCT and microCT volumetric measurements was not statistically significant for the vertical position of the defect (apical, 0.23 ± 0.21 mm 3 ; middle, 0.21 ± 0.25 mm 3 ; coronal, 0.16 ± 0.14 mm 3 ; P = 0.509). The mean of the absolute difference between high-resolution CBCT and microCT volumetric measurements was also not statistically significant for defects located in the buccal vs lingual positions (0.19 ± 0.17 vs 0.20 ± 0.23 mm 3 ; P = 0.875). Interactions between variables were also not significant. Overall, these data indicate that the measurement of small lateral defects from high-resolution CBCT images is more accurate than that of large lateral defects, and that defect position does not significantly influence lateral defect volumetric measurements from high-resolution CBCT scans.
The mean of the absolute difference between low-resolution CBCT and microCT volumetric measurements was lower for smaller defects than for larger defects, and this difference was statistically significant (0.20 ± 0.13 vs 0.40 ± 0.34 mm 3 ; P = 0.005) ( Table IV ). The mean of the absolute difference between low-resolution CBCT and microCT volumetric measurements was also statistically significant for the vertical position of the defect (apical, 0.27 ± 0.94 mm 3 ; middle, 0.44 ± 0.37 mm 3 ; coronal, 0.20 ± 0.12 mm 3 ; P = 0.012). Tukey adjustments for multiple comparisons indicated that the effect of the vertical defect position came from a difference in volumetric measurement accuracy of defects located in the middle third of the root compared with defects in the coronal third of the root ( P = 0.013). The mean of the absolute difference between high-resolution CBCT and microCT volumetric measurements was not statistically significant for defects located in the buccal vs lingual positions (0.28 ± 0.22 vs 0.32 ± 0.32 mm 3 ; P = 0.775). Interestingly, the interaction between defect size and defect vertical position was also significant ( P = 0.01). From our analysis, it appears that large lateral defects in the middle vertical root position are more difficult to quantify than small lateral defects in the middle vertical root position (Tukey adjusted P = 0.0002). Interactions between other variables were not significant. Overall, these data indicate that the measurement of small lateral defects from lower-resolution CBCT images is more accurate than that of large lateral defects, and that the vertical position of the defect also significantly influences lateral defect volumetric measurements from low-resolution CBCT scans.
Although our results indicate that volumetric measurements of lateral root defects from high-resolution CBCT scans are more accurate than those of lateral root defects from low-resolution CBCT scans, a review of the raw data suggested that both low- and high-resolution CBCT images can be used to distinguish small lateral defects (about 1 mm 3 ) from more moderate lateral defects (about 3 mm 3 ). Nonpaired t tests performed on volumetric measurement data confirmed that images from either high- or low-resolution CBCT scans can be used to distinguish between defects of approximately 1 mm 3 and those of approximately 3 mm 3 ( Table V ).


