Introduction
The aim of this study was to evaluate the primary stability and the histomorphometric measurements of self-drilling and self-tapping orthodontic microimplants and the correlations between factors related to host, implant, and measuring technique.
Methods
Seventy-two self-drilling and self-tapping implants were placed into bovine iliac crest blocks after computed tomography assessments. Insertion torque values, subjective assessments of stability, and Periotest (Medizintecknik Gulden, Modautal, Germany) measurements were performed for each implant. Twelve specimens of each group were assigned to histologic and histomorphometric assessments.
Results
The differences between insertion torque values, most Periotest values, and subjective assessments of stability scores were insignificant ( P >0.05). The bone-implant contact percentage of the self-drilling group (87.60%) was higher than that of the self-tapping group (80.73%) ( P <0.05). Positive correlations were found between insertion torque value, cortical bone thickness, and density in both groups ( P <0.05). Negative correlations between insertion torque values and Periotest values were mostly observed in the self-drilling group ( P <0.05). Positive correlations were found between bone-implant contact percentages, cortical bone densities, and insertion torque values in both groups ( P <0.05). The differences between insertion torque values and corresponding subjective assessments of stability scores were different in both groups ( P <0.05).
Conclusions
The differences in insertion torque values, Periotest values, and subjective assessments of stability scores of self-drilling and self-tapping implants were insignificant. Self-drilling implants had higher bone-implant contact percentages than did self-tapping implants. Significant correlations were found between parameters influencing the primary stability of the implants.
Orthodontic microimplants provide absolute anchorage with predictable survival rates in the low-compliance treatment of patients. Because of the growing need toward immediate loading, the primary stability of orthodontic implants is of utmost importance. Primary implant stability is a prerequisite for achievement and maintenance of osseointegration. It depends on the mechanical engagement of an implant with bone of the osteotomy. After implant surgery, this mechanical stability is gradually replaced by biologic stability (secondary stability). Implant stability, an indirect sign of skeletal tissue integration, is a measure of clinical implant mobility. Whereas optimum implant stability refers to the lack of “clinical” mobility, this does not necessarily imply the absence of micromotion or displacement in any direction at the microscale.
Currently, Periotest (Medizintecknik Gulden, Modautal, Germany), cutting-torque, and resonance-frequency analysis are the most frequently used techniques for noninvasive quantitative assessment of implant stability. Periotest is an electronic instrument, originally developed to measure the damping characteristics of the periodontal ligament around natural teeth. It has been also used to assess mobility of dental and orthodontic implants. In essence, it measures predominantly the natural frequency and, to a lesser extent, the damping characteristics of the tooth or the bone-implant interface. The outcome is displayed digitally and audibly as a “descriptive” numeric value (Periotest value). This value is between –8 and +8 for implants. The force used to insert a dental implant is described as cutting or insertion torque. The amount of insertion torque relies on site-specific properties of bone tissue, such as the thickness of the cortical bone and the density of the bone, the macro-design of the implant, and the difference between the diameters of the implant and the fresh surgical implant socket. Resonance-frequency analysis is also a noninvasive and nondestructive method for quantitative measurement of primary stability and osseointegration. Resonance-frequency analysis measurements have been used to document time-dependent healing changes along the dental implant-bone interface by measuring the increase or decrease in its stiffness. Moreover, the technique has been used to determine the appropriate timing of loading and to identify at-risk implants. Nevertheless, there are no available transducers suitable for orthodontic microimplants; therefore, resonance-frequency analysis is only used in experimental orthodontic studies. Beyond these techniques, subjective assessment of primary stability is another method that relies on the tactile sensation of the surgeon, who scores the primary stability—ie, good, moderate, or poor—with regard to the resistance of the implant being inserted. So far, this method has not been used extensively on implants, because it is not an objective method that provides a quantitative assessment. Its reliability and correlation with the outcome of noninvasive techniques is still under consideration.
The primary stability of orthodontic microimplants relies on several critical parameters. Because the subject-specific and site-specific structural and mechanical properties of bone tissue can exhibit great variations, the thickness of the cortical bone, the density of the cancellous bone, the bone mineral content, and the histomorphometric bone-implant contact might affect implant stability. Moreover, the macro-design, diameter, and shape of the implant, the technique of implant placement (self-drilling vs self-tapping), the diameter of the pilot drill, and the intraosseous insertion angle of the implant are frequently cited as factors that influence the primary stability of implants and screws. Since orthodontic mini-implants and microimplants that are 6 to 8 mm long are usually angulated in bone with 1 to 2 mm of cortical bone thickness, it is unclear whether it is the protocol of placement (self-drilling or self-tapping) or the macro-design of the implant (tapered vs cylindrical implant body) that influences the magnitude of insertion torque and the resultant primary stability. In addition, correlations between factors influencing the stability of orthodontic implants and measuring techniques have not been thoroughly explored. The purposes of this study were to compare the primary stability of self-drilling and self-tapping orthodontic microimplants by using insertion torque measurements and Periotests and to explore the validity of subjective assessment of primary stability. It was hypothesized that microimplants having a similar macro-design would lead to similar primary stability regardless of the method (self-drilling vs self-tapping) of placement. In addition, the histomorphometric bone-implant contacts of the self-drilling and the self-tapping orthodontic microimplants were compared to evaluate their impact on primary stability. Finally, possible correlations between factors relating to host, implant, and measuring technique that influence primary stability were explored.
Material and methods
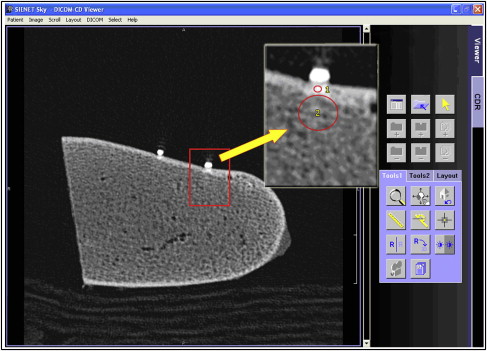
This study was approved by Başkent University institutional review board and ethics committee (project #D-DA10/01) in Ankara, Turkey, and supported by the Başkent University Research Fund. Sixteen bovine iliac crests were cut into 5 × 7-cm bone blocks under profuse saline-solution cooling. To undertake quantitative x-ray computed tomography measurements on the implant sites (n = 6 per each block), gutta-percha points (length, about 0.5 mm; diameter, 1 mm; number 15; SureDent, Kyeonggi-do, Korea) were bonded on the cortical surface of each bone block. The markers were used only to determine implant location and not as a comparative tool to measure bone thickness. Then, each bone block was scanned (150 mAS and 120 kV; 2002 MSCT, Somatom Sensation 16; Siemens, Erlangen, Germany), and cortical bone thickness in millimeters and cortical and trabecular bone densities in Hounsfield units were measured in 1-mm thick images ( Fig 1 ). The density measurements were normalized by using water as a material with standard density. A pilot study was undertaken on 4 bone blocks by using several microimplants to become accustomed to using the manual torque application wrench and to train for correlating subjective assessment scores with corresponding insertion torque amplitudes of the implants.
Seventy-two self-drilling and self-tapping orthodontic microimplants (diameter 1.4 × 7 mm; AbsoAnchor, Dentos, Daegu, Korea) were used. To place the implants at 30° to 40° insertion angles, the bone blocks were placed on the surveyor table of a milling machine (Paraskop; Bego, Bremen, Germany). The self-tapping implants were inserted upon pilot hole drilling (diameter 1 mm; AbsoAnchor). Before placing the self-drilling implants, 0.5-mm deep dimples were created by the pilot drill, because high-insertion angles frequently result in slippage of self-drilling implants on the cortical bone. The implants of both groups were inserted on the milling machine by using the implant driver until the thread next to the collar was visible.
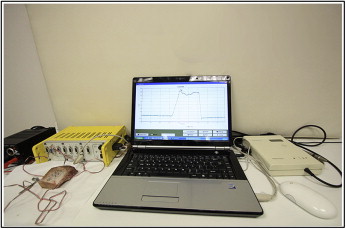
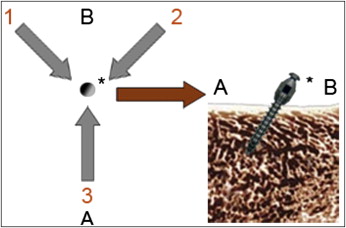
The primary stability assessments were undertaken blindly. The insertion torque value of each implant was measured during final torque tightening of the implant by using a strain-gauged manual torque application wrench connected to a data acquisition device (ESAM Traveller 1; Vishay Micromeasurements Group, Raleigh, NC). The strain-gauge signals of the wrench were delivered to the data acquisition unit at 10 KHz and displayed in computer software (ESAM; ESA Messtechnik, Olching, Germany). The technical details and calibration experiments of the wrench are explained elsewhere. In brief, the strain-gauge readings vs elicited torque were obtained, and a linear regression to data points was undertaken to determine the calibration constant, 0.126 Ncm per microstrain (μϵ) with R 2 = 0.99997. The strain data were converted to torque units (Ncm) by using the general formula: torque = K × μϵ, where K is the calibration constant, and ϵ is the strain-gauge reading. Simultaneously with the insertion torque experiments, the subjective assessment of primary stability of each implant was scored as good, moderate, or poor by the same trained operator (S.C.). An insertion torque higher than or equal to 8 Ncm was regarded as good, ≥5 to <8 Ncm was moderate, and <5 Ncm was poor. The examiner was not supposed to detect small differences in torque output, because the pilot study suggested that the operator cannot detect small differences less than a few newton centimeters of torque. Then Periotest measurements were made on each implant from 3 directions, approximately 120° apart on the horizontal plane ( Figs 2 and 3 ).
Twelve randomly selected implants of each group were assigned to histologic and histomorhometric evaluations. Three-millimeter thick bone segments that contained the microimplants were removed and fixed by immersion in 4% buffered formalin solution for 48 hours. In preparation for the ground sections, the bone segments were dehydrated in an ascending series of ethanol (70%-99.5%) and embedded in autopolymerized methylmethacrylate. Because of the relatively low diameter of the microimplants compared with conventional dental implants, the thickness of the blocks was reduced by successive abrasive papers (numbers 200-800) until midaxial sections of 50 μm were achieved. The sections were stained with trichrome and inspected in a light microscope for possible fractures of the peri-implant bone and its presence in the threads as a sequel of placement. Finally, the bone-implant contact of each implant was measured to compare the impact of the placement protocol.
Statistical analysis
To assess whether the data were normally distributed, the 1-sample Kolmogorov-Smirnov test was performed at the 95% CI level. Cortical bone thickness, Periotest 1, Periotest 2, and bone-implant contact percentage data of both groups were compared with the Mann-Whitney U test at the 95% CI level. Density of the cortical bone, density of the trabecular bone, insertion torque values, and Periotest 3 data of both groups were compared by independent t test at the 95% CI level. The subjective assessment data of both groups were compared with the chi-square test at the 95% CI level.
To explore possible correlations between parameters, the Pearson and Spearman (rho) correlation tests were performed at the 95% CI level. To identify whether subjective asessment scores differed with regard to the corresponding insertion torque values of the implants, the Kruskal-Wallis test was performed at the 95% CI level. Because P = 0.00 was found, further asssessments were performed by using the 2-sample Mann-Whitney U test at the 95% CI level.
Results
One-sample Kolmogorov-Smirnov test results are shown in Table I for intergroup comparisons. Bending or fracture of the implants was not observed in either group during placement. The implants of both groups were placed into bone blocks having similar characteristics. The differences in cortical bone thickness and trabecular bone density were insignificant in both groups ( P = 0.056 and P = 0.104, respectively), although slightly higher cortical bone density was observed in the self-tapping group ( P = 0.025). The differences in insertion torque values, and the Periotest 1 and Periotest 2 values, were insignificant in both groups ( P = 0.552, P = 0.136, and P = 0.15, respectively), although the Periotest 3 was higher is the self-tapping group ( P = 0.013). Likewise, the differences in subjective assessment scores were insignificant in both groups ( P = 0.324) ( Table II ).
| Cort thick (mm) | HU-cort | HU-trab | Torque (Ncm) | PTV 1 | PTV 2 | PTV 3 | |
|---|---|---|---|---|---|---|---|
| Self-drilling | |||||||
| Mean | 1.16 | 952.03 | 304.953 | 6.87 | −3.81 | −4.28 | −3.56 |
| SD | 0.17 | 294.22 | 69.72 | 2.36 | 1.95 | 2.06 | 2.10 |
| Kolmogorov-Smirnov Z | 1.012 | 0.460 | 0.591 | 0.799 | 1.210 | 1.512 | 1.335 |
| P value | 0.257 | 0.984 | 0.876 | 0.546 | 0.107 | 0.021 ∗ | 0.057 |
| Self-tapping | |||||||
| Mean | 1.289 | 1108.72 | 331.56 | 7.22 | −4.47 | −3.19 | −1.92 |
| SD | 0.329 | 287.61 | 67.37 | 2.57 | 1.83 | 2.86 | 3.23 |
| Kolmogorov-Smirnov Z | 2.086 | 0.756 | 0.703 | 0.742 | 1.682 | 1.085 | 0.788 |
| P value | 0.000 ∗ | 0.618 | 0.707 | 0.641 | 0.007 ∗ | 1.190 | 0.563 |
| Score | Total | |||
|---|---|---|---|---|
| Good | Moderate | Poor | ||
| Self-drilling | ||||
| Count (n) | 11 | 7 | 18 | 36 |
| Within implant (%) | 30.6 | 19.4 | 50 | 100 |
| Self-tapping | ||||
| Count (n) | 13 | 11 | 12 | 36 |
| Within implant (%) | 36.1 | 30.6 | 33.3 | 100 |
| Total | ||||
| Count (n) | 24 | 18 | 30 | 72 |
| Within implant (%) | 33.3 | 25 | 41.7 | 100 |
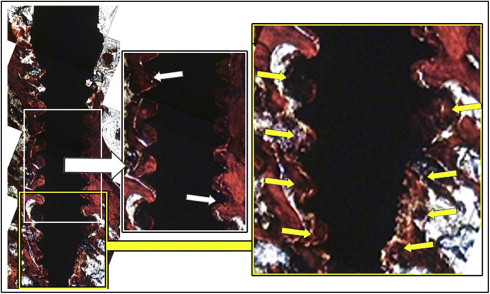
As a sequel of placement, fracture of the upper part of the cortical bone was clinically discernable for some self-drilling implants. At the histologic level, however, it was observed that implants of both groups were associated with such fractures ( Fig 4 ). All implants showed intimate contact with cortical bone, which was also fractured toward cancellous bone in many sections. In addition, the threads of all implants were partly filled with fractured local trabeculae. The apical zone of the self-drilling implants showed more deposition of fractured trabecular bone than did the self-tapping implants. The mean and standard deviation of bone-implant contact percentage of the self-drilling group (87.60; SD, 6.20) were higher than those of the self-tapping group (80.73; SD, 8.58) ( P = 0.046) ( Fig 5 ).