Introduction
The goal of this study was to develop a more accurate formula to forecast tooth-size discrepancies in patients based on not only the size of the whole teeth but also functional arch components derived from normal cusp-fossa interdigitation that should be obtained as the final treatment goal.
Methods
A total of 141 dental casts from Dr Larry Andrews’ collection of “normal occlusions” that never received orthodontic treatment were scanned with an Ortho Insight 3D Laser Scanner (Motion View Software, Chattanooga, Tenn). Individual tooth sizes and portions of tooth sizes were measured with the Motion View Software. For each set of models, potential tooth-size discrepancies were calculated by using both the original Bolton analysis and the new Johnson/Bailey analysis developed by this team at the University of California at San Francisco (UCSF). Six tooth-size discrepancy ratios were computed and included the Bolton (2) and the new (4) Johnson/Bailey analysis ratios for the anterior arch component, posterior arch component, and overall ratio of the maxillary and mandibular arches. The Johnson/Bailey analysis utilized different landmarks and groups of teeth. It consequently divided the maxillary segment by the mandibular segment, in contrast to the Bolton ratios, which divided the mandibular sums by the maxillary totals.
Results
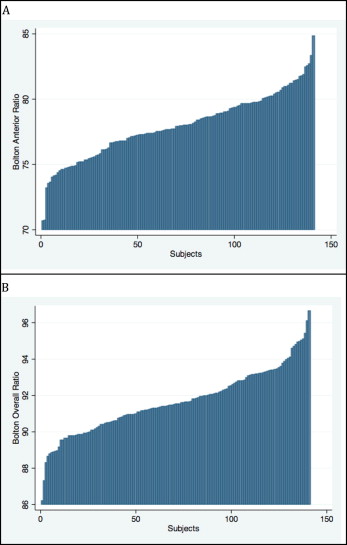
The Bolton anterior segment ratio ranged from 70.68 to 84.81, with a mean of 77.91 (SD, 2.43) (3.1%). The Bolton overall ratio ranged from 86.19 to 96.62, with a mean of 91.64 (SD, ±1.74) (1.8%). The Johnson/Bailey posterior discrepancy ratio ranged from 0.98 to 1.23, with a mean of 1.10 (SD, ±0.04) (3.6%). Its anterior discrepancy ratio ranged from 0.91 to 1.14, with a mean of 1.03 (SD, ±0.04) (3.9%). The Johnson/Bailey overall discrepancy ratio ranged from 0.98 to 1.15, with a mean of 1.06 (SD, ±0.03) (2.8%).
Conclusions
Two methods were used to forecast tooth-size discrepancies between opposing arches in a sample with clinically acceptable occlusions. The new approach provided more specific ratios utilizing more clinically relevant functional arch components derived from dental cusp-fossa interdigitation.
A tooth-size discrepancy is defined as a lack of harmony between the mesiodistal widths of individual teeth or groups of teeth when related to their functional counterparts of the opposing arch. Any discrepancy will result in either spacing in 1 arch or a compromise in functional relationships. To achieve good occlusion with the correct overbite and overjet, the maxillary and mandibular teeth must be proportional in size to each other. The mesiodistal widths of teeth were first formally investigated by Black in 1902. He measured large numbers of teeth and produced tables of mean dimensions that are still used as references today.
Many authors have studied tooth widths in relation to occlusion after Black’s investigation. Bolton to date has provided the best-known studies of tooth-size discrepancies in relation to orthodontic treatment goals. He evaluated tooth-size relationships of 55 subjects with excellent occlusions and developed 2 ratios for estimating tooth-size discrepancy.
The Bolton anterior ratio is the sum of all 6 anterior mandibular teeth (canines and incisors) divided by the sum of all 6 anterior maxillary teeth (canines and incisors), multiplied by 100.
The Bolton overall ratio is the sum of all 12 mandibular teeth (first molars, premolars, canines, and incisors) divided by the sum of all 12 maxillary teeth (first molars, premolars, canines, and incisors), multiplied by 100.
Currently, a tooth-size discrepancy is commonly assessed via the Bolton analysis. It allows the clinician to gain foresight into the final fit of the maxillary and mandibular arches before actually treating a patient, without resorting to a physical diagnostic setup (teeth set in wax to an ideal occlusion). A patient who did not match the suggested Bolton ideal ratios was, most probably, expected to have either a tooth-size excess or deficiency in 1 dental arch. The amount of ratio deviation indicates the size of the future difference between the teeth in the 2 arches.
It can be argued, however, that a flaw of the Bolton analysis is that it does not take the functional relationships of individual teeth in centric occlusion into account when selecting how to segment an arch into measurement components. Angle, in his classification system (Class I, Class II, and Class III), relied on the description of the relationships of cusps, fossae, contacts, and grooves in a normal occlusion. Andrews also stressed these relationships in his “6 keys of occlusion.” The Bolton analysis does not take into account the cusp/groove/fossa relationships. The Bolton anterior analysis compares the total widths of all 6 anterior maxillary teeth with the total widths of all 6 anterior mandibular teeth. This approach ignores how the teeth fit and function. From the functional point of view, only the sum of the mesial half of both maxillary canines and the widths of the 4 maxillary incisors should be compared with their lower functional counterparts, which is the sum of the mandibular canines and incisors. The distal half of the maxillary canine functions with the mandibular posterior teeth, not with the anterior teeth. From a functional view, the sum of the distal half of the maxillary canine, and the widths of both maxillary premolars and the mesial half of the mesiobuccal cusp of the maxillary first molars should be compared with the sum of the widths of the 2 mandibular premolars and the mesial portion of the mandibular first molar (from its mesiobuccal groove forward). The fundamental difference between the landmarks of the Bolton analysis and the landmarks orthodontists use to assess and relate the functional fit of the maxillary and mandibular teeth creates a potential problem. This was pointed out in several other studies.
Furthermore, the Bolton analysis was derived from a small sample of 55 subjects with “excellent occlusions.” Numerous studies have outlined the inherent variations in natural occlusion in populations. Smith et al stated that the parameters considered normal for the Bolton index can only be applied to white female subjects, and that significant differences exist in the overall, anterior, and posterior interarch ratios between white, black, and Hispanics. Some people suggest that population-specific standards are necessary for clinical assessments. Other authors found that discrepancies, when using the Bolton index, are seen more frequently in patients with Class III malocclusions; this alluded to the inherent tooth-size discrepancies between different malocclusion groups. A literature review by Othman and Harradine stated that the Bolton standard deviation is probably not a good guide to the prevalence of a clinically significant tooth-size discrepancy in the general population.
Material and methods
This was a retrospective study of a group of untreated subjects who had been evaluated and selected by Dr Larry Andrews of San Diego, Calif, to represent an orthodontically untreated population with “ideal occlusions.” Each subject was represented by unmounted study casts. No x-ray records were available.
The inclusion criteria required each subject to have complete dentition with or without third molars, no remaining deciduous teeth, and a symmetric mandible. Excluded were subjects with any missing teeth, mandibular pathology, syndrome or disease that could affect muscular skeletal function or development (eg, temporomandibular disorder or rheumatoid arthritis), obvious periodontal disease, or previous orthodontic treatment. Subjects were not excluded based on molar relationship or sagittal skeletal relationship, unless the deviations from normal were due to mandibular problems. One hundred forty-one subjects from more than 500 met the inclusion criteria for this retrospective study. All were included in this study. Institutional review board approval from the University of California’s Committee on Human Research was not required, since the dental models had no patient identifiers.
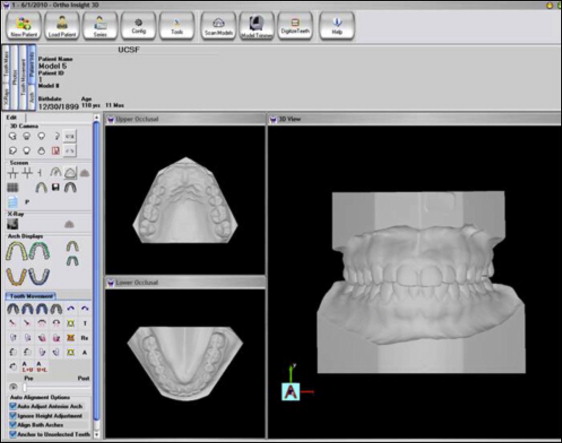
All 141 study models were scanned with a 3D laser scanner (Ortho Insight 3D Laser Scanner; Motion View Software, Chattanooga, Tenn). Each maxillary and mandibular cast was scanned individually. In addition, 7 two-dimensional photographs of each set of casts were taken. The scanner scanned at a resolution of 35 to 40 μm. The robotic table and scanning arms offered 3 axes of motion and 6 degrees of freedom. There were 3 line-generation lasers and 1 industrial-level camera to capture the laser data. The scanner had a maximum scan volume of 4 × 4 × 2 in. Scan time was 2.5 minutes for each cast, although 1.5 minutes is now possible by using the updated Ortho Insight 3D software.
The Ortho Insight 3D software was used to reconstruct the casts and measure tooth sizes and distances on each virtual cast. The software was used to occlude the models, digitize the teeth, separate the teeth, detect landmarks, establish facial axis, and measure the mesiodistal widths of each tooth ( Fig 1 ; Table I ). A custom algorithm to measure tooth widths by using specified landmarks for both the Bolton index and the Johnson/Bailey index was designed by the investigator and coded by the lead engineer at Motion View Software. This algorithm was then debugged and verified by an investigator (E.B.). The measurement algorithm is described in greater detail below.
| Site | Definition |
|---|---|
| Cusp tip | Apex (most incisal/occlusal point) of the crown as it lies on the axis of the tooth |
| Virtual occlusal plane | Flat occlusal plane computed from all maxillary and mandibular cusps |
| Maxillary left posterior segment | Total distance between the maxillary left canine tip and the mesiobuccal cusp tip of the maxillary left first molar |
| Maxillary right posterior segment | Total distance between the maxillary right canine tip and the mesiobuccal cusp tip of the maxillary right first molar |
| Maxillary anterior segment | Distance between the maxillary canine cusp tips including all incisors |
| Mandibular left posterior segment | Distance between the mesial contact point of the mandibular left first premolar to the mesiobuccal groove between the mesial and middle cusps of the mandibular left first molar |
| Mandibular right posterior segment | Distance between the mesial contact point of the mandibular right first premolar to the mesiobuccal groove between the mesial and middle cusps of the mandibular right first molar |
| Mandibular anterior segment | Distal contact point of the mandibular canine to the distal contact point of the contralateral canine |
Because of the lack of wax bites for the models in the Andrews’ collection, an alternative method for occluding models was accomplished with the Ortho Insight 3D software. The steps for modeling articulation were used as outlined by the Ortho Insight 3D Manual. Two additional steps were added by an investigator (E.B.). The “snap to fit” function was used to occlude the models farther into maximum intercuspation. The final software-generated occlusion was verified and adjusted by comparing it with the 2-dimensional photographs of the articulated casts.
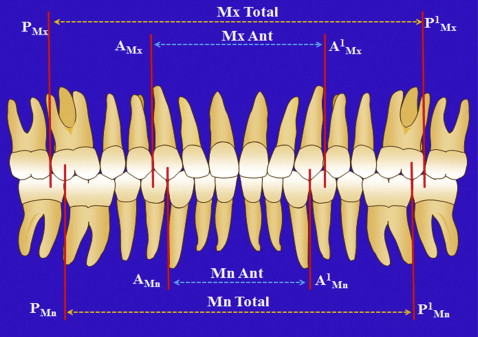
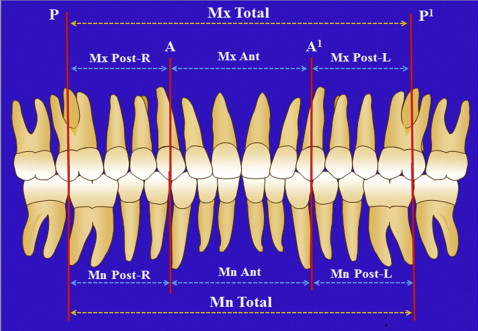
A tooth’s mesiodistal width was defined as the maximum side-distal distance between the anatomic contact points when the teeth are aligned. These measurements were made parallel to the virtual occlusal plane. The cusp tip of the maxillary canine is usually considered the apex (most incisal point) of the crown. Since the data were collected from cast models and roots were not available as measurement landmarks, the cusp tip was defined according to the Andrews’ guidelines. The mesiobuccal cusp tip of the maxillary molar was defined as the apex (most occlusal point) of the mesiobuccal cusp. The different segments were then defined for both the Bolton and Johnson/Bailey analyses ( Figs 2 and 3 ). The mesiobuccal groove of the mandibular first molar was the lingually inclined vertical groove on the labial side, which divides the mesial cusp from the distal cusp.
A virtual occlusal plane was established as the “best fit” by using all the cusp tips of the occluded models. It was refined and adjusted by optimizing its position so that the sum of the squares of the distance that each cusp deviated from the occlusal plane was minimized, much like an optimized average line on a scattergram. The resulting virtual occlusal plane was the surface on which all distance measurements were made.
Every measurement landmark of interest had a line projected from it perpendicular to the virtual occlusal plane. All distance measurements were made from these projected intersection points on the virtual occlusal plane surface. Mesiodistal tooth width measurements were made between intersection points of perpendicular projections from the mesial and distal contact points to the virtual occlusal plane.
Measurement of just a portion of the total mesiodistal tooth widths had to be handled differently. First, a line was constructed on the virtual occlusal plane from the mesial contact point projection to the distal contact point projection as described above. For the maxillary canines and molars, a second line was constructed on the virtual occlusal plane, from the cusp tip projection intersection point perpendicular to the mesiodistal contact line ( Fig 4 , dotted red line ). For the maxillary canines, this line served to separate the total canine width into anterior and posterior segments that belonged to the 2 separate functional segments. For the maxillary molars, this line divides the total constructed mesiodistal distance into mesial and distal segments. The mesial segment was added to the maxillary premolar widths and the distal portion of the maxillary canine creating the entire posterior segment.
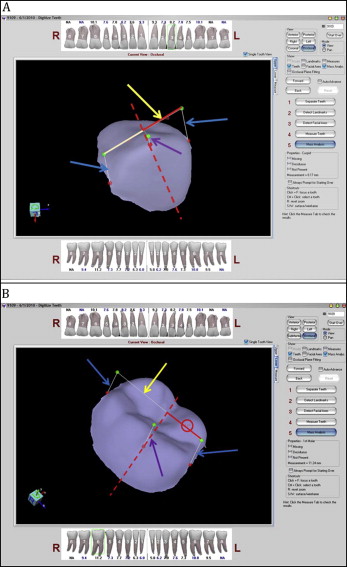
For the mandibular first molars, a line was first constructed on the virtual occlusal plane from the mesial contact point projection to the distal contact point projection. A second line was projected from the buccal groove perpendicular to and intersecting the virtual occlusal plane surface. Then, a third line was constructed from the buccal groove intersection point (on the virtual occlusal plane) perpendicular to the molar’s mesiodistal line on the virtual occlusal plane. This line splits the molar’s mesiodistal width into 2 distinct sections. The mesial section is the portion of the mandibular molar width to be included with the mandibular premolars in the calculation of the lower posterior segment.
The Johnson/Bailey formula divides the arches into functional segments, which are more closely related to the static and functional occlusal goals that should be achieved after orthodontic treatment. We separately measured and compared the functional components of the maxillary and mandibular arches via the anterior discrepancy ratio and the posterior discrepancy ratio. The overall discrepancy ratio is derived by dividing the sum of the 3 maxillary segments by the sum of the 3 mandibular segments ( Table II ).
| Ratio | Definition |
|---|---|
| Posterior discrepancy ratio | Dividing the maxillary posterior left and right segments by both mandibular posterior right and left segments |
| Anterior discrepancy ratio | Dividing the maxillary anterior segment by the mandibular anterior segment |
| Overall discrepancy ratio | Dividing the maxillary anterior segment and the maxillary posterior left and right segments by the mandibular anterior segment and the mandibular posterior left and right segments |
The posterior discrepancy ratio-left is determined as follows: maxillary posterior segment-left divided by mandibular posterior segment-left.
The posterior discrepancy ratio-right is determined as follows: maxillary posterior segment-right divided by mandibular posterior segment-right.
The anterior discrepancy ratio is the maxillary anterior segment divided by mandibular anterior segment.
The overall discrepancy ratio is determined as follows: maxillary posterior segment-left plus posterior segment-right plus anterior segment divided by mandibular posterior segment-left plus posterior segment-right plus anterior segment.
Note that the Johnson/Bailey maxillary arch sums are divided by the mandibular arch sums. The Bolton analysis does the opposite. The ratio 1.00 equals parity. Ratios higher than 1.00 usually indicate a maxillary segment excess or a mandibular segment deficiency.
Before manual verification in single-tooth mode, the teeth were digitized and virtually separated, and landmarks were identified according to the steps described in the Ortho Insight 3D manual. Landmarks were then manually verified twice, in single-tooth mode, on every tooth on every model. Distances were calculated automatically by using our modified Ortho Insight 3D software. The individual tooth measurements were measured within 0.01 mm by using the digitized models and Ortho Insight 3D software. To test reliability, measurements were repeated 3 times on 5 casts by 5 investigators, and the coefficient of variation (standard deviation/mean) was a mean of 0.02, indicating that having an investigator use the Ortho Insight 3D system with the same dental models produces highly reproducible numbers related to the width of the dentition and with a coefficient of variation much smaller than that demonstrated with the actual analysis of the sample.
Statistical analysis
The individual tooth measurements were used in the Bolton anterior and overall ratios as well as the Johnson/Bailey posterior discrepancy ratio, anterior discrepancy ratio, and the overall discrepancy ratio. The means, medians, standard deviations, ranges, and 25 and 75 percentiles were determined for the 6 ratios. The histogram distribution and ranking of the measurements in each ratio were also calculated for this sample.
Results
The range of the Bolton analysis for the anterior ratio was 70.90 to 84.82, with a mean of 77.91 (SD, ±2.43). The overall ratio varied from 86.19 to 96.62 with a mean of 91.64 (SD, ±1.74) ( Fig 5 ; Table III ). The difference of the overall ratio for each subject varied positively and negatively with as much as a 5-mm difference between individual patients and the ideal Bolton ratio ( Fig 6 ). The Bolton anterior and overall ratio distributions are represented in Figure 7 , and the central tendency is shown in the box plot ( Fig 8 ).
| Subject | Maxilla 3-3 (mm) | Mandible 3-3 (mm) | Bolton anterior ratio | Maxilla 6-6 (mm) | Mandible 6-6 (mm) | Bolton overall ratio |
|---|---|---|---|---|---|---|
| 1 | 45.55 | 35.94 | 78.90 | 91.27 | 82.42 | 90.30 |
| 2 | 48.34 | 36.80 | 76.13 | 96.55 | 87.60 | 90.73 |
| 3 | 49.89 | 38.43 | 77.03 | 100.88 | 90.42 | 89.63 |
| 4 | 45.54 | 36.74 | 80.68 | 93.94 | 85.44 | 90.95 |
| 5 | 46.71 | 36.93 | 79.06 | 96.49 | 88.89 | 92.12 |
| 6 | 48.86 | 40.00 | 81.87 | 99.76 | 92.36 | 92.58 |
| 7 | 49.72 | 38.17 | 76.77 | 99.87 | 90.37 | 90.49 |
| 8 | 46.60 | 34.71 | 74.48 | 93.50 | 86.06 | 92.04 |
| 9 | 46.86 | 36.50 | 77.89 | 93.62 | 86.43 | 92.32 |
| 10 | 45.93 | 35.65 | 77.62 | 95.79 | 85.20 | 88.94 |
| 11 | 50.78 | 40.43 | 79.62 | 99.51 | 92.39 | 92.84 |
| 12 | 49.08 | 37.98 | 77.38 | 99.15 | 89.70 | 90.47 |
| 13 | 47.10 | 35.48 | 75.33 | 93.53 | 84.73 | 90.59 |
| 14 | 46.40 | 36.06 | 77.72 | 93.09 | 86.70 | 93.14 |
| 15 | 48.15 | 37.31 | 77.49 | 95.23 | 88.83 | 93.28 |
| 16 | 52.39 | 40.34 | 77.00 | 102.07 | 95.81 | 93.87 |
| 17 | 47.48 | 37.87 | 79.76 | 98.22 | 91.54 | 93.20 |
| 18 | 48.42 | 39.32 | 81.21 | 99.12 | 93.12 | 93.95 |
| 19 | 44.25 | 34.89 | 78.85 | 89.85 | 82.25 | 91.54 |
| 20 | 46.85 | 36.83 | 78.61 | 96.61 | 88.37 | 91.47 |
| 21 | 49.99 | 38.30 | 76.62 | 98.96 | 88.98 | 89.92 |
| 22 | 52.47 | 39.41 | 75.11 | 102.92 | 94.47 | 91.79 |
| 23 | 44.63 | 34.51 | 77.32 | 89.57 | 81.45 | 90.93 |
| 24 | 47.24 | 38.24 | 80.95 | 97.80 | 91.04 | 93.09 |
| 25 | 51.44 | 40.97 | 79.65 | 104.26 | 94.43 | 90.57 |
Stay updated, free dental videos. Join our Telegram channel
VIDEdental - Online dental courses


