Introduction
Extrusive tooth movement has been overlooked in the literature on root resorption. The aims of this study were to quantify the effects of light and heavy controlled extrusive forces on root resorption and to localize the sites of prevalence in premolars.
Methods
Ten patients (7 girls, 3 boys) who required bilateral maxillary first premolar extractions as part of their orthodontic treatment participated in this study. The total sample consisted of 20 maxillary first premolars. Light (25 g) or heavy (225 g) forces were applied to the right or left first premolar for 28 days. After the experimental period, the teeth were extracted without root damage and analyzed with microcomputed tomography. Each specimen was studied in 3 dimensions, and specially designed software was used to measure the volume of each crater. Wilcoxon signed rank tests were used for the statistical analysis.
Results
There was a significant difference in the total root resorption caused by light and heavy forces ( P = 0.037). The discrepancy between the light and heavy groups was not significant for the cervical, middle, and apical regions separately. Only the distal surfaces were significantly different between the light and heavy forces ( P = 0.008).
Conclusions
Greater root resorption was observed after heavy extrusive forces when compared with light forces. The distal surfaces of the tooth root were significantly more affected than other root surfaces and might be influenced by root morphology and initial angulation of the tooth. There was no significant difference in the cervical, middle, and apical thirds in relation to root resorption after light or heavy extrusive forces.
Orthodontically induced root resorption refers to the loss of tooth substance as a consequence of tooth movement. It is associated with overcompression of the periodontal ligament; this results in tissue hyalinization. It has been suggested that root resorption might be a side effect of the cellular activity associated with the removal of necrotic tissue from the hyalinized zone.
Frequently, patients treated with orthodontic appliances suffer some root resorption. Certain patients are not affected significantly, whereas others undergo a degree of root loss that requires intervention during treatment.
This event has been reported in the literature since 1856, but its etiology is still unclear. Several features have been related to root resorption, and it is considered a multifactorial phenomenon. These etiologic factors have different origins: biologic and mechanical. Controlling biologic factors is out of the clinician’s scope, since these are related to each patient; however, mechanical factors can be controlled to some extent during treatment. The mechanical parameters involve type of appliance, duration of force, duration of treatment, extent of tooth movement, magnitude of force, and type of tooth movement.
Some studies have described extrusive tooth movement as the least harmful concerning root resorption, making the literature limited on this type of tooth movement. Most published data on extrusion are related to traumatized teeth; this introduces bias in relation to root resorption because of its high incidence in dental trauma.
Reitan considered root resorption in controlled extrusive movement to be an exception after he evaluated premolars under light microscopy. He justified the presence of minor craters with the possibility of lesions before treatment and the difficulty in avoiding tipping while attempting pure extrusion. Han et al reported similar conclusions. They stated that root resorption from extrusive forces was limited and not significantly different from the control group. When compared with intrusive forces, they suggested that teeth were 4 times more susceptible to root resorption after intrusive forces than with extrusive tooth movement. Weekes and Wong evaluated the response of the periodontal ligament to orthodontic extrusion using light microscopy and scanning electron microscopy. After 4 to 6 weeks of extrusion and 12 weeks of retention on endodontically treated incisors of beagle dogs, they described root resorption and repair in the cervical region.
Several methods have been implemented in the study of orthodontically induced root resorption. Traditionally, radiographs are the most popular tool for evaluation of treated teeth. They can only detect root resorption if it has occurred in large amounts, and buccal and lingual root resorptions are not assessed with this technology. Therefore, the information is assessed in only 2 dimensions, although it is a 3-dimensional (3D) process. Dudic et al aimed to validate the use of digitized periapical radiographs in evaluating orthodontically induced apical root resorption against microcomputed tomography scanning as the standard test. The radiographic method showed specificity of 78% and sensitivity of 44%; this means that less than half of the instances of root resorption detected with a microcomputed tomography scanner were identified by radiography. Conventional light microscopy and scanning electron microscopy are other 2-dimensional (2D) methods described in the literature. The downside of these technologies relates to the possible need of sectioning the sample; this is technique sensitive and might underestimate the results. Three-dimensional approaches include stereo imaging, scanning electron microscopy, and computed tomography. Because root resorption is a 3D problem, these last approaches were claimed to be more precise, since the tooth and its craters are evaluated in 3 dimensions.
The aims of this research were to investigate and compare the effects of different force magnitudes on the volumes of root resorption craters and the sites of prevalence after controlled extrusion of the maxillary first premolars. Our study is a continuation of a series of investigations on the physical properties of root cementum and root resorption at the University of Sydney in Australia.
Material and methods
The study was conducted on 20 teeth obtained from 10 adolescent patients (7 girls, 3 boys) who required extraction of maxillary first premolars as part of their orthodontic treatment and were selected according to the strict criteria previously described. Their ages were between 12 and 18 years. Ethics approval was obtained from the Ethics Review Committee of the Sydney South West Area Health Service (protocol no. X09-0110). Written and verbal informed consents were obtained from the subjects and their parents or guardians. On each patient, a light (25 g) controlled extrusive orthodontic force was randomly assigned to the maxillary first premolar on one side and a heavy (225 g) force on the contralateral tooth. The extrusive forces were in place for 4 weeks.
The experimental period and the force levels used in this research were chosen to comply with previous protocols carried out in the Department of Orthodontics at the University of Sydney.
Extrusive forces were applied on the buccal and palatal sides to reduce as much secondary tipping as possible. Therefore, each force magnitude (25 and 225 g) was divided by 2 (buccal and palatal sides) to obtain the same amount of force on either side. Laboratory tests were performed to determine the force delivery system. Several wires were tested by using the Mach-1 mechanical tester (BioMomentum, Laval, Québec, Canada), varying the interbracket distances and the activations. According to those tests, the light extrusive force would be achieved by using the core strand of 0.016-in SPEED Supercable archwire (Strite Industries, Cambridge, Ontario, Canada) producing 12.5 g of force at an 8-mm span and a 1.8-mm activation. This is a 7-strand coaxial wire of superelastic nickel titanium. On the opposite side, the heavy extrusive force was achieved by an intact 0.016-in SPEED Supercable wire producing 112.5 g of force at an 8-mm span and a 1.8-mm activation ( Fig 1 ).
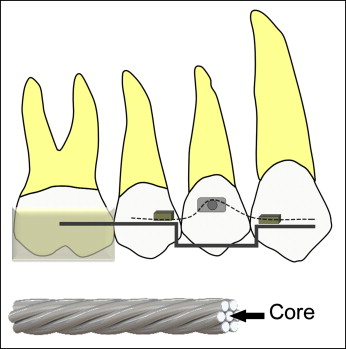
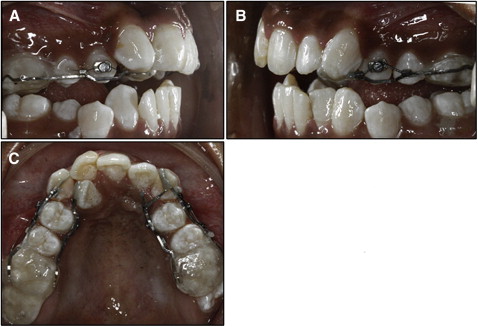
The appliance consisted of an acrylic block covering the maxillary first and second molars to disengage the occlusion and prevent occlusal interference. The acrylic block was connected to a 0.021 × 0.025-in stainless steel stabilizing wire (3M Unitek, Monrovia, Calif), which was bent passively and bonded to the lateral incisor or the canine as convenient. The archwire delivering the extrusive force was inserted through tubes welded to the stabilizing wire. These tubes were attached 8 mm apart, mesially and distally to the first premolar. Bondable buttons were bonded to the crown on the buccal and palatal sides of the first premolar to which the archwire was engaged to exert the force desired. The maxillary first premolars were previously prepared with 0.2 mm of interproximal reduction to prevent any contact with neighboring teeth that could interfere with the extrusion movement. The same operator (V.J.M.) treated all patients, and the duration of the experiment was 28 days. During this period, no reactivation of the experimental setup was performed ( Fig 2 ).
The teeth were extracted after the experimental 28 days; the surgery was carried out with careful attention not to damage the root cementum. After the extractions, the teeth were immediately stored in individual containers of sterilized deionized water (Milli Q; Millipore, Bedford, Mass), which was tested as an appropriate storage medium. The teeth were thoroughly cleaned by placing them in an ultrasonic bath, followed by mechanical cleaning with a damp gauze cloth. This removed all traces of the periodontal ligament and any soft-tissue fragments on the root surface. Extreme care was taken to prevent damage of the cementum. Finally, the teeth were disinfected in 70% alcohol for 30 minutes and then bench dried.
The samples were analyzed by using a compact desktop system for x-ray microtomography. The SkyScan 1072 desktop x-ray microtomograph (SkyScan, Aartselaar, Belgium) allows nondestructive 3D reconstruction of the tooth’s inner structure from 2D x-ray shadow projections. Each tooth was scanned, and the procedure lasted approximately 60 minutes per tooth. During scanning, the teeth were rotated 360° around the vertical axis with a single rotation step at 0.23°. The x-ray tube was operated at 60 kV and a current of 167 μA without filters. All teeth were scanned from the cementoenamel junction to the apex with a resolution of 17.2 μm. The images were acquired and saved as 16-bit tagged image file format (TIFF) files. Axial slice-by-slice reconstruction was achieved using Nrecon (version 1.4.2; SkyScan, Aartsellaar, Belgium). It uses the set of acquired angular projections to create a set of cross-section slices through the tooth. Reconstructed slices were saved as bitmap pixel files. The image reconstruction phase involved beam-hardening correction, alignment optimization, and ring artefact correction. The next step was visualization of the tooth surface in 3 dimensions. It required VGStudio Max software (version 1.2; Volume Graphics, Heidelberg, Germany), which gathers the axial 2D slices to form a 3D image of the tooth ( Fig 3 , A ).
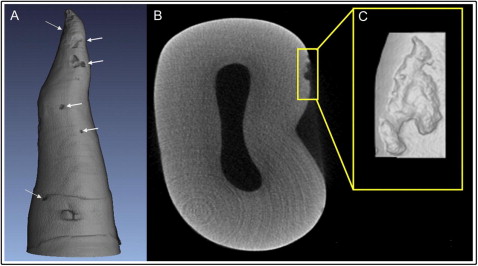
Each tooth was divided into thirds (cervical, middle, and apical) in the vertical dimension from the cementoenamel junction to the apex, and into fourths when viewed axially indicating the 4 surfaces of the tooth (buccal, lingual, mesial, and distal). Each crater would be isolated and classified according to its location. Craters were then isolated and volumetrically measured by using Convex Hull software (CHULL 2D) developed by the Australian Centre for Microscopy & Microanalysis at the University of Sydney. This program applies 2D convex hull algorithms to each axial slice of the crater data set. The interruption of the tooth surface is detected, and CHULL 2D connects the borders of the lacunae. The volume of root resorption craters is calculated on each axial slice ( Figs 2 , C, and 3 , B ). The resorption craters were measured individually, and then the root resorption volumes for each tooth on each surface were calculated.
Statistical analysis
Descriptive statistics and statistical analyses were performed by using PASW Statistics for Windows (version 18; PASW, Chicago, Ill). The means, standard deviations, and ranges of these measurements were calculated. Wilcoxon signed rank tests were performed to determine the levels of significance between light and heavy forces and at the different tooth surfaces and thirds. A P value of ≤0.05 was considered significant.
Craters were isolated and measured 3 times for 15% of the sample. Repeated measurements were taken 2 and 3 months after the initial analysis. The measurement error was calculated as the standard error from repeated measurements followed by 1-way analysis of variance (ANOVA). The standard error of the measurements in the groups was 0.00031; this resulted in a coefficient variation of 2.2% (coefficient variation = 100∗SD/mean). When the data were analyzed by vertical thirds, the standard deviation was 0.000182 with a coefficient variation of 3.8%.
Results
Wilcoxon signed rank tests were performed to analyze the data, since light and heavy forces were applied on the same patient. There was a significant difference in the total root resorption caused by light and heavy forces ( P = 0.037) ( Fig 4 ). The mean volumes of the resorption craters were 0.19 mm 3 in the heavy force group and 0.063 mm 3 in the light force group ( Table I ).
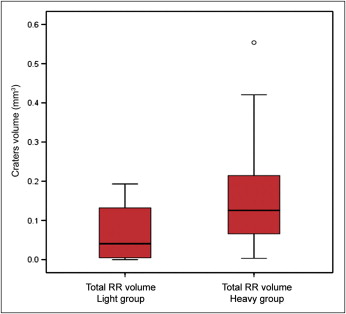
| Force | Mean | SD |
|---|---|---|
| Light | 0.063 | 0.069 |
| Heavy | 0.185 | 0.177 |
When the sample was analyzed by vertical thirds, the calculations indicated that the difference between the light and heavy groups was not significant for the cervical, middle, and apical regions separately ( P = 0.50, 0.14, and 0.17, respectively). The mean volume for each group is shown in Table II ; it was highest on the middle third in the heavy force group ( Fig 5 ).
| Force | Light | Heavy |
|---|---|---|
| Cervical | 0.020 | 0.022 |
| Middle | 0.020 | 0.108 |
| Apical | 0.023 | 0.056 |
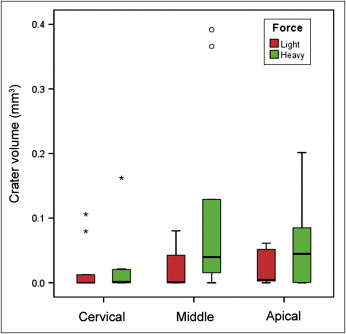
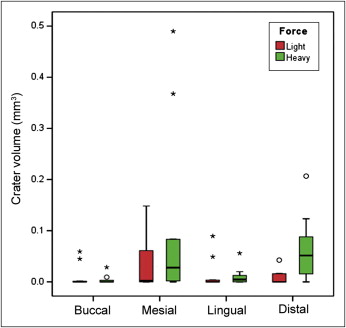
When we evaluated the different tooth surfaces, only the distal surface was significantly different between light and heavy forces ( P = 0.008). A heavy force seems to produce more root resorption than a light force at the mesial and distal surfaces, but the opposite was observed at the buccal and lingual surfaces ( Fig 6 ; Table III ).

