Introduction
Class II malocclusion affects about 15% of the population in the United States and is characterized by a convex profile and occlusal disharmonies. The specific etiologic mechanisms resulting in the range of Class II dentoskeletal combinations observed are not yet understood. Most studies describing Class II phenotypic diversity have used moderate sample sizes or focused on younger patients who later in life might outgrow their Class II discrepancies; such a focus might also preclude the visualization of adult Class II features. The majority have used simple correlation methods resulting in phenotypes that might not be generalizable to different samples and thus might not be suitable for studies of malocclusion etiology. The purpose of this study was to address these knowledge gaps by capturing the maximum phenotypic variations in a large sample of white Class II subjects selected with strict eligibility criteria and rigorously standardized multivariate reduction analyses.
Methods
Sixty-three lateral cephalometric variables were measured from the pretreatment records of 309 white Class II adults (82 male, 227 female; ages, 16-60 years). Principal component analysis and cluster analysis were used to generate comprehensive phenotypes to identify the most homogeneous groups of subjects, reducing heterogeneity and improving the power of future malocclusion etiology studies.
Results
Principal component analysis resulted in 7 principal components that accounted for 81% of the variation. The first 3 components represented variation on mandibular rotation, maxillary incisor angulation, and mandibular length. The cluster analysis identified 5 distinct Class II phenotypes.
Conclusions
A comprehensive spectrum of Class II phenotypic definitions was obtained that can be generalized to other samples to advance our efforts for identifying the etiologic factors underlying Class II malocclusion.
Class II malocclusion is present in about 15% of the population in the United States and is often characterized by a deficient mandible, leading to a convex profile, unesthetic facial proportions, and occlusal disharmonies. Both environmental and genetic factors and their interactions have been associated with Class II malocclusions; however, the etiologic mechanisms resulting in the array of dentoskeletal combinations observed in Class II patients remain elusive.
Examples of risk factors that can act on the prenatal environment include exposure to alcohol (fetal alcohol syndrome) and preterm birth, both of which have been associated with retrognathic mandibles and a Class II malocclusion. In addition, postnatal risk factors include low socioeconomic status, caries experience, premature loss of deciduous teeth, prolonged sucking habits, and resting tongue habits that might increase susceptibility to or exacerbate a Class II malocclusion and reduce treatment effectiveness. Studies of prolonged sucking habits are the most consistent, and the results indicate associations with a Class II dental relationship, decreased overbite, increased overjet, posterior crossbites, and temporomandibular joint dysfunction. Moreover, anthropologic data from remains of aboriginal Australians and other prehistoric populations point to changes from a hard to a soft diet as an important etiologic factor for the increased prevalence of Class II malocclusion in modern humans. This is presumably due to a decrease in dental attrition and a lack of compensatory tooth mesial migration associated with modern soft diets.
Severely retrognathic profiles and Class II malocclusions are common findings among other congenital craniofacial anomalies present in patients with Pierre Robin sequence and Treacher Collins, Stickler’s, and Turner’s syndromes, supporting the role of genetics in mandibular retrognathism. The Class II malocclusion has been further subdivided into Division 1 and Division 2, depending on the maxillary incisors’ proclination or retroclination, respectively, although additional skeletal and dental differences exist between the subdivision types beyond maxillary incisor angulations. Class II Division 1 cases occur more frequently (14.9%-24%) than Class II Division 2 cases (3.4%-5.9%). Interestingly, patients with a Class II Division 2 malocclusion have a higher incidence of dental anomalies compared with the normal population, suggesting that genetic factors involved in dental development might also be etiological for maxillomandibular size discrepancies.
Human genetic mapping studies of maxillomandibular size discrepancies are scarce and have focused primarily on the Class III malocclusion. So far, mandibular height and prognathism have been associated with the genes GHR , MATRILIN-1 , EPB41 , TGFB3 , LTBP2 , and MYO1H , suggesting that molecular pathways implicated in bone ( TGFB3 , LTBP ) and cartilage ( GHR , MATRILIN-1 ) development are plausible candidates for mandibular size discrepancies. For the Class II malocclusion, the authors of a small study of 4 Colombian families with mandibular hypoplasia found that all affected individuals were homozygous for the rare allele of the polymorphism rs1348322 within the NOGGIN gene, which is essential for mandibular formation in mice. No etiologic mutations have yet been identified.
The success of genetic studies aimed at identifying causative genes for malocclusion depends greatly on a well-characterized phenotype to reduce heterogeneity and prevent misclassification of affected individuals. Many studies of cross-sectional and retrospective longitudinal Class II samples with conventional cephalometry or shape analysis methods have attempted to characterize Class II dentoskeletal morphology over different developmental stages, for varying malocclusion severities, and from across global populations. In general, most studies agree that the dentoskeletal components of Class II Division 1 malocclusion include an obtuse cranial base angle, a larger cranial base length, and a normal, protruded, or retrusive maxilla. A retrusive mandible could be both deficient in its overall size and posteriorly located in relation to the cranial base. In the vertical dimension, both anterior upward or downward tipping of the maxilla and a steep mandibular plane angle with or without increased lower face height have been described. Regarding incisor angulations, studies have reported normal, proclined, and retroclined maxillary incisors and normal or proclined mandibular incisors. In addition, studies using posteroanterior cephalograms and dental models have shown higher incidences of transverse maxillary deficiencies.
In contrast, the most common dentoskeletal features in patients with Class II Division 2 malocclusion include a larger cranial base length, a normal or retrusive maxilla, mandibular retrusion, an acute gonial angle, increased posterior facial height with marked vertical development of the mandibular ramus, decreased anterior facial height and excessive bony chin, retroclined maxillary incisors, and normal or retroclined mandibular incisors. In addition to the dentoskeletal differences, particular lip features have been found for both subdivision types. In Class II Division 1, the proclination of the maxillary incisors is usually accompanied by a short upper lip and a low lip level with flaccid tone and less lip pressure that cannot counteract maxillary incisor protrusion. Conversely, a high lip level with a thicker lip shape, yet not a hypertonic muscle, is associated with maxillary incisor retroclination commonly found in the Class II Division 2 patients.
Morphometric studies of Class II samples have found mostly large differences in the size and shape of the mandible between Class II and control subjects, corroborating previous reports More sophisticated multivariate methods for cephalometric data analysis such as cluster procedures and principal components analysis have also been used to provide further insight and facilitate data interpretation beyond univariate methods. Moyers et al had the largest sample (n = 697) and applied a clustering procedure that produced 6 horizontal (A-F) and 5 vertical (1-5) overlapping subgroups ( Table I ). Among the horizontal subgroups, 4 were considered severe (B, C, D, and E), and 2 others (A and F) were mild, including maxillary dental protrusion in group A and slight mandibular retrognathism in group F. The 5 vertical subgroups were less well defined, and some occurred in 1 particular horizontal subgroup more frequently. Moyers et al classified 610 subjects in horizontal subgroups and 495 subjects into both vertical and horizontal subgroups, yet failed to classify 87 subjects. Although the methods in that study were not detailed and much of the variation remained unexplained, important Class II clinical features were visualized.
| Type | Dentoskeletal components | n | % |
|---|---|---|---|
| Horizontal | |||
| A | Maxillary dental protrusion | 17 | 2.8 |
| B | Flat cranial base, maxillary protrusion, normal mandible | 104 | 17.0 |
| C | Severe Class II with bimaxillary retrusion and maxillary and mandibular incisor proclination | 64 | 10.5 |
| D | Slightly retruded or normal maxilla, small mandible, proclined maxillary incisors | 112 | 18.4 |
| E | Maxillary protrusion with normal or protruded mandible and maxillary and mandibular incisor proclination | 63 | 10.3 |
| F | Milder Class II skeletal group with mandibular retrusion | 250 | 41.0 |
| Total | 610 | 100.0 | |
| Vertical | |||
| 1 | Downward inclination of palatal, occlusal, and mandibular planes | 132 | 26.7 |
| 2 | Parallel palatal, occlusal, and mandibular planes, deepbite tendency | 233 | 47.1 |
| 3 | Palatal plane tipped upward anteriorly and steep mandibular plane, open-bite tendency | 80 | 16.2 |
| 4 | Large downward inclinations of palatal, occlusal, and mandibular planes | 13 | 2.6 |
| 5 | Palatal plane is tipped downward, but occlusal and mandibular planes are normal, skeletal deepbite | 37 | 7.5 |
| Total | 495 | 100.0 | |
| Combinations between horizontal and vertical types | Vertical 1-horizontal A, C, D, and F | ||
| Vertical 2-all horizontal types | |||
| Vertical 3-horizontal C, D, and F | |||
| Vertical 4-horizontal B | |||
| Vertical 5-horizontal B and E | |||
Kasai et al used a sample of 46 adult Japanese men with Class I and Class II crania to investigate the relationships between the cranial base and facial morphology and to examine differences between both malocclusion groups. A principal component analyses was done separately for the linear and angular craniofacial measurements. The authors found that 5 linear and 3 angular components explained 73% and 78.6% of the variations, respectively. The linear components depicted variations in overall facial size; negative correlations between mandibular size vs facial height, and mandibular width vs ramus height; and variations in cranial base and palatal width. In contrast, the 3 angular principal components represented variations in anteroposterior jaw relationships, horizontal discrepancies between both jaws, and variations in the symphysis and gonial angle. This study also showed that both cranial base size and angulation were accurate predictors of anteroposterior and vertical maxillomandibular relationships.
Burke et al used multivariate reduction methods to predict facial and horizontal facial morphology and established correlations with condylar head inclinations. The results showed that patients with horizontal facial morphology had anterior condylar head inclination and more superior joint space, whereas patients with vertical facial morphology showed posterior condylar head inclination and less superior condylar space, leading to a possible reduction in condylar soft tissues and less growth potential. Thus, condylar head inclination is an important aspect in the evaluation of growth potential in Class II patients.
Finally, longitudinal studies of Class II patients indicate that Class II dentoskeletal characteristics can appear as early as the deciduous dentition. Although growth curve profiles are similar between Class II and Class I subjects and catch-up growth can occur in some Class II patients, growth magnitudes and directions are different. This indicates an overall tendency for Class II discrepancies not to self-correct and instead be maintained into adulthood.
In summary, previous studies have shown large variation in the dentoskeletal features for both subdivision types of Class II malocclusion. Yet, the causes of such unfavorable dentoskeletal combinations are still unknown. To an extent, the most common components observed in Class II subjects have been described, leading to improved orthodontic diagnostics and treatment planning. However, most studies to date have limitations in sample sizes, sample selection criteria (eg, including growing subjects and not excluding other genetic or environmental traits such as missing or impacted teeth), heterogeneity due to race or ethnicity, and lack of or limited standardization of data with respect to key variables such as age and sex before applying the data reduction methods. Therefore, there is uncertainty regarding the extent to which the results from previous studies are generalizable to other samples and populations, and whether one can identify additional phenotypic variations in other samples.
The goals of this study were to extract phenotypes that can best capture the variations in a large sample of white adults with Class II malocclusion using multivariate data reduction methods and to investigate whether the identified patterns would replicate those of previous studies. We also investigated the details of age and sex effects during our attempts to carry out rigorous data standardization before application of the data reduction methods to increase the precision of the estimation. Additional goals of this study were to determine whether we could explain meaningful additional variation in this sample and to provide an improvement for the assignment of qualitative phenotypic classification for each subject in this sample. Such improvement in phenotypic classification can be important both clinically and for increasing the power of genetic studies. This study resulted in a comprehensive set of Class II phenotypes that can be used on the unbiased phenotypic characterization of additional Class II patients to increase the power of future genetic studies by strengthening the phenotype-genotype correlations.
Materials and methods
The study protocol was reviewed and approved by the institutional review board at the University of Iowa. The study sample included unrelated adult Class II patients who were seeking treatment at the University of Iowa Orthodontic Graduate Clinic or the Dentistry Clinic at the University of Iowa Hospital. The sample consisted of 309 healthy white adults of European descent (227 female, 82 male; age range, 16-60 years) who had completed 95% of their growth at the time of initial records and who met our eligibility criteria ( Table II ).
| Inclusion criteria | Exclusion criteria |
|---|---|
| Adult (female, ≥16 years; male, ≥18 years) | History of severe facial trauma |
| Either Class II Division 1 or Division 2 | Previous orthodontic treatment |
| At least 2 of the following clinical criteria required | Facial syndromes |
| ANB ≥4° | Missing or poor-quality records |
| Overjet ≥4 mm | Missing or impacted teeth other than third molars |
| Angle Class II molar or canine relationship on at least 1 side | Retained deciduous teeth |
| Convex profile |
Two-dimensional pretreatment lateral cephalometric films of the 309 Class II subjects were digitized using Dolphin Imaging (version 11.0; Dolphin Imaging and Management Systems, Chatsworth, Calif). Sixty-three cephalometric measurements were taken representing distance, degree, percentage, and difference measures between cephalometric landmarks, which were derived from commonly used lateral cephalometric analyses and described previously ( Table III ). The data were obtained from 2 sources (film and digital radiographs). All films taken on conventional or analog cephalometric units from either the College of Dentistry Graduate Orthodontic Clinic or the Hospital Dentistry Clinic were scanned into the Dolphin device with a 100-mm ruler and corrected for magnification by 12% and 13%, respectively. Distance measures for film radiographs were scaled (multiplied by 0.8929 for 12% magnified cephalometric radiographs from the College of Dentistry Graduate Clinic and by 0.8850 for 13% magnified cephalometric radiographs from the Hospital Dentistry Clinic) to match the digital radiographs that were not corrected for magnification. To reduce landmark identification errors, all scanned analog films were traced twice (by S.C.H.), and the average value for each variable was used in the data analysis.
| Cranial base | Intermaxillary | Dental |
| Saddle/sella angle (SN-Ar) (°) | ANB (°) | U1-SN (°) |
| Anterior cranial base (SN) (mm) | Facial plane to AB (AB-NPg) (°) | U1-NA (°) |
| Posterior cranial base (S-Ar) (mm) | Facial plane to SN (SN-NPg) (°) | U1-NA (mm) |
| Midface length (Co-A) (mm) | U1-FH (°) | |
| Maxilla | Posteroanterior face height (S-Go/N-Me) (%) | IMPA (L1-MP) (°) |
| SNA (°) | Y-axis (N-S-Gn) (°) | L1-NB (°) |
| Convexity (NA-APg) (°) | Mx/md diff (Co-Gn-Co-ANS) (mm) | L1-NB (mm) |
| N-A || HP (mm) | Wits appraisal (AO-BO) (mm) | L1 protrusion (L1-APg) (°) |
| A to N perp (FH) (mm) | Anterior face height (N-Me) (mm) | L1 protrusion (L1-APg) (mm) |
| Maxillary unit length (Co-ANS) (mm) | Upper face height (N-ANS) (mm) | FMIA (L1-FH) (°) |
| Lower face height (ANS-Me) (mm) | Interincisal angle (U1-L1) (°) | |
| Mandible | Nasal height (N-ANS/N-Me) (%) | UADH (U1-PP) (mm) |
| SNB (°) | PFH:AFH (Co-Go/N-Me) (%) | LADH (L1-MP) (mm) |
| Facial angle (FH-NPg) (°) | FMA (FH-MP) (°) | UPDH (U6-PP) (mm) |
| Gonial/jaw angle (Ar-Go-Me) (°) | SN-GoGn (°) | LPDH (L6-MP) (mm) |
| Chin angle (Id-Pg-MP) (°) | Occlusal plane to SN (°) | Overjet (mm) |
| Ramus height (Ar-Go) (mm) | Occlusal plane to FH (°) | Overbite (mm) |
| Length of mandibular base (Go-Pg) (mm) | FH-SN (°) | |
| Facial taper (N-Gn-Go) (°) | ||
| Articular angle (S-Ar-Go) (°) | Soft tissues | |
| N-B || HP (mm) | Upper lip to E-plane (mm) | |
| N-Pg || HP (mm) | Lower lip to E-plane (mm) | |
| B to N perp (FH) (mm) | Upper lip to ST N perp (FH) (mm) | |
| Pg to N perp (FH) (mm) | Lower lip to ST N perp (FH) (mm) | |
| Mandibular unit length (Co-Gn) (mm) | ST Pg to ST N perp (FH) (mm) | |
| Pg-NB (mm) | ||
| Posterior facial height (mm) (Co-Go) |
Interrater and intrarater reliabilities in landmark location and resulting calculations of craniofacial measurements were determined using the intraclass correlation (ICC). To test for interrater reliability, a random calibration sample of 15 cephalograms from a previous study were digitized by both raters (S.C.H. and K.C.V.). For intrarater reliability, a random cephalometric sample of 15 Class II subjects was digitized twice by the same rater (S.C.H.) with at least 3 weeks between measurements. In addition, the possibility of systematic differences between the raters, or between the first and second ratings, was assessed using the Wilcoxon signed rank test. All analyses were performed with SAS software for Windows (version 9.2; SAS Institute, Cary, NC), and a type I error of 0.05 was specified.
Statistical analysis
Principal component analyses and cluster analysis were used to capture the most significant components of variation and to identify the most homogeneous groups of subjects representing distinct Class II phenotypes to reduce genetic heterogeneity. The data were standardized using a linear model to assess the possible effects of age and sex, and to consider the possibility of age-by-sex interactions. A separate model was fit for each of the 63 cephalometric measurements using standard multiple regression methods. In summary, 3 configurations of covariate adjustment were used among the 63 models: all included an adjustment for sex, some also required an age adjustment, and others needed an additional consideration for the sex-by-age interaction (ie, a different age adjustment for each sex). Diagnostic procedures were performed to ensure conformance to the model assumptions. The studentized (normalized) residuals were extracted from these models and used as the standardized data for the principal component analysis. Standardized principal component analysis scores were the basis for the formation of clusters defining distinct phenotypes of Class II malocclusion. Cluster analysis was performed via a partitional cluster analysis of extracted principal components with the SAS statistical software with methods based on the leader and the k-means algorithms using the method of Anderberg called “nearest centroid sorting.”
The k-means clustering algorithm is sensitive to extreme values as a consequence of the least-squares condition; however, no subjects in this data set appeared to represent extreme observations. The clustering algorithm was performed separately for a range of numbers of clusters, from 2 to 7 clusters. During this process, the iterative reassignment of cluster centroids progressed until no observations changed clusters, and convergence was achieved by the cluster algorithm in all configurations. Criterion-based model selection methods, including methods of pseudo F statistic approximating the expected overall R 2 , the cubic clustering criterion (valid because of the uncorrelated nature of the principal components), and data visualization techniques, were used to determine the appropriate number of clusters. To visualize the cluster analysis results, a canonic discriminant analysis was performed, and scored canonic variables were computed. The scored canonic variables were used to plot pairs or triads of canonic variables to aid the visual interpretation of cluster differences. The R statistical program and the rgl package were used to produce 3-dimensional graphs of the data.
Cluster characterization and validation were performed by locating the centroid of each cluster. The cluster centroid was the person closest to the numeric average of that cluster. The profile of each centroid was drawn to represent the characteristics of that group, and the subject’s cephalometric data were examined to ensure that clusters represented distinct clinical phenotypes. A type I error of 0.05 was specified throughout. All analyses were performed with SAS and R statistical software.
Results
Reliability testing of landmark locations and derived craniofacial measurements showed interrater reliability for the ICC values from 0.844 to 0.996; all ICC values exceeded 0.80, indicating excellent reliability for all measurements. There were several variables with significant differences between replicate measures, but all mean differences were less than 1.87 mm. For intrarater reliability, the ICC values ranged from 0.714 to 0.999; only 1 variable was associated with an ICC value below 0.80, corresponding to excellent intrarater reliability. Nine variables had significant differences between the first and second measurements made by the same rater, and the greatest mean difference was 2.06 mm. After examining variables with significant differences, we identified the outliers and used techniques to improve the reliability to acceptable values; discrepancies in cephalometric measurements of 0.5 to 1 mm are generally deemed acceptable because of the inherent difficulty of landmark location.
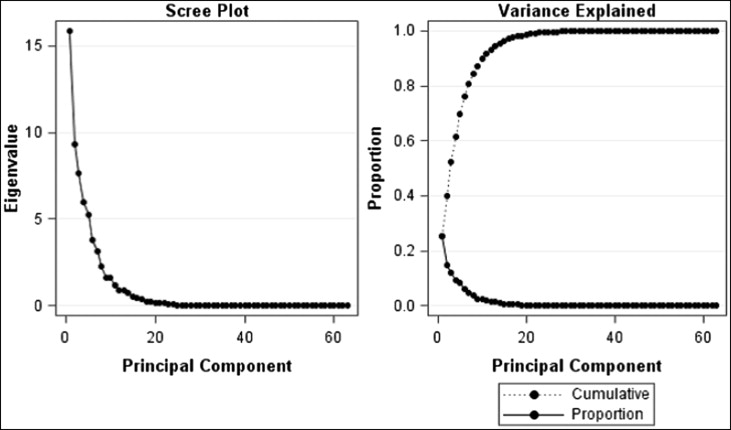
The results of the principal component analysis showed that 7 principal components accounted for 81% of the total variance in the data ( Fig 1 ). The first 7 principal components were selected because they explained the most variation in the data set and were specific in their anatomic explanations. As shown in Figure 1 , principal components beyond the seventh component were deemed not informative because the additional variation explained decreased significantly. Table IV contains the variance explained by each component and the set of variables that contributed the most to each principal component. To better visualize the variations in each principal component, the cephalometric profiles of subjects with extreme principal component scores values (ie, most negative and most positive scores) on each component together with the highest loading cephalometric variables are shown in Figure 2 . The results showed that about 50% of the variations in this Class II sample were explained by the inclination of the mandibular plane, the angulation of the maxillary incisors, and the mandibular horizontal and vertical lengths. Interestingly, principal component 2 ( Fig 2 ), which explains 15% of the variation, seemed to have captured the incisor variation typically seen between the Class II subdivisions; patients at the low extreme of this component had retroclined maxillary incisors (Division 2); conversely, subjects at the high extreme had proclined maxillary incisors (Division 1).