Introduction
During adolescence, increasing interdigitation of the midpalatal suture increases resistance to rapid maxillary expansion (RME); this decreases its skeletal effect. In this study, we aimed at determining whether a novel measure of midpalatal suture maturity, the midpalatal suture density ratio, can be used as a valid predictor of the skeletal response to RME.
Methods
The midpalatal suture density ratio, chronologic age, cervical vertebral maturation, and the stage of midpalatal suture maturation were assessed before treatment for 30 patients (ages, 12.9 ± 2.1 years) who underwent RME as part of comprehensive orthodontic treatment. Measurements on cone-beam computed tomography scans were used to determine the proportions of prescribed expansion achieved at the greater palatine foramina, the nasal cavity, and the infraorbital foramina.
Results
There was a statistically significant negative correlation between the midpalatal suture density ratio and both the greater palatine foramina and the infraorbital foramina ( r = −0.7877 and −0.3647, respectively; P <0.05). In contrast, chronologic age, cervical vertebral maturation, and stage of midpalatal suture maturation were not significantly correlated to any of the assessed measures of skeletal expansion ( r range, −0.2209 to 0.0831; P >0.05).
Conclusions
The midpalatal suture density ratio has the potential to become a useful clinical predictor of the skeletal response to RME. Conversely, chronologic age, cervical vertebral maturation, and stage of midpalatal suture maturation cannot be considered useful parameters to predict the skeletal effects of RME.
Highlights
- •
A novel measure of midpalatal suture maturity, the midpalatal suture density ratio, is described.
- •
The midpalatal suture density ratio is significantly correlated to the amount of skeletal response to RME.
- •
The midpalatal suture density ratio could become a useful clinical predictor of the skeletal response to RME.
Rapid maxillary expansion (RME) is a commonly used procedure to correct a transverse constriction of the maxillary arch. The heavy forces generated by the expander transmit through the teeth into the maxillary bones and are intended to open the midpalatal suture by separating the hemimaxillae; this leads to subsequent bone deposition. These effects are considered skeletal expansion and, in most cases, are desired to be the sole effects of the force application. However, dental tipping and bending of the alveolar process, which are considered dentoalveolar expansion, occur as well and have been reported to account for 39% to 49% and 6% to 13% of the total expansion, respectively. Dentoalveolar expansion is often unwanted, since dental tipping may lead to loss of periodontal attachment level, fenestrations of the buccal cortical bone, and dental root resorption. For these reasons, the goals of RME are typically to maximize skeletal expansion and to minimize dentoalveolar expansion.
Closure of the craniofacial sutures, especially the midpalatal suture, eventually makes skeletal expansion by conventional RME impossible, necessitating surgically assisted maxillary expansion. The surgical approach can involve either intraoperative widening of the maxilla through a multisegment LeFort osteotomy or surgically assisted RME. Both procedures are invasive, costly, and associated with surgical risks. To help with the clinical decision whether correction of a transverse discrepancy should be attempted with conventional RME or whether surgically assisted expansion is necessary, indicators of midpalatal suture maturation have been proposed. These indicators include sutural morphology as assessed on occlusal radiographs, skeletal maturity indicators on hand-wrist radiographs, cervical vertebral maturation (CVM) indicators on lateral cephalograms, and a recently suggested 5-stage classification of midpalatal suture maturation. Up to now, however, none of these indicators has been validated to predict the amount of skeletal expansion achieved with RME. A reliable way to predict a patient’s skeletal and dentoalveolar response to RME before treatment would add a new parameter for orthodontic treatment success. For instance, predicting the response would allow an adolescent with early closure of the suture to avoid the potential negative side effects of conventional RME. In contrast, in a young adult with late closure of the suture, surgically assisted RME may be avoided in lieu of conventional RME, which would prevent the added cost and risks of the surgical procedure.
In the past decade, the use of cone-beam computed tomography (CBCT) in clinical practice has increased as a consequence of its diagnostic advantages over traditional 2-dimensional imaging for orthodontic treatment planning. With CBCT, it is possible to visualize the midpalatal suture in vivo without any overlapping anatomic structures, which may allow the development of a qualitative or quantitative assessment of midpalatal suture maturation to assist with the decision about whether conventional or surgically assisted maxillary expansion is more appropriate.
The primary aim of this study was to test whether a novel midpalatal suture maturation measure, the midpalatal suture density ratio, obtained from a pretreatment CBCT image, can be used as a valid predictor of the amount of skeletal response to RME treatment. A secondary and subsidiary aim was to assess the correlations of the amount of skeletal response to RME treatment with the midpalatal suture density ratio, chronologic age, CVM, and stage of midpalatal suture maturation to determine the relative clinical usefulness of each potential predictor.
Material and methods
The research protocol including the use of existing CBCT scans was approved by the Institutional Review Board at the University of Minnesota (study number 1402M48043). A total of 30 patients (13 boys, 17 girls; ages, 12.9 ± 2.1 years) who had RME as part of comprehensive orthodontic treatment at the University of Minnesota School of Dentistry were included in this retrospective cohort study. Patients were excluded if they had a history of periodontal disease, previous orthodontic treatment, congenital malformations, or a time period greater than 6 months between the pretreatment CBCT scan and the beginning of treatment.
In each patient, RME was carried out using a Hyrax-type expander, which transmitted the force to the first molars and both first and second premolars or, when applicable, the deciduous molars. The prescribed amount of expansion was determined before treatment from measurements taken on digital casts and recalculated based on intraoral measurements taken at each patient’s first RME-check appointment. The patients were asked to activate the expander once daily, for expansion of 0.25 mm per day, until adequate correction of dental arch width—ie, the predetermined amount of expansion—was achieved as determined by the clinical judgment of the treating clinician. Patients who did not comply with the instructions or who had difficulties activating the expander were excluded from the study. After completion of activation, the expander was kept passively in place for an average of 15 weeks. After this postexpansion retention period, the expander was removed, and preadjusted edgewise appliances were placed to complete comprehensive orthodontic treatment. A descriptive summary of treatment variables is provided in Table I .
| Variable | Mean ± SD | Range |
|---|---|---|
| Age at expansion (y) | 12.9 ± 2.1 | 7.9-16.6 |
| Prescribed amount of expansion (mm) | 8.6 ± 2.2 | 3.3-13.0 |
| Postexpansion retention time (wk) | 15.0 ± 14.1 | 2.0-77.0 |
| Total treatment time (mo) | 28.7 ± 9.4 | 12.0-49.0 |
Full field-of-view (17 × 23 cm) CBCT scans were obtained before (T1) and after (T2) comprehensive orthodontic treatment using an i-CAT Next Generation unit (Imaging Sciences International, Hatfield, Pa) at 120 kV and 18.54 mAs, with a pulsed scan time of 8.9 seconds as part of the diagnostic records for comprehensive orthodontic treatment per the protocol used at the Division of Orthodontics at the University of Minnesota. The scan data were reconstructed with a voxel size of 0.3 mm 3 . CBCT scans obtained at T1 and T2 were assigned random numeric identifiers to achieve blinding to subject and time point during data collection and analysis.
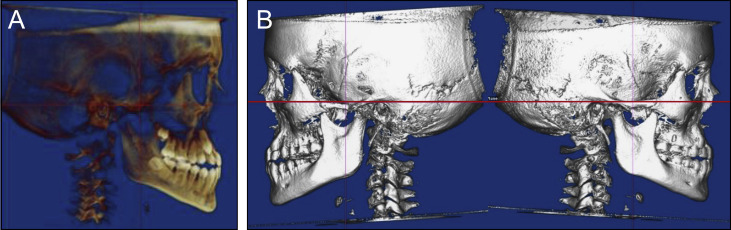
Data collection was performed using digital imaging and communications in medicine (DICOM) volumes. Each DICOM volume was first oriented using a translucent lateral view to achieve superimposition of the left and right inferior orbital rims and the zygomatic processes of the maxilla ( Fig 1 ). Solid right and left lateral views were then used to orient the Frankfort horizontal parallel to the true horizontal.
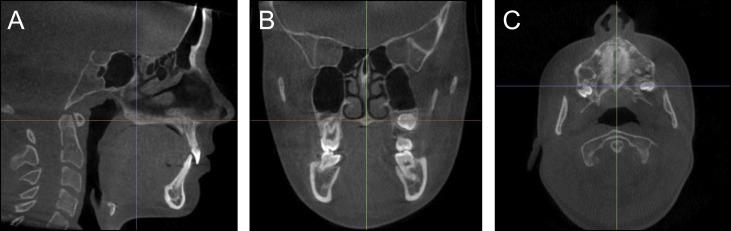
To quantify the skeletal effects of RME, linear measurements were made between bilateral skeletal structures on slices from the T1 and T2 images using Dolphin Imaging software (version 11.7; Dolphin Imaging & Management Solutions, Chatsworth, Calif). All measurements were made by 1 examiner (C.E.L.) and repeated after a 6-week washout period for 10 randomly chosen subjects to assess intraexaminer reliability. The linear measurements included the distance between the greater palatine foramina, which was measured between the lateral margins of the foramina on an axial slice through the center of the hard palate; the maximum width of the nasal cavity, which was measured on a coronal slice through the center of the incisive foramen; and the distance between the infraorbital foramina, which was measured between the lateral margins of the foramina on an axial slice ( Fig 2 ). The distance between the greater palatine foramina was selected because it allows measurement of skeletal expansion at the posterior hard palate, and the greater palatine foramen is an easily and reproducibly identifiable landmark. The maximum width of the nasal cavity and the distance between the infraorbial foramina were selected because the nasal walls and infraorbital foramina are reproducible ascending skeletal landmarks and the effects of RME have been reported to be pyramidal. Landmarks for skeletal measurements were chosen lingually or apically to the dentition to ensure that they remained unaffected by treatment with preadjusted edgewise appliances. To account for the individualized amount of expansion, each distance was converted to a proportion of the prescribed expansion by dividing the difference in distances between T1 and T2 by the amount of prescribed expansion ( Table II ).

| Measure | Definition |
|---|---|
| Greater palatine foramina proportion (GPFp) | Δ Distance between the greater palatine foramina (GPFd)/ Prescribed amount of expansion |
| Nasal cavity width proportion (NWp) | Δ Maximum width of the nasal cavity (NWd)/ Prescribed amount of expansion |
| Infraorbital foramina proportion (IOFp) | Δ Distance between the infraorbital foramina (IOFd)/ Prescribed amount of expansion |
To determine the midpalatal suture density ratio, the T1 images were oriented to the palatal plane in the sagittal and frontal views to yield an axial slice through the center and parallel to the hard palate ( Fig 3 ). Gray density measurements were then made on 0.3-mm slices using Invivo5 software (version 5.5.2; Anatomage, San Jose, Calif). The Invivo5 software assigns each voxel a gray density value on a scale specific to the machine and exposure settings. Average gray density values were determined for defined regions of the suture ( GD s ), soft palate ( GD sp ), and palatal process of the maxilla ( GD ppm ) ( Fig 4 ). The defined region of the suture was always determined on the most central axial slice through the hard palate. The average gray density values were used to calculate the midpalatal suture density ( MPSD ) ratio by the following equation.
Stay updated, free dental videos. Join our Telegram channel
VIDEdental - Online dental courses


