Introduction
This study was designed to assess the influence that the buccal corridor might have on the frontal facial attractiveness of subjects who had received orthodontic treatment with or without 4 premolar extractions.
Methods
Posttreatment full-face frontal smiling photographs of 30 premolar extraction and 27 nonextraction patients were evaluated by 20 orthodontists, 20 dentists, and 20 laypeople using a visual analog scale. The ratings were analyzed according to rater group, rater sex, and number of years in practice for orthodontists and dentists to search for any statistically significant differences in the ratings on the basis of treatment groups, subject sex, and buccal corridor widths and areas.
Results
Orthodontists and dentists gave higher mean overall frontal facial attractiveness scores than did laypeople. There were no significant differences in how men and women rated the study subjects. The number of years in practice did not affect how the orthodontists rated, but it did affect the ratings of the dentists. Female subjects were consistently rated as significantly more attractive than male subjects. There was no difference in ratings for the extraction and nonextraction subject groups. The buccal corridor widths and areas did not affect the frontal facial attractiveness ratings.
Conclusions
If treatment has been carried out with thorough diagnosis and careful planning, neither the choice of extraction or nonextraction treatment, nor the resulting buccal corridor widths or areas appeared to affect the subjects’ frontal facial attractiveness.
Historically, smile analysis has been treated as a separate entity from cephalometrics and cast analysis in orthodontic diagnosis and treatment planning. Even with a greater awareness of orthodontic influences on facial changes, a large proportion of the literature has been devoted to the lateral analysis of the face, with a relatively small emphasis on the frontal aspect. However, it is important to have a sound understanding of the factors that contribute to an esthetic smile from the frontal perspective. It can be argued that this is more important than the lateral viewpoint because it is the position from which most people interact and are viewed in social situations.
The buccal corridor has been gaining widespread attention as a potentially important feature that can influence the attractiveness of the smile. To date, there is still no consensus in the literature on how to measure or assess the buccal corridors. Various studies have adopted different definitions of the buccal corridor, evaluating it in relation to the canines, to the last visible teeth, or to both. These differing definitions of buccal corridor epitomize the dilemma facing clinicians when planning treatment for a 3-dimensional entity using a 2-dimensional photograph.
Consensus regarding the acceptable amount of buccal corridor display has varied throughout the years. In the 1950s, a wide smile with a negligible buccal corridor was deemed by some authors as unnatural and characteristic of a denture. There were opinions in the 1960s that the only teeth that should be shown in an attractive smile were the 6 anterior teeth. Current perceptions of what is deemed to be esthetically pleasing differ from those of 50 years ago, since a broad smile with minimal buccal corridors is now seen as a projection of youth and health. Even so, there are polarized opinions in the literature concerning the esthetic value of buccal corridors. Some authors have determined that the size of the buccal corridors is not critical to the esthetic value of a smile. Conversely, it is claimed that a smile with large buccal corridors is less esthetically pleasing than a smile with small buccal corridors.
In line with this, there is a resurgence of resistance to orthodontic extractions for fear of causing detrimental effects on the smile. It has been suggested that a narrow maxillary arch might result from orthodontic treatment, particularly when maxillary premolars have been extracted—and that this dark space can detract from facial attractiveness as does a flat profile.
Most investigators have used digitally altered photographs for panel assessments of buccal corridors. Comparatively few authors have used real, unaltered photographs to relate actual buccal corridor measurements to the esthetic value. Among these latter studies, either untreated subjects or subjects who had only nonextraction treatment have been assessed. Although useful in establishing potential relationships between buccal corridors and smile esthetics, these sample groups give no information about the possible esthetic effects of extracting teeth as part of contemporary orthodontic treatment.
As a result, there are little objective data on the direct effect of extraction or nonextraction treatment on the overall facial attractiveness pertaining to buccal corridors. For this reason, this investigation was designed to assess the esthetic value of buccal corridors, as evaluated by orthodontists, dentists, and laypeople on unaltered posttreatment full-face photographs.
Material and methods
Ethics approval was obtained from the Melbourne Dental School Human Ethics Advisory Group and Dental Health Services Victoria.
The photographic records of a previous sample of 57 patients (24 men, 33 woman) with a mean pretreatment age of 14.87 years (±2.99) who had undergone orthodontic treatment at the Royal Melbourne Dental Hospital were selected and prepared for this retrospective study. These subjects were divided into 2 groups on the basis of their extraction pattern: 30 had 4 premolar extractions, and 27 had nonextraction treatment ( Table I ). All subjects were treated with maxillary and mandibular fixed appliances, with the aim in each case to provide an ideal interdigitating occlusion as suggested by Roth and Andrews. All subjects had early permanent dentitions with no congenitally missing teeth (with the possible exception of third molars) and had not undergone any separate maxillary expansion treatment.
| Treatment group | Sex | Age | Total treatment time | Ricketts’ mandibular plane angle | Maxillary crowding | Overbite | |||||
|---|---|---|---|---|---|---|---|---|---|---|---|
| Mean (y) | SD | Mean (y) | SD | Mean (°) | SD | Mean (mm) | SD | Mean (mm) | SD | ||
| Extraction (n = 30) | F (n = 19) | 14.07 | 1.81 | 2.22 | 0.32 | 28.27 | 5.98 | 6.11 | 3.78 | 3.3 | 1.3 |
| M (n = 11) | 14.78 | 1.46 | 2.10 | 0.47 | 31.23 | 5.16 | 6.86 | 5.50 | 1.1 | 2.4 | |
| Total | 14.33 | 1.70 | 2.18 | 0.38 | 29.35 | 5.79 | 6.39 | 4.41 | 2.5 | 2.1 | |
| Nonextraction (n = 57) | F (n = 14) | 15.44 | 4.77 | 2.12 | 0.19 | 24.86 | 4.58 | −0.54 | 4.88 | 4.3 | 2.0 |
| M (n = 13) | 15.48 | 2.96 | 2.18 | 0.50 | 24.31 | 5.31 | −0.55 | 3.85 | 3.7 | 3.1 | |
| Total | 15.46 | 3.93 | 2.15 | 0.37 | 24.59 | 4.85 | −0.54 | 4.33 | 4.0 | 2.5 | |
| Total (n = 57) | F (n = 33) | 14.65 | 3.40 | 2.18 | 0.28 | 26.82 | 5.62 | 3.29 | 5.37 | 3.8 | 1.7 |
| M (n = 24) | 15.16 | 2.37 | 2.15 | 0.48 | 27.48 | 6.22 | 2.85 | 5.93 | 2.5 | 3.0 | |
| Total | 14.87 | 2.99 | 2.16 | 0.37 | 27.10 | 5.83 | 3.11 | 5.56 | 3.2 | 2.4 | |
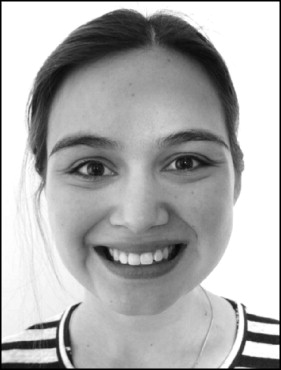
Each subject’s posttreatment posed frontal smile photograph was taken with a digital camera (EOS 40D; Canon, Tokyo, Japan), macro lens (EF 100 mm, f/2.8 Macro USM; Canon), and ring flash (Macro ring lite MR-14 EX; Canon). The patients had their heads in natural head position and were asked to give a “relaxed, natural smile.” The full-face photographs were then uploaded as JPEG files at a native resolution of 1880 × 2816 pixels and converted into black and white images. The photographs were imported into PowerPoint (Office 2007; Microsoft, Redmond, Wash) in a random order. One photograph was enlarged to fill each slide, and a randomly assigned subject number was clearly marked in the bottom right corner ( Fig 1 ).
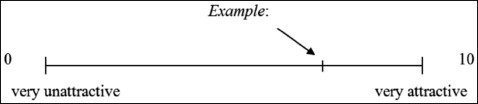
The panel consisted of 20 orthodontists (16 men, 4 women), 20 dentists (10 men, 10 women), and 20 laypeople (10 men, 10 women) ( Table II ). The number of years in clinical practice of each orthodontist and dentist was recorded. The slide show was presented individually (in the same order) to each rater, viewed on a laptop computer (13-in, 16:9 monitor, Vaio VGN-Z16GN; Sony, Tokyo, Japan). Each slide was automated to display for 12 seconds with no repeated viewings. A click was sounded on cue as each new slide was displayed. Each rater was given a booklet with 10 visual analog scales (VAS) per page for them to fill out. The VAS was created with a 100-mm uninterrupted line that was anchored on the left at 0 (“very unattractive”) and on the right at 10 (“very attractive”) ( Fig 2 ). The VAS was numbered according to the corresponding slides presented to them. The raters were advised of the time each slide would be displayed to them and the click they would hear to signify a change in slide. They were instructed to write their assessment of each smile in the context of the face at the appropriate point along the scale with a vertical line. Any facial blemishes, beauty spots, and hairstyles were to be disregarded as much as possible. All scores were measured to the nearest millimeter from the left anchor end to where the rater’s scribe was made to give the final esthetic rating.
| Years in practice | Orthodontists | Dentists | Laypeople | ||||||
|---|---|---|---|---|---|---|---|---|---|
| Male | Female | Both | Male | Female | Both | Male | Female | Both | |
| 1-10 | 7 | 2 | 9 | 6 | 6 | 12 | |||
| 11-20 | 3 | 1 | 4 | 4 | 3 | 7 | |||
| 21-30 | 6 | 1 | 7 | 0 | 1 | 1 | |||
| Total | 16 | 4 | 20 | 10 | 10 | 20 | 10 | 10 | 20 |
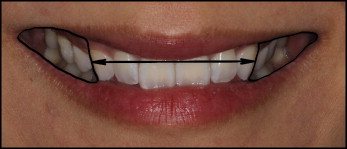
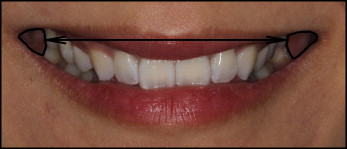
The details of the method used to measure the photographs to obtain the various buccal corridor widths and areas have been reported previously. The posttreatment measurements of the buccal corridor widths and areas from part 1 of this study that relate to the photographs shown to the panel members are documented in Table III and Figures 3 to 5 . Abbreviations used for the buccal corridor measurements are listed in Table IV .
| Extraction | Nonextraction | |||
|---|---|---|---|---|
| Mean (%) | SD (%) | Mean (%) | SD (%) | |
| IC:SW | 32.7 | 7.0 | 36.5 | 6.3 |
| IL:SW | 15.1 | 6.6 | 14.1 | 5.3 |
| BCC:TSA | 17.2 | 6.4 | 22.3 | 7.1 |
| BCL:TSA | 4.7 | 2.6 | 4.9 | 2.9 |
| Abbreviation | Definition |
|---|---|
| IC (intercanine distance) | The distance between the most distal surfaces of the canines. |
| IL (interlast visible maxillary tooth distance) | The distance between the most distal surfaces of the last visible maxillary teeth, to give the width of the visible dentition. |
| SW (smile width) | The intercommissural width. |
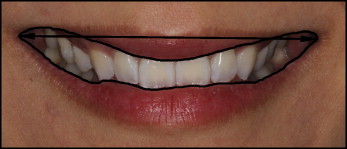
| BCC (buccal corridor area in relation to the canines) | The bilateral area bordered by the most distal surface of each canine and the inner vermilion border of the lips. |
| BCL (buccal corridor area in relation to the last visible maxillary teeth) | The bilateral area bordered by the most distal surface of the last visible maxillary tooth on either side and the inner vermilion border of the lips. |
| TSA (total smile area) | The total area bordered by the inner vermilion border of the lips. |
Statistical analysis
The final esthetic scores were entered into Excel spreadsheets (Office 2007; Microsoft) and then imported into SPSS (version 19; IBM, Somers, NY) for statistical analysis. Reliability analyses were conducted for each fixed-factor group (rater group, rater sex, orthodontists’ years in practice, and dentists’ years in practice) with an interclass correlation coefficient (ICC) and a 95% confidence interval. This was to establish how similarly the raters rated in each fixed-factor group. Since the ICC values were all high (lowest ICC, 0.832), it was justified to average the VAS scores across all raters in each group to produce an overall average rating for each subject for all subsequent statistical analyses. Overall mean VAS scores for each fixed-factor group was conducted with analysis of variance (ANOVA) tests ( Table V ), which were also used to test each fixed-factor group against subject treatment groups, sex, and buccal corridor widths and areas to detect any differences in the overall scores of each fixed factor group of these dependent variables. Differences in attractiveness ratings of each subgroup of each fixed factor group were analyzed using a 4-way factorial ANOVA test ( Table VI ). Through these analyses, relationships between the esthetic ratings and the treatment groups, buccal corridor widths and areas, and subject sex in turn were investigated. To enable objective statistical testing on the influence of the buccal corridors, each parameter (IC:SW, IL:SW, BCC:TSA, BCL:TSA) was grouped into either “small” or “large.” This was done by categorizing the values that were smaller than or equal to the median of that parameter as “small” and the values that were larger than this number as “large.” Post-hoc testing was conducted using the Tukey-Kramer method. Statistical significance was established at P <0.05.
| Rater group | Sex | Orthodontists’ years in practice | Dentists’ years in practice | ||||||||
|---|---|---|---|---|---|---|---|---|---|---|---|
| Orthodontists | Dentists | Laypersons | Male | Female | 1-10 | 11-20 | 21-30 | 1-10 | 11-20 | 21-30 | |
| Mean | 6.16 a | 5.84 b | 5.26 a,b | 5.59 | 6.00 | 6.00 | 6.21 | 6.32 | 6.06 c | 5.38 c | 6.42 d |
| SD | 0.84 | 0.84 | 1.21 | 0.89 | 0.95 | 0.93 | 1.10 | 0.72 | 0.80 | 1.02 | 0.93 |
Stay updated, free dental videos. Join our Telegram channel
VIDEdental - Online dental courses


