Introduction
In this retrospective study, we examined and compared the pretreatment and posttreatment arch widths and buccal corridor changes in subjects who had received orthodontic treatment either with or without premolar extractions.
Methods
Pretreatment and posttreatment casts, frontal smiling photographs, and lateral cephalograms of 30 extraction and 27 nonextraction patients were analyzed to determine any significant differences in arch widths, buccopalatal inclinations of the teeth, and buccal corridor widths and areas, both within and between the 2 groups. Relationships between buccal corridor measurements and corresponding arch widths and buccopalatal inclinations of the teeth were also examined.
Results
There was a significant increase in the posttreatment maxillary intercanine width in the extraction group but not in the nonextraction group. Both the pretreatment and posttreatment arch widths between the maxillary first molars and at the level of the posterior rugae were greater in the nonextraction group than in the extraction group. There were no significant differences in any buccal corridor widths or areas measured between the extraction and nonextraction subjects.
Conclusions
Because they reflect different morphologies, there are likely to be significant differences in average maxillary anterior and posterior posttreatment arch widths in those treated with or without extractions. However, these arch width differences are not likely to be discernible in extraction and nonextraction patients as differences in the buccal corridor widths and areas.
The smile is a key expression in social life. The importance of an attractive smile is apparent when it is considered that the esthetic concern regarding a smile is often the main motivation of a patient seeking orthodontic treatment.
For many years, numerous treatment methods have been suggested to maximize the esthetic outcome of orthodontic treatment. Initially, the focus of attention was from the perspective of the lateral soft-tissue profile. In the past 2 decades, however, there has been a shift in emphasis toward frontal esthetic facial analysis. Esthetic smile features that have been analyzed extensively include the dental midline, smile arc, incisogingival display, and ideal proportions of the teeth.
Recently, there has been increased interest in the esthetic effects of extracting teeth on the buccal corridors. The buccal corridor was first described as the space between the facial surfaces of the last visible posterior teeth and the corners of the lips when smiling. It has alternatively been defined as the distance between the maxillary canines in relation to the corners of the smile. Although area measurements have been used more recently, almost all previously reported measurements of buccal corridors have been linear.
Various features have been postulated to affect the size of the buccal corridor, including arch form, degree of smile arc, vertical facial pattern, anteroposterior position of the maxilla, and transverse width of the maxilla. Furthermore, the potential influence of the buccopalatal inclination of the posterior teeth on the buccal corridor by increasing the amount of crown visible upon smiling has recently been discussed.
Claims have been made that extraction of premolars results in larger buccal corridors and a less esthetic smile. For instance, it has been suggested that a narrow maxillary arch might result from orthodontic treatment, especially when maxillary teeth have been extracted. This has become a rationale against extracting teeth during orthodontic treatment. However, the concept of the arch width routinely narrowing after extraction treatment has been called into question.
Some authors have used the arch width findings of their studies to infer assumptions of direct effects on the buccal corridors. However, this inference was drawn from a limited body of evidence supporting a direct link between arch width and the buccal corridors, with only 1 published study of this correlation to date.
With all this in mind, we designed this study to evaluate the effects of premolar extraction and nonextraction treatments on maxillary arch width, the buccopalatal inclinations of the dentition, and buccal corridor widths and areas.
Material and methods
Approval was obtained for this study from the Melbourne Dental School Human Ethics Advisory Group and Dental Health Services Victoria in Australia. A preliminary sample of pretreatment and posttreatment photographs of 137 patients (82 premolar extraction, 55 nonextraction) was assessed. The extraction patients had 4 premolars extracted (1 in each quadrant), with no discrimination toward which premolars were extracted. All subjects had been treated with maxillary and mandibular contemporary fixed appliances, with the aim in each case to provide an ideal interdigitating occlusion as suggested by Roth and Andrews. All had early permanent dentitions with no congenitally missing teeth, with the possible exception of the third molars. No palatal expansion appliances had been used. It also would appear that arch forms were chosen on the basis of the mandibular arch.
Each subject’s pretreatment and posttreatment posed frontal smile photographs were taken in the same location with the same ambient lighting, with a digital camera (EOS 40D; Canon, Tokyo, Japan), macro lens (EF 100 mm f/2.8 Macro USM; Canon), and ring flash (Macro ring lite MR-14 EX; Canon). The subjects had their heads in natural head position and were asked to give a relaxed, natural smile. The photographs were then uploaded as JPEG files at a native resolution of 1880 × 2816 pixels.
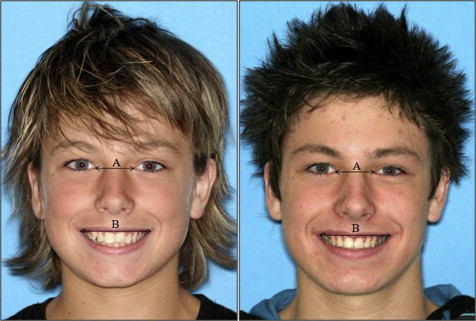
To ensure that the pretreatment and posttreatment smiles were similar and thus comparable in this retrospective study, the assessment was carried out in 2 steps. First, all pretreatment and posttreatment photographs were enlarged to fill a computer screen (19-in 16:9 SyncMaster 2033sw monitor; Samsung, Seoul, Korea). Each pair of pretreatment and posttreatment photographs was then subjectively assessed by an author (A.H.M.) to be similar, dissimilar, or borderline similar. The second step involved determining the pretreatment and posttreatment difference of the canthal width to commissure width ratios between each pair of photographs ( Fig 1 ). This was measured as the ratio of the distance between the inner canthus of each eye (intercanthal distance) and the distance between the outer commissure of the lips (intercommissure distance). These distances were measured using the linear measurement tool in the Photoshop software (CS; Adobe Systems, San Jose, Calif) to the nearest 0.01 mm. The inner intercanthal width has been reported to be relatively stable from a young age, leaving the width of the smile to be the only moving point of difference in the ratio. Thus, it follows that if the pretreatment and posttreatment ratio differences are small, the smiles at these 2 time points are similar. The threshold of the ratio difference to include in the final sample was calculated by plotting a receiver operating characteristic curve to evaluate the correlation between the subjective assessments and the measured differences of the pretreatment and posttreatment intercanthal width to commissure width ratios. From this curve, it was determined that if the ratio difference was 0.04 or less, the smile was deemed to be subjectively similar 85% of the time; this statistically excluded a safe number of false positives. After this, patients whose photographs satisfied this requirement were included in the final sample.
Thus, the final sample consisted of the records of 57 patients (24 boys, 33 girls) with a mean pretreatment age of 14.87 years (±2.99 years). These subjects were divided into 2 groups on the basis of their extraction pattern: 30 had 4 premolar extractions, and 27 had no premolar extractions ( Table I ).
| Treatment group | Sex | Age | Total treatment time | Ricketts’ mandibular plane angle | Maxillary crowding | Overbite | |||||
|---|---|---|---|---|---|---|---|---|---|---|---|
| Mean (y) | SD | Mean (y) | SD | Mean (°) | SD | Mean (mm) | SD | Mean (mm) | SD | ||
| Extraction (n = 30) | F (n = 19) | 14.07 | 1.81 | 2.22 | 0.32 | 28.27 | 5.98 | 6.11 | 3.78 | 3.3 | 1.3 |
| M (n = 11) | 14.78 | 1.46 | 2.10 | 0.47 | 31.23 | 5.16 | 6.86 | 5.50 | 1.1 | 2.4 | |
| Total | 14.33 | 1.70 | 2.18 | 0.38 | 29.35 | 5.79 | 6.39 | 4.41 | 2.5 | 2.1 | |
| Nonextraction (n = 27) | F (n = 14) | 15.44 | 4.77 | 2.12 | 0.19 | 24.86 | 4.58 | −0.54 | 4.88 | 4.3 | 2.0 |
| M (n = 13) | 15.48 | 2.96 | 2.18 | 0.50 | 24.31 | 5.31 | −0.55 | 3.85 | 3.7 | 3.1 | |
| Total | 15.46 | 3.93 | 2.15 | 0.37 | 24.59 | 4.85 | −0.54 | 4.33 | 4.0 | 2.5 | |
| Total (n = 57) | F (n = 33) | 14.65 | 3.40 | 2.18 | 0.28 | 26.82 | 5.62 | 3.29 | 5.37 | 3.8 | 1.7 |
| M (n = 24) | 15.16 | 2.37 | 2.15 | 0.48 | 27.48 | 6.22 | 2.85 | 5.93 | 2.5 | 3.0 | |
| Total | 14.87 | 2.99 | 2.16 | 0.37 | 27.10 | 5.83 | 3.11 | 5.56 | 3.2 | 2.4 | |
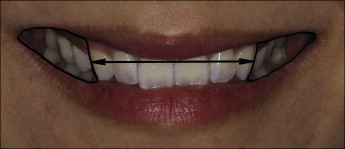
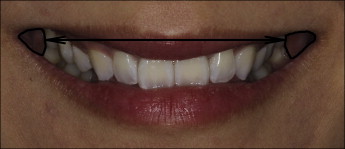
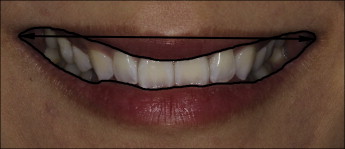
All photographic measurements were taken with Photoshop. The perioral areas of each pretreatment and posttreatment photograph were enlarged to fill the computer screen. Linear (IC:SW, LV:SW) and area (BCC:TSA, BCL:TSA) measurements were made and calculated as ratios according the methods of Hulsey, Johnson and Smith, and Ritter et al ( Table II ). The linear measurements were taken with the linear measurement tool to the nearest 0.01 mm. The area measurements were taken according to the methods described by Yang et al, with the magnetic lasso tool (anti-aliased, on; width, 10 pixels; edge contrast, 10%; frequency, 60 Hz) to select the smile areas ( Figs 2-4 ). The area units were recorded as the number of pixels in each area selection as displayed in the generated histogram (channel: RGB).
| Abbreviation | Definition |
|---|---|
| IC (intercanine distance) | The distance between the most distal surfaces of the canines. |
| IL (interlast visible maxillary teeth distance) | The distance between the most distal surfaces of the last visible maxillary teeth to give the width of the visible dentition. |
| SW (smile width) | The intercommissural width. |
| BCC (buccal corridor area in relation to the canines) | The bilateral area bordered by the most distal surface of each canine and the inner vermilion border of the lips. |
| BCL (buccal corridor area in relation to the last visible maxillary teeth) | The bilateral area bordered by the most distal surface of the last visible maxillary tooth on either side and the inner vermilion border of the lips. |
| TSA (total smile area) | The total area bordered by the inner vermilion border of the lips. |
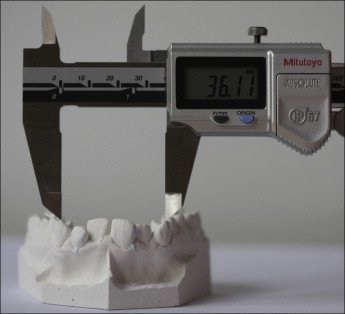
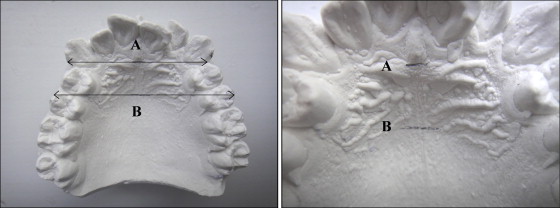
Pretreatment and posttreatment maxillary arch study cast dimensions were measured using an electronic digital sliding caliper (IP67; Mitutoyo, Tokyo, Japan) to the nearest 0.01 mm ( Fig 5 ). The amount of crowding was calculated using the segmental method of Proffit et al by subtracting the pretreatment segmental total from the posttreatment segmental total. Arch widths at the levels of the maxillary canines, the most anterior premolars, and the first molars were measured at the buccal cusp tips. Arch widths at the level of the point immediately distal to the incisive papilla (anterior rugae width) and at the conjunction of the third, lateral, and medial rugae (posterior rugae width) were also measured ( Fig 6 ), based on the methods of Akyalcin et al.
All pretreatment cephalograms were hand traced by 1 examiner (A.H.M.) and digitized with Westcef cephalometric software (customized cephalometric analysis software written for the University of Melbourne by Geoffrey West). This was done to determine the vertical facial pattern as derived from Ricketts’ mandibular plane angle (dolichofacial = mandibular plane >28°; mesofacial = 21°-28°; brachyfacial = mandibular plane <21°) and the sagittal dentoalveolar relationship (ANB <2° = Class III; 2°-4° = Class I; >4° = Class II) of each subject.
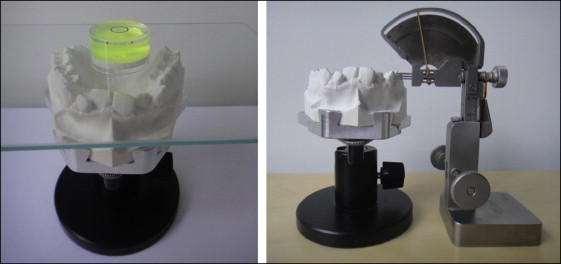
The posttreatment casts were mounted on a cast holder. To ensure a consistent orientation of the casts in which inclination measurements could be made perpendicular to the true vertical, a spirit level was placed on a glass sheet placed on the occlusal surface of the cast. The inclinations of the maxillary canines, premolars, and first molars were measured with an angulation and inclination measuring gauge (InvisiTech, Seoul, Korea) in 0.1° units ( Fig 7 ). The measurements from each contralateral side (quadrants 1 and 2) were averaged to give 1 value for statistical analysis.
All photographic and cast measurements were repeated 4 weeks after the initial measurements on 20 randomly selected subjects, 10 from each treatment group. The reliability of these repeated measurements was tested using the intraclass correlation coefficient (ICC) with a 95% confidence interval. A high degree of measurement reliability was found for all main outcomes, with ICC values from 0.84 to 1.0.
Statistical analysis
SPSS software (version 19; IBM, Somers, NY) was used for the statistical analysis. Descriptive statistics were calculated for all raw demographic, study cast, and photographic measurements. Mean pretreatment and posttreatment values and changes (posttreatment − pretreatment) were calculated for each dependant variable (all study cast and photographic measurements). The photographic measurements were calculated first as a proportion and then converted to a percentage of total smile width ( Table III ) for ease of interpretation. Before any formal testing, analyses involving only the potential confounding factors (ANB angle, mandibular plane angle, sex, total treatment time, pretreatment overjet, pretreatment overbite, and pretreatment maxillary crowding) were carried out to identify the key variables most strongly correlated with the outcomes of interest. This was achieved by considering each confounding factor separately as well as in combination. These analyses showed pretreatment maxillary crowding and overbite to be the strongest predictors of outcome. Because these 2 factors also differed substantially between the 2 groups before treatment, these variables were included in all subsequent analyses as confounding factors.
| Extraction | Nonextraction | Mean difference (%) ∗ | |||
|---|---|---|---|---|---|
| Mean (%) | SD (%) | Mean (%) | SD (%) | ||
| IC:SW | |||||
| Pretreatment | 33.8 | 6.3 | 35.4 | 6.5 | 1.6 |
| Posttreatment | 32.7 | 7.0 | 36.5 | 6.3 | 3.8 |
| Mean difference † | −1.1 | 1.1 | 2.2 | ||
| IL:SW | |||||
| Pretreatment | 16.5 | 6.4 | 17.2 | 5.0 | 0.7 |
| Posttreatment | 15.1 | 6.6 | 14.1 | 5.3 | 1.0 |
| Mean difference † | −1.4 | −3.1 ‡ | 1.7 | ||
| BCC:TSA | |||||
| Pretreatment | 26.8 | 36.7 | 22.8 | 8.5 | 4.1 |
| Posttreatment | 17.2 | 6.4 | 22.3 | 7.1 | 5.1 |
| Mean difference † | −9.6 | −0.5 | 9.1 | ||
| BCL:TSA | |||||
| Pretreatment | 8.8 | 16.9 | 6.7 | 4.0 | 2.1 |
| Posttreatment | 4.7 | 2.6 | 4.9 | 2.9 | 0.2 |
| Mean difference † | −4.1 | −1.8 ‡ | 2.3 | ||
∗ Absolute mean difference between treatment groups.
† mean difference within treatment groups (treatment change); posttreatment – pretreatment.
Multivariate analysis of covariance was used to compare the 2 treatment groups across all outcomes simultaneously. The main analyses were based on the change scores (posttreatment − pretreatment) as the set of dependent variables and treatment group as the main factor (nonextraction vs extraction) of interest together with pretreatment maxillary crowding and overbite. A test for the effect of treatment group across all outcomes was followed with estimates of group differences for each outcome separately. Model diagnostics were examined to check normality and homogeneity of variance, and 95% confidence intervals were calculated throughout. As a separate analysis, partial correlation coefficients were then calculated to look for any significant relationships between arch widths, buccopalatal inclinations, and buccal corridor width and area percentages. Statistical significance was established at P <0.05.
Stay updated, free dental videos. Join our Telegram channel
VIDEdental - Online dental courses


