Introduction
Coinciding treatment with periods of accelerated skeletal growth and maturation might be advantageous in clinical practice. Better understanding of the concordance between skeletal and chronologic ages during the period that children frequently receive orthodontic treatment is needed. The literature on skeletal age determination from hand-wrist radiographs lacks reports based on longitudinal data, creating lacunae in the understanding of the magnitudes and variations of differences between skeletal and chronologic ages. The aims of this research were to comprehensively analyze the concordance between skeletal and chronologic ages determined by using the Greulich and Pyle method at different ages in the preadolescent and adolescent periods, and to determine any age- and sex-related differences in the concordance.
Methods
By using the Greulich and Pyle method, skeletal age determinations were made from 572 hand-wrist radiographs of 68 white children with normal facial growth, selected from the records of the Burlington Growth Centre, spanning the growth period from 9 to 18 years. Skeletal age and chronologic age differences for each sex were analyzed by using paired t tests and Wilcoxon signed rank tests at yearly intervals. Differences over the longitudinal duration were examined by using the mixed model approach. The limits of agreement were determined by using the Bland-Altman method. In each yearly chronologic age group, differences were clinically categorized based on the proximity of the skeletal and chronologic ages.
Results
Overall, a slightly greater proportion of the total skeletal age determinations made in girls (41.9%) were within 0.5 year of their chronologic age, compared with 38% in boys. The largest proportions of subjects having skeletal age-chronologic age differences within 0.5 year were in the 10-year age group in girls (64.5%) and the 13-year age group in boys (64.7%). Mean skeletal age-chronologic age differences were significantly larger in the 13- to 16-year age groups in girls and in the 16- and 17-year age groups in boys, but the differences were not statistically significant at other ages. Several patterns of variations were identified in the direction of differences when individual plots were examined.
Conclusions
This longitudinal analysis of differences between skeletal and chronologic ages showed wide ranges and distributions of differences at each yearly age group during the growth period from 9 to 18 years, even when mean differences were small. Variations in the magnitude and direction of differences observed at different ages highlighted the variability in skeletal maturation among normally growing young people. Overall, the differences in skeletal and chronologic ages were positively related to age, with little effect of sex or its interaction with age.
Skeletal age is frequently used by clinicians to evaluate endocrine, orthopedic, genetic, metabolic, and renal disorders; to determine the skeletal growth status and the potential of children; and to monitor responses to medical therapy. It is also used for age evaluation in forensic and legal practice. For treatment planning in orthodontics and dentofacial orthopedics, evaluation of skeletal maturation has significance, since skeletal maturation is an integral part of a patient’s pattern of facial growth and development. Because most orthodontic patients are growing children, orthodontists need to consider the status of craniofacial growth of each patient while planning treatment. Growth modification treatment during a period of peak skeletal growth has been seen to be more successful than during a less active period of skeletal growth.
Various methods have been used to assess skeletal maturation, including evaluation of physiologic parameters such as peak growth velocity in standing height, physical characteristics of puberty, dental development, and periapical, panoramic, and cephalometric radiographs. The ossification of the hand is putatively considered to represent the maturation of the entire skeletal system. Clear demonstrations of different stages of development of the various bones in a small area have made skeletal age determination from hand-wrist radiographs a popular method for more than half a century, and many approaches for assessing skeletal age from hand-wrist radiographs have been described. However, skeletal maturation determined from hand-wrist radiographs involves radiation exposure. There is a need to understand the concordance between skeletal and chronologic ages during the period that children frequently receive orthodontic treatment and to identify the magnitudes, directions, and frequencies of differences between them.
The radiographic atlas method of Greulich and Pyle (GPM) is widely used internationally to determine skeletal age and maturation. In this method, the ossification status of the subject’s hand and wrist bones is compared with the standard of the same sex, nearest chronologic age, and corresponding bones depicted in the atlas. Standard hand-wrist radiographs are presented in the Greulich and Pyle atlas, ranging from those at birth in both boys and girls to those at age 19 years in men and 18 years in women. Several previous investigations have studied differences between chronologic and skeletal ages determined by the GPM, but mainly with cross-sectional data. The few reports based on longitudinal or mixed longitudinal data that have been published did not give detailed longitudinal analyses of these differences. These previous investigations have shown that skeletal and chronologic ages frequently do not concur and that there is significant variability in skeletal maturation among patients. However, due to the lack of a longitudinal study that comprehensively explored the concordance between skeletal and chronologic ages, a lacuna exists in a clear understanding of the magnitude, direction, frequency, and variability of differences between skeletal and chronologic ages in patients who are being considered for or are receiving orthodontic treatment. In this study, we aimed to analyze the concordance of chronologic age with skeletal age determined by using the GPM and to assess whether there are age- and sex-related differences in the concordance between the skeletal and chronologic ages in normally growing children.
Material and methods
A total of 572 serial hand-wrist radiographs of 68 normally growing white children (33 girls, 35 boys) between the chronologic ages of 9 and 18 years (girls, 8.93-18.24 years; boys, 8.92-18.47 years) were selected from the Burlington Growth Centre archives at the Faculty of Dentistry, University of Toronto, in Canada. The inclusion criteria were the following.
- 1.
Serial annual hand-wrist radiographs available from chronologic ages 9 through 18 years with no 2 consecutive radiographs more than 2 years apart.
- 2.
Normal facial growth with a skeletal Class I maxillomandibular relationship, as determined by ANB angle measurement between 1° and 4.5° (inclusive), measured on their lateral cephalograms at chronologic age 16 years.
- 3.
No or minimal orthodontic treatment.
- 4.
No syndrome or specific disease or growth abnormalities.
The radiographs were randomly given to 1 investigator (C.P.) for skeletal age determination using the GPM. In no instance were 2 consecutive radiographs of the same subject presented serially for skeletal age determination. The investigator was blinded to any subject-specific information that could provide a clue about their chronologic ages (except for sex). Skeletal age was determined on every radiograph. This included analyses of 261 radiographs of 33 girls and 311 radiographs of 35 boys. No radiographs were available for girls at chronologic age 15 years, and relatively fewer radiographs were available for girls at chronologic age 17 years; this led to the difference in the number of radiographs between the sexes. As described in the guidelines by Greulich and Pyle, a comparison of the skeletal maturation of the bones of each subject’s hand and wrist was made with the standard of the same sex and corresponding bones shown in the atlas; then skeletal age was assigned based on the age of the closest matching standard. When 1 film showed different levels of maturity of the bony centers assessed, consideration was given to the maturity status in most of the bony centers. Intraexaminer reliability was evaluated by reanalyzing 100 randomly selected radiographs (50 of each sex) at least 3 weeks apart and then comparing their skeletal age determinations by computing the intraclass correlation coefficients. The results (boys, 0.976; girls, 0.975) showed that the reliability of the method was excellent.
The chronologic ages of the subjects was compared with their skeletal ages as determined by the GPM for both sexes. The differences between chronologic and skeletal ages in each age group (1 year chronologic age interval: eg, the 12-year age group included chronologic ages of 11.5-12.5 years) were derived. To determine whether the difference was significant statistically in each age group, the paired t test was used when the data were normally distributed; if not, the Wilcoxon signed rank test was used. The difference between chronologic and skeletal ages over the longitudinal duration was examined by using the mixed model approach, where the correlations between multiple measurements from the same subject were taken into account, and the effects of age and sex as well as their interactions were evaluated. The Akaike information criterion was used for assessing goodness of fit of all models considered. Statistical analyses were performed with software (version 9.3; SAS Institute, Cary, NC), and the significance level was set at 5%.
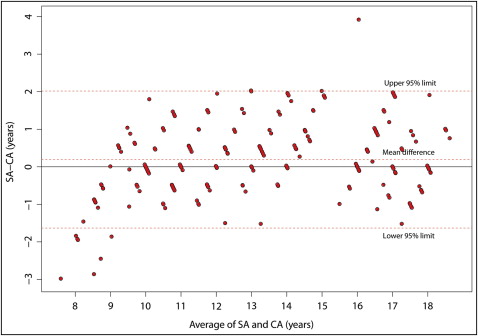
The concordance between chronologic and skeletal ages was graphically presented via the Bland-Altman method, and the 95% limits of agreement were derived while accounting for variations within (longitudinal measures) and between subjects. In addition to the limits of agreement, clinically acceptable differences were also considered. With a focus on clinical applicability, for a descriptive analysis of each age group, the cohort for each age group was divided into 5 categories based on the magnitude of differences between skeletal and chronologic ages. A margin of difference between skeletal and chronologic ages of 0.5 year was considered acceptable in clinical practice. The other 4 categories included skeletal age delayed by 1 year or more, delayed by 0.5 to 0.99 year, advanced by 0.5 to 0.99 year, and advanced by 1 year or more.
Results
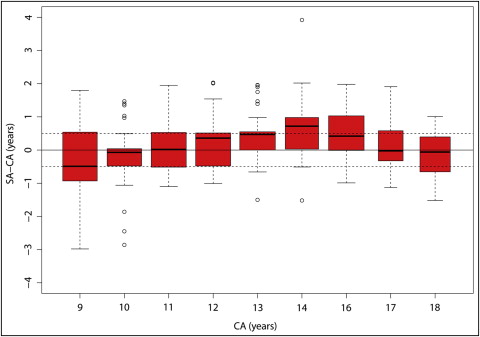
The differences between skeletal age determined by the GPM and chronologic age are shown in Table I and Figures 1 and 2 . For each age group, the mean difference between chronologic age and skeletal age determined by the GPM for girls was 0.5 year or less for all age groups, except for ages 14 and 16 years; at these times, it was, on average, determined by the GPM to be 0.75 and 0.54 years greater, respectively ( Table I , Fig 1 ) (no radiographs at chronologic age 15 years were available for girls). For boys, the mean differences between chronologic age and skeletal age determined by the GPM were 0.5 year or less for all age groups except the 16- and 17-year groups; at these times, skeletal age estimated by the GPM was, on average, 0.65 and 0.60 years greater, respectively ( Table I , Fig 2 ). The results from the mixed model approach for longitudinal assessment of the effect of age confirmed that the difference between skeletal and chronologic ages varied with age ( P <0.001) for both sexes, and the effects of sex and its interaction with age were not significant. These findings were consistent with the Bland-Altman plots ( Figs 3 and 4 ), where the differences above the upper 95% limits were around the older ages, and the differences below the lower 95% limits were mostly around the younger ages. The plots also showed that the width of the limits of agreement for boys was greater than that for girls.
| Sex | Age group | n | SA−CA (y) | ||
|---|---|---|---|---|---|
| Mean | SD | P value ∗ | |||
| Female | 9 | 31 | −0.36 | 1.08 | 0.076 |
| 10 | 31 | −0.15 | 0.97 | 0.162 | |
| 11 | 32 | 0.11 | 0.79 | 0.441 | |
| 12 | 32 | 0.25 | 0.79 | 0.084 | |
| 13 | 33 | 0.49 | 0.77 | 0.001 † | |
| 14 | 29 | 0.75 | 1.02 | 0.001 † | |
| 16 | 33 | 0.54 | 0.79 | 0.001 † | |
| 17 | 16 | 0.10 | 0.77 | 0.607 | |
| 18 | 24 | −0.12 | 0.76 | 0.215 | |
| Male | 9 | 31 | −0.11 | 0.98 | 0.756 |
| 10 | 33 | −0.05 | 1.26 | 0.840 | |
| 11 | 35 | −0.04 | 0.84 | 0.795 | |
| 12 | 34 | 0.05 | 0.71 | 0.913 | |
| 13 | 34 | −0.04 | 0.63 | 0.745 | |
| 14 | 35 | −0.07 | 0.94 | 0.162 | |
| 15 | 11 | 0.47 | 1.30 | 0.263 | |
| 16 | 32 | 0.65 | 1.21 | 0.005 † | |
| 17 | 31 | 0.60 | 1.00 | 0.002 † | |
| 18 | 35 | −0.01 | 0.76 | 0.820 | |
∗ P values were based on the Student t test when data were normally distributed, or the Wilcoxon signed rank test when the distribution was nonnormal.
Examination of the results, based on the 5 categories defined in the “Material and Methods” section for each age group ( Table II , Figs 5 and 6 ), showed that overall, a slightly greater proportion of skeletal age determinations in girls fell within 0.5 year of their chronologic ages (41.9%) than did those in boys (38.4%). The proportions of skeletal age determinations that were within 0.5 year of chronologic ages or within 1 year varied in girls at different ages ( Table II ), and the variations explained the mean differences shown in Table I . Although 58.08% of all skeletal age determinations in girls fell outside the clinically acceptable margin of 0.5 year from the chronologic age, nearly 80% were within 1 year of the chronologic age. Similar variations in the relative proportion of skeletal age determinations that fell within 0.5 year and 1 year of the chronologic ages were seen in boys ( Table II ). More boys had skeletal ages that were advanced by at least 0.5 year in the 15-, 16-, and 17-year age groups; these resulted in greater means at these ages, as shown in Table I . Notably, although 61.6% of all the skeletal age determinations in boys fell outside the 0.5-year mark that was deemed clinically acceptable, 70% were within 1 year of the chronologic age.
| Sex | Age group | n | Difference between SA and CA <0.5 y | SA delayed >1.0 y | SA delayed 0.5-0.99 y | SA advanced 0.5-0.99 y | SA advanced >1.0 y |
|---|---|---|---|---|---|---|---|
| Female | 9 | 31 | 16.13 | 19.35 | 29.03 | 25.81 | 9.68 |
| 10 | 31 | 64.52 | 12.90 | 6.45 | 3.23 | 12.90 | |
| 11 | 32 | 34.38 | 6.25 | 28.13 | 15.63 | 15.63 | |
| 12 | 32 | 46.88 | 3.13 | 18.75 | 18.75 | 12.50 | |
| 13 | 33 | 45.45 | 3.03 | 6.06 | 27.27 | 18.18 | |
| 14 | 29 | 27.59 | 3.45 | 6.90 | 37.93 | 24.14 | |
| 16 | 33 | 48.48 | 0 | 9.09 | 12.12 | 30.30 | |
| 17 | 16 | 56.25 | 6.25 | 12.50 | 18.75 | 6.25 | |
| 18 | 24 | 37.50 | 16.67 | 20.83 | 20.83 | 4.17 | |
| Male | 9 | 31 | 48.39 | 16.13 | 9.68 | 12.90 | 12.90 |
| 10 | 33 | 36.36 | 18.18 | 21.21 | 3.03 | 21.21 | |
| 11 | 35 | 48.57 | 8.57 | 22.86 | 8.57 | 11.43 | |
| 12 | 34 | 38.24 | 2.94 | 26.47 | 26.47 | 5.88 | |
| 13 | 34 | 64.71 | 5.88 | 11.76 | 17.65 | 0 | |
| 14 | 35 | 34.29 | 11.43 | 34.29 | 8.57 | 11.43 | |
| 15 | 11 | 9.09 | 18.18 | 9.09 | 27.27 | 36.36 | |
| 16 | 32 | 31.25 | 6.25 | 9.38 | 21.88 | 31.25 | |
| 17 | 31 | 25.81 | 9.68 | 3.23 | 25.81 | 35.48 | |
| 18 | 35 | 48.57 | 14.29 | 11.43 | 22.86 | 2.86 |
Stay updated, free dental videos. Join our Telegram channel
VIDEdental - Online dental courses


