Introduction
The aims of this article are to introduce the capability to view and interact with 3-dimensional (3D) surface models in online publications, and to describe how to prepare surface models for such online 3D visualizations.
Methods
Three-dimensional image analysis methods include image acquisition, construction of surface models, registration in a common coordinate system, visualization of overlays, and quantification of changes. Cone-beam computed tomography scans were acquired as volumetric images that can be visualized as 3D projected images or used to construct polygonal meshes or surfaces of specific anatomic structures of interest. The anatomic structures of interest in the scans can be labeled with color (3D volumetric label maps), and then the scans are registered in a common coordinate system using a target region as the reference. The registered 3D volumetric label maps can be saved in .obj, .ply, .stl, or .vtk file formats and used for overlays, quantification of differences in each of the 3 planes of space, or color-coded graphic displays of 3D surface distances.
Results
All registered 3D surface models in this study were saved in .vtk file format and loaded in the Elsevier 3D viewer. In this study, we describe possible ways to visualize the surface models constructed from cone-beam computed tomography images using 2D and 3D figures. The 3D surface models are available in the article’s online version for viewing and downloading using the reader’s software of choice. These 3D graphic displays are represented in the print version as 2D snapshots. Overlays and color-coded distance maps can be displayed using the reader’s software of choice, allowing graphic assessment of the location and direction of changes or morphologic differences relative to the structure of reference. The interpretation of 3D overlays and quantitative color-coded maps requires basic knowledge of 3D image analysis.
Conclusions
When submitting manuscripts, authors can now upload 3D models that will allow readers to interact with or download them. Such interaction with 3D models in online articles now will give readers and authors better understanding and visualization of the results.
Highlights
- •
Elsevier has made a 3D viewer available to AJO-DO authors and readers.
- •
Figures can be viewed as 2D snapshots.
- •
Figures can be viewed in 3D.
- •
Figures can be downloaded and imported into other programs.

More effective and rational clinical decision making for orthodontic and orthognathic surgery patients requires careful 3-dimensional (3D) image-analysis techniques. Advanced applications of 3D imaging techniques, including virtual models from cone-beam computed tomography (CBCT), stereophotometry, and intraoral or indirect scanners, can be used for applications in dentistry that now allow superimpositions for populational and individual longitudinal assessments. The 3D superimpositions provide assessments of growth, changes with treatment, stability evaluations, improved diagnoses of asymmetry, tooth morphologies and relative positions, quantitative and qualitative analyses of skeletal and tooth displacements, and temporomandibular joint evaluations, among other applications. Interpretation of the superimposition results depends on the structure of reference used for registration. It is important that the clinician be prepared and familiar with the technology to prevent misunderstandings and incorrect interpretations of the images.
Advances in our field have relied on 3D data for new discoveries. However, when publishing those new discoveries, articles were up to now limited to featuring 2-dimensional (2D) projected images of the 3D models. Since September 2014, thanks to a collaborative effort between Elsevier and Kitware SAS (Lyon, France), the American Journal of Orthodontics and Dentofacial Orthopedics has given readers the exciting capability to view and interact with publications’ 3D models on a variety of devices, including mobile phones, tablets, laptops, and desktops. The 3D interactivity in online Elsevier articles empowers authors to optimally showcase their research and enables readers to more deeply and efficiently understand the findings presented. Readers can see data sets in all views in 3D space by panning, rotating, and zooming in or out on models of interest, applying color settings, and downloading the 3D data sets.
This article introduces the capability to view and interact with publications’ 3D volumetric images and surface models and describes the steps to prepare the surface models for such online 3D visualizations. Specifically, we present image analysis procedures for 3D visualization and quantification of populational and longitudinal changes.
Material and methods
Three-dimensional image analysis procedures for orthodontic, craniofacial, and maxillofacial surgery applications include (1) image acquisition, (2) construction of 3D volumetric files, (3) image registration, and (4) visual analytics with graphic display of 3D morphological variability and changes. Once these procedures are performed, the 3D files can be saved and uploaded for 3D visualization in online publications.
For acquisition of 3D diagnostic records, diagnosis of maxillomandibular discrepancies is based on data coming from different sources: clinical examinations, 3D photographs, CBCT, CT, magnetic resonance images, and digital dental models. Systems for computer-assisted diagnosis must integrate different records to characterize the diagnosis and formulate the treatment plan. Images from CBCT, CT, and magnetic resonance imaging are acquired as volumetric 3D images (saved in file formats such as DICOM, GIPL, or NRRD). These volumetric images can be visualized as cross-sectional slices or 3D projected images (3D renderings) or can be used to construct polygonal meshes or surfaces of specific anatomic structures of interest. The Elsevier 3D viewer includes capabilities to visualize the 3D images as cross-sectional slices, 3D renderings, 3D polygonal meshes, or solid surfaces. To simplify the description of image analysis procedures, we will specifically describe 3D analysis of images acquired with CBCT, since it is now widely used in our field. The same image analysis procedures are applicable and can be generalized for images acquired with any 3D imaging modality.
For construction of 3D volumetric files that label with color the anatomic structures of interest, the CBCT scans (DICOM files) can be opened and visualized in any 3D image analysis software of choice. Examples are 3DMDvultus (3DMD, Atlanta, Ga), Maxilim (Medicim, Mechelen, Belgium), Dolphin Imaging (Dolphin Imaging & Management Solutions, Chatsworth, Calif), InVivo Dental (Anatomage, San Jose, Calif), SimPlant OMS or Mimics (Materialise, Leuven, Belgium), or open-source tools such as TurtleSeg, ITK-SNAP, and 3D Slicer. In a procedure known as image segmentation, we identify and delineate the anatomic structures of interest in the CBCT scan to obtain a 3D representation of the hard and soft tissues (3D volumetric label map files). Even though image segmentation has been a field of active research for many decades, it remains one of the most time-consuming steps in image processing. A major challenge with segmentation is that hard and soft tissues from CBCT images have no corresponding Hounsfield units. One CBCT image taken from a subject may have different intensity levels for bone, cartilage, and soft tissues. No standard segmentation method can be expected to work equally well for all tasks. Many commercial softwares incorporate an intensity thresholding algorithm for their segmentation. Although this often works well for thick and dense bones such as the mandible, it often fails for thin bones such as the condyles and the labial surfaces of the teeth. The morphology and position of the condyles and the internal surfaces of the ramus and maxilla are critical for careful diagnosis. Then precise segmentation and representation of these anatomic regions are important. To best capture the facial anatomy, our method of choice for the segmentation procedures is ITK-SNAP10 software, which has received continuous support from the National Institutes for Health (NIH), Bethesda, Maryland, for further open-source software development. ITK-SNAP was developed, based on the NIH Visualization Tool Kit (VTK) and Insight Tool Kit (ITK), as part of the NIH Roadmap Initiative for National Centers of Biomedical Computing. The semiautomatic segmentation procedures in ITK-SNAP use active contour methods to compute feature images based on the CBCT images’ gray level intensities and boundaries. ITK-SNAP is more versatile than other open and commercial softwares because it allows the adjustment of the parameters for automatic detection of intensities and boundaries and allows user interactive editing of contours. For example, on a laptop computer equipped with a 2.5 GHz processor and a 1 GB graphic card, the initial segmentation step typically takes about 15 minutes. Manual postprocessing of the segmentation usually takes longer, up to several hours (separation of the maxillary and mandibular teeth can be particularly tedious).
After segmentation, for a single image taken at 1 point in time, the 3D volumetric label map can be saved as a 3D triangular or polygonal mesh (3D surface model), in .obj, .ply, .vtk, or .U3D file format. Then it can be uploaded in an online publication and visualized in the Elsevier 3D viewer.
For longitudinal CBCT scans or scans of a group of patients, further image analysis procedures are required and described below.
The next image analysis procedure consists of registering the scans and their respective 3D volumetric label maps in a common coordinate system using a target region as the reference. Different types of registrations will lead to different interpretations of the results. The registration procedures can use, as options for reference, landmarks, surface models, or voxel gray intensity. Currently, both commercial and open-source softwares allow these different options for craniomaxillofacial registration ( https://sites.google.com/a/umich.edu/dentistry-image-computing ). The process of registration involves computing transformations. Transformation is a mathematical operation that applies a matrix to move the points of a 3D image or surface model in multiple planes and degrees of freedom in 3D space. Longitudinal CBCT scans acquired at different times can be registered by computing the differences of the head position relative to a stable anatomic structure of reference. The image registration procedure that computes the translational (anteroposterior, transverse, and vertical) and rotational displacements (pitch, roll, and yaw) is known as rigid registration. There are also image registration procedures that compute differences in scale (size changes with growth or treatment, known as affine registration) or shape (nonrigid registration). The challenges of using nonrigid registration for clinical studies are that shape integrity is not preserved, and the 3D models can be deformed. To prevent distorting or morphing of the images, nonrigid registration can be used to compute transformations by considering scale and shape differences, and then applying only the rigid movements (rotation and translation) to preserve the actual scale and shape features.
The image registration procedures that our research group has found to provide the most reliable results consist of 2 steps.
- 1.
Establishing a common coordinate system across subjects for group comparisons, not based on a single line or plane, is essential to allow group comparisons and consistent measurements across subjects. Quantifications of the anteroposterior, vertical, and transverse directions of changes require consistent orientations of the heads of all subjects and image acquisitions using natural head position, intracranial reference planes, or minisensors for recording the 3D head position.
- 2.
For voxel-based registrations for longitudinal assessments, the major strength of this method is that registration does not depend on how precisely the 3D volumetric label maps represent the anatomic truth or on the location of a limited number of landmarks. For voxel-based registration methods that use the 3D volumetric label maps as the input of the region of reference, these multiplanar label maps should be extended slightly (1-2 voxels) beyond the actual bone boundaries to provide the complex gray-level information needed for the automatic detection of the bone boundaries during the voxel-based registration. Importantly, the 3D segmentation of the anatomic structures of reference for the registration are not “clean” 3D surface models and are used only as references to mask anatomic structures that change with growth and treatment. Voxel-based registration methods actually compare voxel by voxel the gray-level values in 2 CBCT images to calculate the rotation and translation parameters between them. Not all voxel-based registrations are similar in methodology and accuracy, because they can use different structures of reference and different numbers of iterations (eg, the software can run for 1 minute and compute 100 attempts of best voxel match, or run for 10 minutes and compute 1000 comparisons of best fit among thousands of voxels). After registration, the 3D volumetric label maps should be further edited for finer definitions of the patient’s actual bony anatomic contours.
It is also important to understand that the clinical implications that can be derived from 3D registrations and superimpositions depend on the structures selected as references for registration. Registration on different regions of reference will lead to different interpretations of the results. We have developed a novel sequence of fully automated voxel-wise rigid registrations at the cranial base (for overall facial assessments relative to cranial structures that complete their growth early in childhood) and regionally (to assess maxillary and mandibular bone remodeling). All image registration procedures described above can be performed in the Transforms and CMF registration modules in Slicer open-source software ( www.slicer.org , ; video tutorials 1 to 3 available at http://www.youtube.com/user/DCBIA ). They were initially developed as part of the National Alliance of Medical Image Computing (NIH Roadmap for Medical Research) and have been widely used internationally.
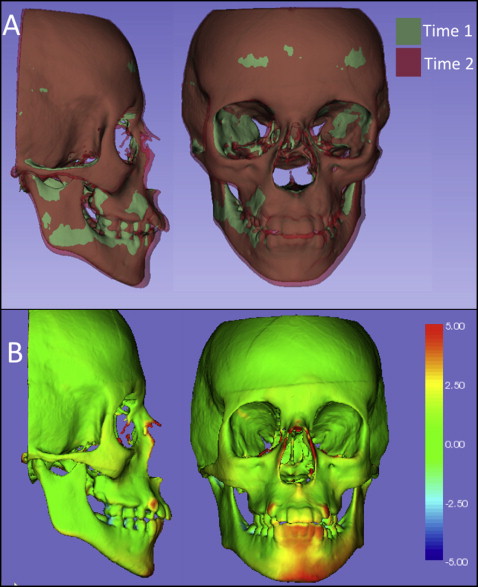
For visual analytics with graphic display of 3D morphologic variability and changes over time, after registration, the registered 3D volumetric label maps can then be saved as 3D triangular or polygonal meshes (3D surface models) in .obj, .ply, .vtk., .stl, or .U3D file formats and can be used for (1) overlays with contrasting opaque or semitransparent colors, (2) 2D linear distances between landmarks, and (3) 3D linear distances graphically displayed with color-coded maps computed using closest or corresponding surface points. The overlays provide visual qualitative assessment of the location and direction of changes or morphologic differences. Quantitative assessments can provide distances and angles between landmarks and planes in the surface models or color-coded surface distance maps graphically displayed on the surface models.
Landmark-based measurements can cause errors related to landmark identification. Locating 3D landmarks on complex curving structures is not a trivial problem for representation of the components of the craniofacial form. As Bookstein noted, there is a lack of literature about suitable operational definitions for the landmarks in the 3 planes of space (coronal, sagittal, and axial).
Three-dimensional surface distances computed at the vertices of the triangular meshes can be computed as closest points between noncorrespondent surface meshes or as homologous or correspondent points between correspondent surface meshes. The computation of the surface distances can be stored as color-coded distances in the .obj, .ply, or .vtk file format that can be uploaded in the online publications. Currently, the visualization of the color-coded maps on the Elsevier 3D viewer appears faded, and users cannot adjust the range of the colors in the color-coded map yet, but readers can download the surface models that store the color-coded maps and then upload those models in another software of choice, such as Paraview ( http://www.paraview.org ) or the ShapePopulationViewer module in Slicer 4.4 (tutorial available at http://www.youtube.com/user/DCBIA ).
Closest-point distances measure the closest distances between the vertices of the triangular meshes in 2 surfaces, not corresponding distances between anatomic points on 2 or more longitudinally obtained models. This standard analysis is currently used by most commercial and academic softwares but does not map corresponding surfaces based in anatomic geometry and usually underestimates large rotational and translational movements. Closest-point distances can be displayed with color-coded maps, as proposed by Gerig et al.
Shape correspondence, as computed with the SPHARM-PDM module, was developed as part of the National Alliance of Medical Image Computing (NIH Roadmap for Medical Research) and has been adapted for use with CBCT images of the craniofacial complex. The SPHARM-PDM software (version 1.12; open source, http://www.nitrc.org/projects/spharm-pdm ) computes point-based surface models, where all models have the same numbers of triangular meshes and vertices in corresponding (homologous) locations. This software is now distributed as the SPHARM-PDM extension module in the Slicer 4.4. Corresponding surface distances and vectors can then be calculated with the “model to model distance” extension module and graphically displayed in the Slicer “shape population viewer” extension module ( http://www.youtube.com/user/DCBIA ; video 5).
Once the 3D image analysis procedures have been completed, the 3D registered surface models can be saved as .obj, .ply, .U3D, or .vtk files and uploaded by authors as they submit their manuscripts in the AJO-DO Elsevier Web site. Authors can submit each 3D model in 3D figures as separate zipped files that are uploaded for online articles via the “3D models” submission category. The current Elsevier submission system recommends a 3D model size of 50 to 100 MB before zipping. Authors can indicate in their cover letters whether the manuscript should be considered as an online-only publication or as an original article for the printed publication, in which all the 2D figures can be printed and in which the figure legends and descriptions for the 3D figures can refer the readers to the online versions. The 3D visualization provided by the Elsevier 3D viewer in the online articles combines local (WebGL) and remote (ParaViewWeb) rendering techniques. The Web browser and the size of the 3D data are analyzed to ensure that users are given optimal support and can interact with the 3D models in real time. The remote rendering option is based on ParaViewWeb, a collaborative Web interface for 3D interaction built on the ParaView open-source client/server architecture. With this technology, 3D rendering is performed remotely to enable users with limited computing resources to interact with large scenes. For local rendering, the WebGL viewer calls upon the client’s graphics processing unit to render 3D scenes directly in a Web browser. The resulting hybrid viewer enables Elsevier subscribers to surpass the limitations of current digital publications and interact with data in a meaningful way. Readers can see data sets in 3 views (axial, sagittal, and coronal); can pan, rotate, and zoom in or out on models of interest; can apply different settings such as color; can load multiple registered files (that can be best visualized in the current Elsevier 3D viewer one at a time); can download the data set; and can visualize semitransparent overlays and analytical color maps in their image analysis software of choice.
Result
Assessments of 3D changes with visual analytic graphics are displayed and presented as illustrations in this article in 2 formats (2D figures and 3D files available online) to facilitate the reader’s understanding.
For online versions, all registered 3D surface models were saved as multiple models in .vtk file format; they are designed to be loaded in the Elsevier 3D viewer and are now available for readers to interact with them. The 2D figures show snapshots or perspective views of the different visualizations that readers can now obtain from the 3D figures when they load the 3D files in the Elsevier 3D viewer or download the 3D files to visualize them in their software of choice. The visualization of 3D superimpositions in the current Web-based Elsevier 3D viewer is hampered by the inability to adjust opacity when 2 or more 3D models are loaded simultaneously, and the color-coded maps appear faded in 1 tone because the color-coded surface distances stored in the 3D file cannot be displayed with different ranges of colors. This makes it difficult for readers to interpret and understand the results of the superimpositions using the current Elsevier 3D viewer. The Elsevier 3D viewer does allow readers to download the 3D surface models for visualization in the reader’s image analysis software of choice.
Figures 1 through 5 and Supplementary Figures 1 through 4 show the 3D surface models of a patient who was followed during his growth spurt before treatment at 2 time points, 1 year 6 months apart (T1, 11.5 years; T2, 13 years). Figure 6 and Supplementary Figure 5 show 3D surface models before and after an adult patient’s surgical correction with bimaxillary advancement, mandibular counterclockwise rotation, and genioplasty.