Abstract
A retrospective cohort study was performed to evaluate the use of panoramic radiographs as a screening tool for low bone mass in postmenopausal women. Female subjects aged ≥50 years were included. The predictor variables were gonial angle, antegonial angle, mandibular cortical bone integrity, periodontal disease status, and number of remaining teeth. The primary outcome variable was bone mineral density status. Descriptive and logistic regression statistics were computed; P < 0.05 was considered significant. The sample was composed of 273 subjects, aged 50–89 years. Visual assessment of mandibular cortical bone integrity demonstrated a statistically significant correlation with low bone mass diagnosis on univariate logistic regression ( P = 0.019), but lost significance on multivariate analysis with age, body mass index, and number of remaining teeth ( P = 0.6). A visual estimation of the mandibular cortical bone integrity from panoramic radiographs may be useful for identifying postmenopausal women at high risk for osteoporosis.
Osteoporosis is characterized by loss of bone mineral density (BMD) and deterioration of bone architecture, with consequent susceptibility to fractures, even with minimal force. The World Health Organization (WHO) has established the diagnosis of osteoporosis as a BMD that is −2.5 standard deviations below the young female mean, as measured by dual emission X-ray absorptiometry (DXA). The acceleration of bone mineral degradation during menopause from decreased levels of oestrogen causes postmenopausal women to be especially prone to complications arising from osteoporosis, with approximately one in five women over the age of 50 years in the USA living with osteoporosis. Osteoporotic fractures are a significant source of morbidity and mortality, with common sites involving the wrist, vertebrae, and hip. Hip fractures are associated with a 30% increased mortality rate in the year following injury as a result of complications including deep vein thrombosis and pulmonary embolism. Additionally, one out of every two white women will experience an osteoporotic fracture during her lifetime and one in five will suffer a hip fracture. The early detection of osteoporosis is a very important public health goal because interventions such as drug therapy, exercise, and fall-prevention measures can decrease the incidence of fractures.
Dental panoramic radiographs are a routine part of dental care and are often used in check-ups and treatment planning. Dental radiographs may have great potential as a screening tool for osteoporosis because of their widespread use, practicality, and low cost. Measurements such as gonial angle and visual assessments of mandibular bone health can be extrapolated from a panoramic radiograph. The potential role of panoramic radiography is to use radiographs that are obtained for dental purposes to help identify especially high-risk postmenopausal women who should be referred for a formal diagnosis of osteoporosis.
Multiple studies have examined the mandibular changes resulting from systemic decreases in BMD. One study found that mandibular mineral content is reduced in subjects with osteoporotic fractures, and another demonstrated that mandibular density measured by DXA scan correlates with skeletal BMD. The search for morphological changes demonstrated in panoramic radiographs that correlate with osteoporosis has revealed varying results. Devlin and Horner reported a statistically significant relationship between mental index measurements and the diagnosis of reduced BMD. However, they discouraged the use of dental panoramic measurements in diagnosing osteoporosis and instead suggested that such measurements may be useful as part of an osteoporosis risk assessment. Passos et al. recently reported significant correlations between both mandibular cortical bone thickness and the panoramic mandibular index and decreased BMD. While multiple studies have attempted to identify panoramic markers that correlate with decreased BMD, controversy remains regarding the markers that offer the best performance. The aim of the current study was to identify which panoramic markers are useful in screening postmenopausal women for osteopenia/osteoporosis.
Materials and methods
Study sample
A retrospective cohort study design was used. Clinic records of the department of oral and maxillofacial surgery for the period 2006–2012 were screened to identify female subjects aged 50 years or older. The records were then checked for the presence of both a dental panoramic radiograph and a DXA measurement taken within 3 years of each other. Due to the retrospective nature of this study, it was granted an informed consent exemption in writing by the institutional review board of the hospital. Since menses status was not taken routinely for subjects, age ≥50 years was taken as postmenopausal status. Edentulous subjects, subjects with a previous diagnosis of metabolic bone disease (e.g., Paget’s disease of bone, osteogenesis imperfecta), and subjects with bone destructive lesions were excluded from the study. Subjects with uninterpretable panoramic radiographs were also excluded.
Demographic information
Medical information was accessed from each subject’s hospital electronic medical record. Information recorded for each subject included age at the time of BMD measurement, ethnicity, and body mass index (BMI).
Radiographic measurements
Panoramic radiographs were recorded digitally within the department of oral and maxillofacial surgery using a Planmeca ProMax Dimax 3 (Planmeca, Roselle, IL, USA). Measurement and interpretation were performed with Planmeca Romexis version 2.4.2.R (2010). Unless uninterpretable, all panoramic radiograph measurements were performed on both the left and right sides.
A single observer (SG), blinded to BMD status, performed the following measurements: (1) Gonial angle, measured by tracing a line tangent to the lower border of the mandible and another line tangent to the posterior border of the ramus on each side. The intersection of these lines formed the gonial angle. This method has been described previously by Dutra et al. ( Fig. 1 ). (2) Antegonial angle, measured by tracing two lines parallel to the lower cortical border at the antegonial region and measuring the angle of their intersection at the deepest point of the antegonial notch. This method has been described previously by Dutra et al. ( Fig. 1 ). (3) Number of teeth, determined by counting the number of remaining teeth in the mandible and maxilla from the panoramic radiograph. Implants were not counted as teeth.
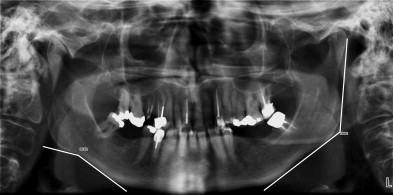
Additional panoramic parameters were assessed by a single observer (MA), blinded to both age and BMD status: (1) Periodontal status was determined by a visual estimation of the level of bone loss around teeth with the most apparent levels of bone loss. Bone loss was categorized as no bone loss, mild (less than a third of the root exposed), moderate (between a third and two-thirds of the root exposed), and severe (more than two-thirds of the root exposed). In addition, localized versus generalized patterns of bone loss were noted. (2) Mandibular cortical bone integrity was measured by a visual assessment of the inferior cortical bone of the mandible. Loss of mandibular cortical bone integrity, or scalloping, was characterized as no scalloping, mild (less than a third thickness of the inferior cortex), moderate (between a third and two-thirds thickness of the inferior cortex), and severe (more than two-thirds thickness of the inferior cortex) ( Fig. 2 ).

Bone densitometry
All subjects had BMD measurements taken by DXA, the gold standard for diagnosing osteoporosis. Subjects were classified according to the WHO classification as normal ( T -score > −1), osteopenic ( T -score of −1 to −2.5), or osteoporotic ( T -score < −2.5), based on the lowest BMD classification at all available sites. The location and number of skeletal sites with available BMD measurements varied between subjects. The DXA T -score demonstrates a subject’s BMD relative to a young, healthy, ethnicity-matched female mean.
Statistical analysis
Data analysis was performed using SAS software version 9.3 (SAS Institute, Cary, NC, USA). Descriptive and logistic regression statistics were computed to analyse the relationship between the predictor variables and decreased BMD. P -values of <0.05 were considered significant. Each variable was analysed for correlation with osteoporotic status in a logistic regression model. The dependent variable was BMD status, with subjects classified as either healthy or osteoporotic/osteopenic. Variables that demonstrated significance in a univariate logistic regression model were run in a multivariate logistic regression model. A logistic regression model was chosen to evaluate the panoramic markers because the issue at hand was identifying the ability to screen for a categorical result (osteoporosis/osteopenia) and not a given marker’s correlation with bone density in general.
Results
The initial screening of female subjects aged ≥50 years between 2006 and 2012 yielded 4511 subjects. Two hundred and eighty-four subjects had both dental panoramic radiographs and DXA measurements taken within 3 years of each other. After excluding uninterpretable radiographs, the final study sample comprised 273 subjects. Table 1 summarizes the demographics of the study sample. The mean age of the sample was 64.0 ± 9.3 years. The average BMD T -score was −1.59 ± 1.11; 27.1% of the subjects were healthy (BMD T -score > −1), 50.9% were osteopenic (BMD T -score between −1 and −2.5), and 22.0% were osteoporotic (BMD T -score < −2.5).
| Characteristic | n | % |
|---|---|---|
| Age, years | ||
| 50–59 | 102 | 37.4 |
| 60–69 | 98 | 35.9 |
| 70–79 | 47 | 17.2 |
| 80+ | 26 | 9.5 |
| Bone status | ||
| Healthy | 74 | 27.1 |
| Osteopenia | 139 | 50.9 |
| Osteoporosis | 60 | 22.0 |
| Ethnicity a | ||
| Caucasian | 241 | 88.6 |
| African American | 19 | 7.0 |
| Asian | 6 | 2.2 |
| Hispanic | 6 | 2.2 |
| Total | 273 | 100 |
Table 2 shows a comparison of the demographics and panoramic markers between the healthy and low BMD groups. The results of the logistic regression analysis of the panoramic markers are given in Table 3 . Of the predictor variables examined, mandibular cortical bone integrity ( P = 0.019), age ( P < 0.0001), and BMI ( P < 0.0001) showed significant correlations with a BMD diagnosis of osteoporosis.
| Healthy, mean (SD) [range] | Low BMD, mean (SD) [range] | |
|---|---|---|
| Characteristics | ||
| Number | 74 | 199 |
| Age, years | 60.2 (8.1) [50–82] | 65.4 (9.3) [50–90] |
| Height, m | 1.6 (0.07) [1.5–1.8] | 1.6 (0.07) [1.4–1.8] |
| Weight, kg | 81.8 (16.4) [47.6–133.4] | 66.2 (14.9) [38.1–137.9] |
| BMI, kg/m 2 | 30.3 (6.1) [19.2–50.2] | 30.3 (6.1) [19.2–50.2] |
| Indices | ||
| Gonial angle | 127.7 (6.4) [109.9–148.7] | 128.3 (6.6) [111.2–149.6] |
| Antegonial angle | 165.8 (6.9) [148.1–180.0] | 164.7 (7.6) [128.4–180.0] |
| Number of teeth | 22.4 (6.0) [1–32] | 23.7 (5.7) [1–32] |
Stay updated, free dental videos. Join our Telegram channel
VIDEdental - Online dental courses


