Introduction
The craniofacial morphology of subjects with cleft lip and palate differs from that of subjects without clefts. Subjects with bilateral cleft lip and palate tend to have maxillary retrognathism, a smaller mandible with an obtuse gonial angle, greater anterior upper and lower facial heights, and retroclined maxillary incisors. The purposes of this research were to compare the skeletal and upper-airway features of subjects with bilateral cleft lip and palate with the same features in control subjects without clefts and to determine the growth-related changes at different growth stages.
Methods
The sample comprised 212 subjects divided into 2 groups: 68 with bilateral cleft lip and palate, and 144 controls without clefts; each group was further divided into 4 subgroups according to growth stage using the cervical vertebral maturation stage method. The subgroups were defined as early childhood (stage 1), prepubertal (stage 2), pubertal (stage 3), and postpubertal (stage 4). The cephalometric variables were evaluated with 2-way analysis of variance and the Bonferroni test.
Results
Maxillary position showed no significant differences between the male groups. The maxilla was more prognathic at stage 2 and became more retrognathic at stages 3 and 4 in the females. The mandible was more retrusive in the bilateral cleft lip and palate subjects at stage 1 in males and at stages 3 and 4 in females. ANB was larger at stages 1 and 2, and it became similar to the controls at stages 3 and 4 in male and female bilateral cleft lip and palate subjects. Vertical growth was seen in the bilateral cleft lip and palate subjects regardless of sex, and no change was observed with age. Posterior airway space was narrower in all stages (except for stage 1 in females). Middle airway space was wider after stage 1 in the male and female bilateral cleft lip and palate subjects. Inferior airway space was narrower in the male bilateral cleft lip and palate patients at the early childhood and pubertal stages.
Conclusions
Age- and sex-dependent differences in skeletal morphology and upper-airway widths of the bilateral cleft lip and palate subjects were identified when compared with the control subjects without clefts.
Highlights
- •
Craniofacial morphology was compared in patients with cleft lip and palate and controls.
- •
Age- and sex-dependent differences were identified.
- •
With age, the maxilla became more retrusive in the cleft subjects.
- •
Bilateral cleft patients had Class II skeletal relationships when young and Class I later.
- •
Vertical growth occurred in cleft subjects, regardless of sex.
The craniofacial morphology of subjects with cleft lip and palate differs from that of subjects without clefts. In subjects with bilateral cleft lip and palate (BCLP), maxillary retrognathism, a smaller mandible with an obtuse gonial angle, greater anterior upper and lower facial heights, and retroclined maxillary incisors are observed.
In the sagittal relationships, the positions of the maxilla and the mandible influence the upper-airway space. In healthy subjects, airway dimensions are influenced not only by the position of the jaws but also by age. The volume of the airway increases from 7 to 18 years of age in both female and male subjects, with male patients having a faster rate. In female subjects, the length of the airway increases from 7 to 15 years of age without further lengthening after 15 years of age, whereas it continues to increase up to 18 years of age in male subjects. The upper-airway width increases from 6 to 18 years of age in both sexes.
BCLP is seen less commonly than unilateral cleft lip and palate. Few studies pertain to BCLP, and changes in upper-airway dimensions in subjects with BCLP have not been investigated comprehensively. Studies on airways have focused on either unilateral or mixed samples of patients with cleft lip and palate or adult BCLP patients. Therefore, the purposes of this study were to compare the skeletal and upper-airway features in subjects with operated BCLP with growth-matched control subjects without clefts and to determine whether the growth-related changes occur in the upper airway at different maturation stages. The null hypotheses were that skeletal and upper-airway features of operated BCLP patients do not differ from the controls and do not change with growth.
Material and methods
This study consisted of a total of 212 lateral cephalometric radiographs of patients with BCLP and noncleft control (NCC) patients who had never had orthodontic treatment. The BCLP group included 68 subjects, and the NCC group included 144 subjects. Ethical approval for the study was obtained from Hacettepe University in Ankara, Turkey (reference number GO 13/126-13).
The inclusion criteria for the BCLP group were (1) bilateral cleft lip and palate, (2) no other associated craniofacial anomalies, (3) no previous orthodontic treatment, and (4) primary surgical interventions by the same operator. The radiographs, which were insufficient in terms of landmark identification, were not included. All patients had received cheiloplasty and palatoplasty. Lip repair was done at approximately 3 months of age with Mulliken and modified Millard procedures. The hard palate was repaired at approximately 12 months of age with a 2-flap palatoplasty.
All patients selected for the BCLP group were of Turkish origin. The group was divided into 4 subgroups according to their growth level. The growth maturation levels of patients were expressed on the lateral cephalograms using the cervical vertebral maturation (CVM) method, determined by Franchi et al. The subgroups were then defined as early childhood, prepubertal, pubertal, and postpubertal to place the patients in their correct CVM stage. Patients younger than 7 years of age were assigned to the early childhood stage, and the remaining patients were assigned to the prepubertal, pubertal, and postpubertal stages. The early childhood stage (stage 1) included 16 subjects (<7 years old), the prepubertal stage (stage 2) comprised 25 subjects (CVM stages 1 and 2), the pubertal stage (stage 3) included 13 subjects (CVM stages 3 and 4), and the postpubertal stage (stage 4) consisted of 14 subjects (CVM stages 5 and 6).
The NCC group consisted of the lateral cephalometric radiographs of 144 subjects without clefts; 124 of them, who were selected from the archives of the Department of Orthodontics at Hacettepe University, were of Turkish origin. Because of the lack of files of subjects without clefts at early childhood ages, 20 lateral cephalograms of Class I subjects without clefts were obtained from several growth studies (Michigan, Forsyth, and Iowa) in the Craniofacial Growth Legacy Collection of the American Association of Orthodontists Foundation. All radiographs were sent to the primary investigator (B.A.-G.) as encoded high-resolution JPEG files.
The inclusion criteria for the NCC group were (1) Class I skeletal pattern (ANB, 2° to ≤6° for patients at stage 1; ANB, 1° to ≤4° for patients at other stages), (2) Class I molar relationship, and (3) no previous orthodontic treatment. The radiographs, which were low quality, were not included.
The NCC group was also divided into subgroups using the CVM method. The control group included 20 subjects in stage 1, 37 subjects in stage 2, 45 subjects in stage 3, and 42 subjects in stage 4 according to their maturation levels.
The male and female compositions of the BCLP and the NCC groups were evaluated separately. Age and sex distributions for both groups are presented in Table I .
| Study sample | CVM stage | BCLP | NCC | ||
|---|---|---|---|---|---|
| n = 68 | Age (y) | n = 144 | Age (y) | ||
| Males | |||||
| 1 | 11 | 4.8 ± 0.9 | 7 | 4.9 ± 0.7 | |
| 2 | 19 | 8.7 ± 1.7 | 22 | 11.1 ± 2 | |
| 3 | 9 | 14.1 ± 1.6 | 26 | 14.1 ± 1.3 | |
| 4 | 10 | 19.2 ± 3.5 | 19 | 20.2 ± 4.7 | |
| Total | 49 | 11 ± 5.5 | 74 | 13.9 ± 5.3 | |
| Females | |||||
| 1 | 5 | 4.6 ± 0.9 | 13 | 5.2 ± 0.9 | |
| 2 | 6 | 9.3 ± 1.6 | 15 | 10 ± 1.6 | |
| 3 | 4 | 11.8 ± 1.3 | 19 | 12.7 ± 1.2 | |
| 4 | 4 | 23.3 ± 5.7 | 23 | 18.5 ± 3.6 | |
| Total | 19 | 11.5 ± 7.2 | 70 | 12.6 ± 5.4 | |
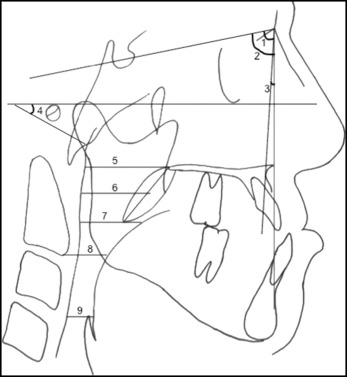
Cephalometric variables representing skeletal pattern were assessed by the cephalometric analysis of Steiner. Analysis of pharyngeal airway size was based on the method of Mochida et al. All lateral cephalometric radiographs were traced manually, and all angular and linear measurements were done by 1 author (B.A.-G.) and reviewed by the senior investigator (M.A.) to check the accuracy of landmark identification. Magnification of the cephalometric images was adjusted according to the appropriate enlargement factor for each lateral cephalometric film. Both skeletal and pharyngeal airway size measurements are presented in Figure 1 . For the upper-airway measurements, the Frankfort horizontal plane was used as the horizontal reference plane. All measurements were made between the posterior pharyngeal wall and designated landmarks parallel to the Frankfort horizontal plane. Posterior airway space (PAS) was defined as a line that passed through the posterior nasal spine, superoposterior airway space (SPAS) was defined as a line passing through the middle of the line from the posterior nasal spine to the tip of the soft palate, middle airway space (MAS) was defined as a line passing through the tip of the soft palate, inferior airway space (IAS) was defined as a line that passed through the most anteroinferior point on the body of the second cervical vertebra, and epiglottic airway space (EAS) was defined as a line that passed through the tip of the epiglottis.
Statistical analysis
Descriptive statistics were expressed as means and standard deviations. The independent variables were stages (1-4) and cleft (BCLP, NCC). The dependent variables were skeletal measurements (SNA, SNB, ANB, FMA) and upper-airway measurements (PAS, SPAS, MAS, IAS, EAS). Two-way analysis of variance (ANOVA) was used to evaluate the main effects of the groups and the interaction effects between them for the skeletal and upper-airway variables ( Table II ). After analyses, the main effect that involved each independent variable and the interaction effect of that factor on the other factor was examined. Group effects were cleft type (BCLP, NCC) and stage (1-4). All 2-way ANOVA tests were performed separately by sex (male, female). When there was a significant difference among the means, the Bonferroni test was performed as post hoc multiple comparisons. P values <0.05 were considered significant.
| P value | |||
|---|---|---|---|
| Stage | Cleft | Stage-cleft | |
| Male subjects | |||
| Skeletal variables | |||
| SNA (°) | 0.057 | 0.878 | 0.306 |
| SNB (°) | 0.222 | 0.005 ∗ | 0.020 † |
| ANB (°) | 0.000 ‡ | 0.001 ∗ | 0.010 † |
| FMA (°) | 0.590 | 0.000 ‡ | 0.104 |
| Upper-airway variables | |||
| PAS (mm) | 0.002 ∗ | 0.000 ‡ | 0.514 |
| SPAS (mm) | 0.266 | 0.001 ∗ | 0.411 |
| MAS (mm) | 0.038 † | 0.000 ‡ | 0.011 † |
| IAS (mm) | 0.000 ‡ | 0.009 ∗ | 0.021 † |
| EAS (mm) | 0.011 † | 0.004 ∗ | 0.534 |
| Female subjects | |||
| Skeletal variables | |||
| SNA (°) | 0.000 ‡ | 0.038 † | 0.001 ∗ |
| SNB (°) | 0.142 | 0.000 ‡ | 0.160 |
| ANB (°) | 0.000 ‡ | 0.000 ‡ | 0.000 ‡ |
| FMA (°) | 0.897 | 0.000 ‡ | 0.119 |
| Upper-airway variables | |||
| PAS (mm) | 0.071 | 0.000 ‡ | 0.478 |
| SPAS (mm) | 0.375 | 0.119 | 0.690 |
| MAS (mm) | 0.189 | 0.000 ‡ | 0.337 |
| IAS (mm) | 0.001 ∗ | 0.697 | 0.411 |
| EAS (mm) | 0.066 | 0.547 | 0.428 |
Results
Comparisons of the skeletal and upper-airway measurements at each stage between the BCLP and NCC groups are presented in Tables III and IV . Comparisons of the measurements among the stages in the male and female BCLP and NCC groups are presented in Tables V-VIII , respectively.
| Stage 1 | Stage 2 | Stage 3 | Stage 4 | |||||||||
|---|---|---|---|---|---|---|---|---|---|---|---|---|
| BCLP | NCC | P | BCLP | NCC | P | BCLP | NCC | P | BCLP | NCC | P | |
| Skeletal variables | ||||||||||||
| SNA (°) | 81.7 ± 6.2 | 81.8 ± 1.2 | 0.977 | 81 ± 6.3 | 78.9 ± 3 | 0.125 | 77.5 ± 4.8 | 79.5 ± 3 | 0.236 | 78.9 ± 4.4 | 78.4 ± 3.4 | 0.774 |
| SNB (°) | 70.5 ± 7.6 | 77.4 ± 0.5 | 0.001 ∗ | 74.9 ± 4.8 | 76.1 ± 2.8 | 0.359 | 74.2 ± 3.3 | 76.9 ± 3 | 0.098 | 77.3 ± 6.4 | 76.1 ± 3.3 | 0.469 |
| ANB (°) | 11.3 ± 5.4 | 4.4 ± 1.3 | 0.000 ∗ | 6 ± 6.1 | 2.8 ± 0.9 | 0.008 † | 3.3 ± 6.7 | 2.5 ± 0.7 | 0.613 | 1.6 ± 6.3 | 2.3 ± 0.7 | 0.613 |
| FMA (°) | 33.8 ± 5.9 | 26 ± 5.1 | 0.001 ∗ | 31.4 ± 5.5 | 30.3 ± 4.9 | 0.468 | 31 ± 4.2 | 27.4 ± 3.8 | 0.054 | 32.3 ± 4.6 | 27.7 ± 4.7 | 0.015 ‡ |
| Upper-airway variables | ||||||||||||
| PAS (mm) | 15.3 ± 3.8 | 21.9 ± 3.2 | 0.000 ∗ | 14.4 ± 3.8 | 20.8 ± 3.6 | 0.000 ∗ | 18.5 ± 2.8 | 22.5 ± 3.2 | 0.003 † | 17.3 ± 4.9 | 23.6 ± 2.9 | 0.000 ∗ |
| SPAS (mm) | 7.6 ± 2.7 | 9.3 ± 3.1 | 0.188 | 8.1 ± 2.5 | 9.4 ± 2.7 | 0.157 | 9.1 ± 4.5 | 10.1 ± 1.8 | 0.345 | 8.1 ± 2.6 | 11.4 ± 2.9 | 0.003 † |
| MAS (mm) | 11.9 ± 2.6 | 11.1 ± 4.6 | 0.616 | 12.9 ± 2.5 | 8.6 ± 2.6 | 0.000 ∗ | 13.6 ± 5.1 | 8.6 ± 2.3 | 0.000 ∗ | 16.7 ± 4.8 | 9.3 ± 2.6 | 0.000 ∗ |
| IAS (mm) | 9.1 ± 1.9 | 13.2 ± 4 | 0.008 † | 8.6 ± 2.9 | 9.2 ± 2.1 | 0.535 | 6.6 ± 2.7 | 9.7 ± 3 | 0.011 ‡ | 11.8 ± 4 | 10.7 ± 3.9 | 0.357 |
| EAS (mm) | 9.3 ± 2.2 | 12.2 ± 3.7 | 0.060 | 8.7 ± 2.9 | 9.2 ± 2.3 | 0.633 | 8.6 ± 2.8 | 10.6 ± 3.1 | 0.099 | 10.6 ± 4.9 | 12.5 ± 3.9 | 0.127 |
| Stage 1 | Stage 2 | Stage 3 | Stage 4 | |||||||||
|---|---|---|---|---|---|---|---|---|---|---|---|---|
| BCLP | NCC | P | BCLP | NCC | P | BCLP | NCC | P | BCLP | NCC | P | |
| Skeletal variables | ||||||||||||
| SNA (°) | 80.6 ± 7.2 | 81 ± 3.1 | 0.846 | 83.8 ± 2.7 | 80.3 ± 3 | 0.049 ∗ | 76.5 ± 1.7 | 80.5 ± 1.7 | 0.049 ∗ | 72 ± 9.9 | 79.2 ± 3.2 | 0.000 † |
| SNB (°) | 73.2 ± 5.5 | 76.2 ± 2.4 | 0.085 | 75.8 ± 3.8 | 77 ± 3.5 | 0.432 | 72.9 ± 2.8 | 78 ± 1.8 | 0.006 ‡ | 70.5 ± 7 | 76.8 ± 3.1 | 0.001 † |
| ANB (°) | 7.4 ± 2.1 | 4.8 ± 1.8 | 0.006 ‡ | 8 ± 4.5 | 3.3 ± 1 | 0.000 † | 3.6 ± 3.4 | 2.5 ± 0.5 | 0.250 | 1.5 ± 3.4 | 2.4 ± 0.6 | 0.366 |
| FMA (°) | 32.2 ± 12.3 | 27.5 ± 4.2 | 0.075 | 31.9 ± 5 | 28.7 ± 4.4 | 0.183 | 34 ± 4.5 | 25.8 ± 3.1 | 0.003 ‡ | 36.8 ± 11 | 25.5 ± 2.6 | 0.000 † |
| Upper-airway variables | ||||||||||||
| PAS (mm) | 16.2 ± 5.7 | 18.6 ± 4.4 | 0.223 | 16 ± 2.6 | 20.6 ± 3.5 | 0.012 ∗ | 16.5 ± 2.7 | 22.9 ± 3.6 | 0.002 ‡ | 17.9 ± 3.9 | 23.7 ± 3.1 | 0.004 ‡ |
| SPAS (mm) | 9.6 ± 1.8 | 17.4 ± 20.3 | 0.070 | 7.4 ± 3.3 | 9.7 ± 2.3 | 0.544 | 9.6 ± 0.8 | 11 ± 1.6 | 0.748 | 8.8 ± 2.8 | 10.5 ± 2.3 | 0.685 |
| MAS (mm) | 12.6 ± 4.7 | 10.4 ± 2.4 | 0.165 | 12.4 ± 4.1 | 8.1 ± 1.8 | 0.003 ‡ | 15.7 ± 3.5 | 9.5 ± 1.8 | 0.000 † | 14.2 ± 7.9 | 9 ± 2.5 | 0.002 ‡ |
| IAS (mm) | 13.6 ± 4 | 11.8 ± 3.3 | 0.326 | 8.2 ± 3.1 | 7.7 ± 2.9 | 0.773 | 8.2 ± 2.5 | 10.3 ± 3.6 | 0.284 | 7.9 ± 3.2 | 9.5 ± 3.7 | 0.381 |
| EAS (mm) | 11.9 ± 3.8 | 10.7 ± 3.8 | 0.474 | 7.6 ± 1.9 | 8.9 ± 2.6 | 0.424 | 9.1 ± 2.4 | 11.6 ± 3.8 | 0.166 | 10.6 ± 0.8 | 10.2 ± 3.3 | 0.794 |
| Skeletal variables | Group | Stage 1–2 | Stage 2–3 | Stage 3–4 | ||||||
|---|---|---|---|---|---|---|---|---|---|---|
| Mean difference | SE | P | Mean difference | SE | P | Mean difference | SE | P | ||
| SNA (°) | BCLP | −0.8 | 1.6 | 1.000 | −3.4 | 1.7 | 0.286 | 1.4 | 2.0 | 1.000 |
| NCC | −2.9 | 1.8 | 0.716 | 0.6 | 1.2 | 1.000 | −1.0 | 1.3 | 1.000 | |
| SNB (°) | BCLP | 4.5 | 1.6 | 0.036 ∗ | −0.7 | 1.7 | 1.000 | 3.1 | 1.9 | 0.687 |
| NCC | −1.3 | 1.8 | 1.000 | 0.8 | 1.2 | 1.000 | 0.0 | 1.3 | 1.000 | |
| ANB (°) | BCLP | −5.2 | 1.5 | 0.003 † | −2.7 | 1.6 | 0.490 | −1.7 | 1.8 | 1.000 |
| NCC | −1.6 | 1.7 | 1.000 | −0.2 | 1.1 | 1.000 | −0.2 | 1.2 | 1.000 | |
| FMA (°) | BCLP | −2.4 | 1.8 | 1.000 | −0.4 | 1.9 | 1.000 | 1.3 | 2.2 | 1.000 |
| NCC | 4.3 | 2.1 | 0.255 | −2.9 | 1.4 | 0.240 | 0.3 | 1.4 | 1.000 | |
Stay updated, free dental videos. Join our Telegram channel
VIDEdental - Online dental courses


