Introduction
The primary stability of a mini-implant is critical, since most orthodontic mini-implant failures occur at an early stage. As orthodontic mini-implants have restrictions in diameter and length, an optimal design of the shape is important for sufficient primary stability. The purpose of this study was to investigate the influence of various mini-implants design factors, including thread depth, degree of taper, and taper length on insertion torque, pullout strength, stiffness, and screw displacement before failure.
Methods
Finite element analyses were conducted first for identification of optimal design parameters. Four types of mini-implants with different design parameters were then custom manufactured and tested mechanically. All mechanical tests were performed in artificial bone with homogenous density to remove the variability associated with bone.
Results
Finite element results showed that, for mini-implants with a fixed external diameter of 2 mm, a thread length of 9.82 mm, and a pitch of 0.75 mm, those with greater thread depths, smaller taper degrees, and shorter taper lengths generated higher maximum stresses on the bone and thread elements. These mini-implants also had larger relative displacements. Maximum pullout resistance was attained with a core/external diameter ratio of 0.68. All mechanical results were compatible with the findings in the finite element analyses.
Conclusions
Modification of the mini-implant design can substantially affect the mechanical properties. The finite element method is an effective tool to identify optimal design parameters and allow for improved mini-implant designs.
Mini-implants have been used as temporary anchorage in orthodontics for various purposes. They have gained popularity over implants, onplants, and miniplates because of their versatility, minimal surgical invasiveness, ease of insertion and removal, ready use after initial wound healing, and low cost. Whereas dental implants have high success rates at 81% to 100%, the reported success rates of mini-implants are not satisfactory, ranging from 0% to 100% with failure rates of 10% to 30% in most instances.
Factors associated with mini-implant failure include screw diameter and type, patient age, mandibular plane angle, cortical bone thickness, character of soft tissues, implant site, placement torque, force level, inflammation of peri-implant tissues, and type of orthodontic movement. Whereas most orthodontic mini-implant failures occur at an early stage, the primary stability of a mini-implant is critical. Factors related to the primary stability of mini-implants include bone quality, implant site preparation, insertion angle, and mini-implant designs such as screw diameter, length, thread form, pitch, size of thread ridge, presence of abutment, and screw material.
Although mini-implants remain clinically stable, they extrude and tip under orthodontic loading. To account for potential displacement and to avoid encroachment on the roots or the periodontal ligament, the diameter and the length of mini-implants should be minimal to allow a safety clearance; yet the dimension should also be large enough to overcome insufficient initial stability and possible fracture during placement or removal. Since orthodontic mini-implants have restrictions in diameter and length, an optimal design of the shape is important for sufficient primary stability.
The purpose of this study was to investigate the influence of various mini-implant design factors, including thread depth, degree of taper, and taper length on insertion torque, pullout strength, stiffness, and screw displacement before failure. Finite element analyses were conducted first for identification of the optimal design parameters. Four types of mini-implants with different design parameters were then custom manufactured and tested mechanically. All mechanical tests were performed in artificial bone with homogenous density to remove the variability associated with bone.
Material and methods
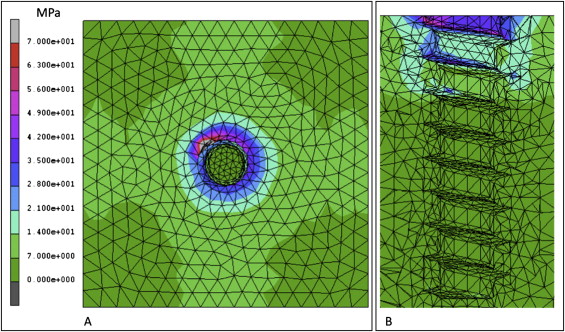
Finite element analysis was used to investigate the influence of design factors on primary stability. The basic shapes of the finite element mini-implant and bone models were illustrated by using computer-aided design software (version 2005; SolidWorks, Concord, Mass), imported into MSC.Patran 2005 (MSC Software, Santa Ana, Calif) to generate a triangulated shell-element mesh, and then transferred to MSC.Marc/Mentat 2007r1 (MSC Software) for further finite element analyses. Titanium-alloy (Ti 6 V 4 ) mini-implants with fixed 2.0-mm external diameters, 9.82-mm thread lengths, and 0.75-mm thread pitches were modeled. A cancellous bone block with a 2-mm thick cortical layer on the surface was modeled around the mini-implant with all threads imbedded in bone except for the first thread at the top. The overall dimensions of this block were 20 mm in height, 8 mm in mesiodistal length, and 8 mm in buccolingual width. Both the bone and the mini-implant elements were assumed to be homogeneous, isotropic, and linearly elastic. The material properties of the elements in the models are given in Table I . The axial-loading (pullout) condition was an axial displacement of 0.01 mm applied to the head of mini-implant. The lateral-loading condition was to apply a 3-N horizontal traction force on the exposed thread of the mini-implant parallel to the bone surface. The boundary condition was full constraint at the surface of bone. The equivalent stress (von Mises) was calculated, and the stress distributions on the bone and the mini-implant elements were evaluated. Preliminary results showed that the strain surrounding mini-implant was concentrated at the uppermost threads ( Fig 1 ). Thus, mini-implants with various designs on the uppermost threads were modulated. The total number of elements in the models ranged from 135,462 to 137,968, and the total number of nodes ranged from 12,916 to 13,064 with no degrees of freedom. To evaluate the effect of thread depth on primary stability, the thread depths of the mini-implants were set at 0.16, 0.24, 0.32, 0.40, and 0.48 mm; axial-loading and lateral-loading conditions were simulated. To investigate the influence of taper, the thread depth was fixed at 0.40 mm, and the core diameter of the 3 uppermost threads was gradually increased to create tapering of 0°, 3°, 5°, 7°, and 11°. To inspect the influence of taper length, the thread depth was fixed at 0.4 mm, and a 7° taper was set to the core of the 0, 3, and 5 uppermost threads.
| Material | Poisson’s ratio | Young’s modulus (MPa) |
|---|---|---|
| Titanium alloy | 0.3 | 110,000 |
| Cortical bone | 0.3 | 13,700 |
| Cancellous bone | 0.3 | 1,370 |
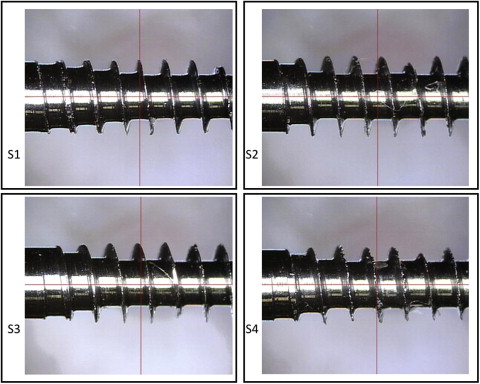
To validate the results of the finite element analyses, 4 types of self-drilling mini-implants were custom manufactured and subjected to mechanical tests ( Fig 2 ). All mini-implants had a fixed 2.0-mm external diameter, a 9.82-mm thread length, and a 0.75-mm thread pitch. The thread contour was identical for all mini-implants. Screw type 1 (S1) had a 0.4-mm thread depth and a 7° tapered core at the 5 uppermost threads. Screw type 2 (S2) had a 0.4-mm thread depth and a 0° tapered core (cylindrical core). Screw type 3 (S3) had a 0.4-mm thread depth and a 7° tapered core at the 3 uppermost threads. Screw type 4 (S4) had a 0.32-mm thread depth and a 7° tapered core at the 3 uppermost threads. Test blocks measuring 20 mm in height, 8 mm in mesiodistal length, and 8 mm in buccolingual width were cut from synthetic bone material (Sawbones; Pacific Research Laboratories, Vashon Island, Wash). A custom-made driving torque tester was used to insert the mini-implants perpendicularly into the synthetic bone blocks with a uniform speed of 25 clockwise rotations per minute and a 20-N force. The 4 groups consisted of 5 samples each. Each mini-implant was inserted until all threads except for the last thread on top were fully contained in the block. During insertion, the torque was measured every 0.1 second by using a computer program (QuickDataAcq; SDK Developer, London, United Kingdom). A dial indicator depth gauge sensitive to 0.01 mm was used to accurately measure the insertion depth of the mini-implants. Among serial values of the insertion torque, the maximum value was recognized as the maximum insertion torque. After insertion of the mini-implants into the artificial bone, the synthetic bone and mini-implant specimens were then mounted in a testing machine (model 8511; Instron, Canton, Mass). The custom-made fixture allowed pullout testing to be performed through the longitudinal axis of the mini-implant at the rate of 5 mm per minute until pullout was achieved. Pullout loads and displacements were recorded at 0.02-second intervals by using the computer program Series IX (Instron). Pullout strength was defined as the maximum load attained during testing. Displacement to failure was defined as the movement in the direction of pull during the development of the maximum load. Subsequent movement after maximum load was defined as screw failure. The bone-implant interface stiffness for each mini-implant was defined as the slope of the most linear part of the load-displacement curve before the yield point.
Statistical analysis
All statistical analyses were performed by using SAS/STAT(r) software (version 9.1.3; SAS Institute, Cary, NC). The different mini-implant designs were correlated with maximum insertion torque, pullout strength, and displacement to failure. Linear regression models were calculated. Significance was defined as P <0.05.
Results
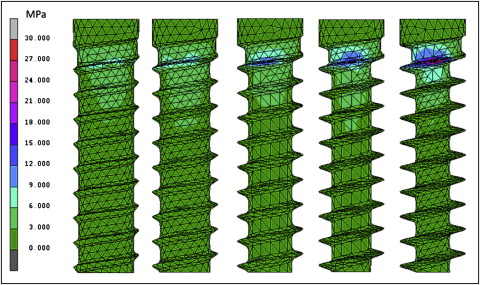
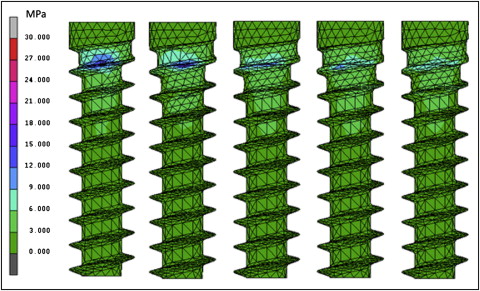
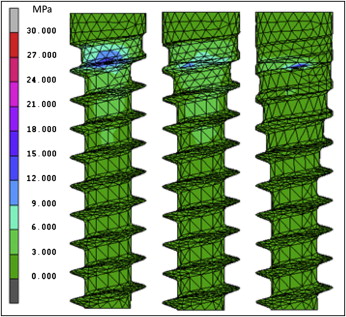
The maximum values of Von Mises equivalent stress and displacement on the bone and the thread elements of the lateral-loading models for the different thread depths, taper degrees, and taper lengths are shown in Table II . The pullout resistance values of the axial-loading models for the different thread depths, taper degrees, and taper lengths are also shown in Table II . Mini-implants with greater thread depths, smaller tapers, and shorter taper lengths generated higher maximum stresses on the bone and thread elements. These mini-implants also had larger relative displacements. Pullout resistance increased as the thread depth increased from 0.16 to 0.32 mm. However, the pullout resistance decreased as the thread depth exceeded 0.32 mm. Pullout resistance also decreased as the taper degrees and taper lengths decreased. High stresses were distributed on the uppermost threads at the neck of the mini-implants near the margin of bone in all conditions ( Figs 3-5 ).
| Maximum stress (MPa) | Maximum displacement (μm) | Pullout resistance (N) | ||||
|---|---|---|---|---|---|---|
| Mini-implant thread | Bone | Mini-implant thread | Bone | Relative displacement | ||
| Taper depth (mm) | ||||||
| 0.16 | 9.16 | 4.75 | 244.60 | 12.23 | 232.37 | 179.1 |
| 0.24 | 11.39 | 4.84 | 255.70 | 10.47 | 245.23 | 180.5 |
| 0.32 | 13.69 | 4.93 | 256.00 | 8.38 | 247.62 | 196.2 |
| 0.40 | 14.23 | 5.36 | 306.90 | 3.89 | 303.01 | 152.3 |
| 0.48 | 27.31 | 5.95 | 316.80 | 1.79 | 315.01 | 145.1 |
| Taper (°) | ||||||
| 0 | 14.23 | 5.36 | 306.90 | 3.89 | 303.01 | 152.3 |
| 3 | 13.39 | 5.26 | 278.20 | 19.52 | 258.68 | 156.8 |
| 5 | 11.69 | 5.13 | 273.70 | 17.96 | 255.74 | 161.3 |
| 7 | 10.39 | 5.00 | 268.90 | 27.55 | 241.35 | 166.4 |
| 11 | 9.13 | 4.93 | 265.00 | 30.41 | 234.59 | 167.8 |
| Taper length (n of threads on tapered core) | ||||||
| 0 | 14.23 | 5.36 | 306.90 | 3.89 | 303.01 | 152.3 |
| 3 | 10.39 | 5.00 | 268.90 | 27.55 | 241.35 | 166.4 |
| 5 | 9.27 | 4.68 | 236.50 | 16.95 | 219.55 | 176.6 |
The means and standard deviations of the values for maximum insertion torque, pullout strength, and stiffness were tabulated with mechanical tests ( Table III ). The maximum insertion torque was in this order: S1 >S3 >S4 >S2. Results from the linear regression analyses showed that the maximum insertion torque values of S1 ( P <0.0001) and S3 ( P = 0.0192) were significantly greater than for S2 and S4 ( Table IV ). The average maximum insertion torque of S1 was 4.59 Ncm greater than that of S3 ( P = 0.006). The R 2 of this model was 0.78. The correlation coefficient of the predicted average maximum insertion torque and the observed data was 0.88, which implied that the fit and the predictive ability of this model were good.
| Mini-implant type | Maximum insertion torque (Ncm) | Pullout strength (N) | Displacement before failure (mm) | Stiffness (N/mm) |
|---|---|---|---|---|
| S1 | 28.79 ± 2.59 | 113.90 ± 8.37 | 0.71 ± 0.09 | 283.26 ± 45.68 |
| S2 | 21.78 ± 1.83 | 96.63 ± 6.70 | 0.68 ± 0.04 | 255.81 ± 45.21 |
| S3 | 24.20 ± 1.11 | 81.44 ± 6.77 | 0.55 ± 0.11 | 277.86 ± 18.85 |
| S4 | 21.93 ± 0.49 | 102.90 ± 12.80 | 0.56 ± 0.09 | 329.31 ± 76.03 |


