Introduction
The objective of this study was to assess the effect of baseline physical activity level on orthodontic pain perception and analgesic consumption after orthodontic separator placement in adolescents.
Methods
One hundred fifty participants (mean age, 14.5 years; SD, 1.7 years; 73 girls, 77 boys) were included in this longitudinal study. The physical activity questionnaire was used to assess their baseline physical activity levels. Once participants completed the questionnaire, orthodontic separators were placed at the mesial and distal contact points of the maxillary and mandibular first molars. A 100-mm visual analog scale was used for pain assessment. Analgesic consumption was recorded as a binary response (yes/no). Both outcomes were assessed at 1 baseline time point and 7 follow-up time points (bedtime on days 1 to 7). A multilevel mixed-effect model analysis approach was used to analyze the longitudinal data.
Results
Of the 150 participants in the study, data from 137 were included in the analysis (mean age, 14.4 years; SD, 1.7 years; 65 girls, 72 boys). Compared with the low-activity group (84 participants; 61.3%), the high-activity group (53 participants; 38.7%) experienced significantly less pain (mean estimate, −8.958; P = 0.0114; 95% confidence interval, −15.868 to −2.049) and consumed fewer analgesics (odds ratio, 0.443; P <0.0318; 95% confidence interval, 0.199 to 0.786) during the study period.
Conclusions
Physical activity has a significant influence on orthodontic pain perception and analgesic consumption in adolescents undergoing orthodontic treatment. Further research is needed on this topic to elucidate the association between physical activity and orthodontic pain.
Highlights
- •
We evaluated baseline physical activity levels of adolescent orthodontic patients.
- •
We then assessed the effects of baseline physical activity levels on orthodontic pain perception and analgesic consumption.
- •
Those with high baseline physical activity reported less pain and took fewer analgesics.
- •
Pain perception differences between males and females might be due to the differences in the physical activity level.
It is widely accepted that a physically active lifestyle is important for a variety of health-related outcomes in all age groups, including children and adolescents, and therefore, all individuals should be encouraged to participate in enjoyable physical activities that are appropriate for their age. Apart from the overall general health benefits of physical activity (PA), evidence suggests that routine PA in the form of regular exercise can lower pain perception by inducing exercise-related physiologic hypoalgesia and have a positive impact on a person’s mental health. Evidence also suggests that PA can evoke an elevation in pain thresholds related to dental pain and therefore reduce analgesic consumption.
Adolescents are the largest age group seeking orthodontic treatment because occlusal condition is significantly related to the acceptability of their general physical appearance. However, pain and discomfort is a concern for many prospective adolescent orthodontic patients. The authors of a recent longitudinal cohort study discussed the possibility of PA influencing orthodontic pain perception. However, as they noted, there is no direct evidence at present regarding the effect of PA on orthodontic pain.
A well-designed questionnaire can correctly rank subjects in groups according to their PA levels; this qualitative information is important for the exploration of research questions. Among the various questionnaires available to assess PA, the Physical Activity Questionnaire (PAQ) developed by Kowalski et al to provide an estimate of PA levels in youths (ages, 8-20 years) is widely used and recommended by experts to assess PA. The meaningful interpretation of PA measurements typically requires dichotomization of the study population into low-activity and high-activity groups based on each subject’s overall PAQ score.
The objectives of this study were to assess the PA level in adolescents (12-18 years of age) with the PAQ and to evaluate its influence (low-activity vs high-activity groups) on orthodontic pain perception and analgesic consumption after separator placement. Based on the findings of recent studies, we included age and sex as a priori subgroup analyses to examine their effects on PA, pain perception, and analgesic consumption.
Material and methods
The sample size calculation was based on the power analysis undertaken for linear mixed effect models using RMASS2 software, as recommended for a longitudinal 2-group study design with a provision to account for attrition and various time-related polynomial contrasts. We obtained all required information for the power analysis, such as the polynomial function of time, variance-covariance matrix of random-effects estimates, and so on, from the authors of a recent longitudinal study. The previous study examined the trend in orthodontic pain over 1 week using a multilevel mixed-effects analysis approach and highlighted the quadratic trend of orthodontic pain.
The power analysis showed that 128 participants (64 in each group) were required to demonstrate a mean average difference of 10 mm (SD, 25 mm for each group; Cohen d effect size, 0.4) on a 100-mm visual analog scale (VAS) between 2 groups at a 2-sided significance level of 0.05 (type I error rate) and 90% power (type II error) using a study design with 7 repeated measurements and an attrition rate of 5% between follow-ups. The effect size and polynomial function (quadratic) were based on the findings of the previous study.
However, another recent study reported that only approximately one-third (33%) of adolescents engage in moderate to vigorous PA. Therefore, we expected unequal group sizes in our study. Accordingly, we re-estimated the sample size (assuming that 35% of the adolescents would engage in moderate to vigorous PA) based on the same parameters and design features but adjusting for the unequal group sizes at a ratio of 0.65/0.35. The results showed that 143 participants were required after adjusting for the unequal group sizes.
Sample size and power calculations based on generalized linear mixed models with correlated binary outcomes showed that our study design (143 participants with unequal group sizes; 7 repeated measurements with an attrition rate of 5% between follow-ups) would also allow us to detect a marginal coefficient difference of 0.75 (odds ratio exp 0.75 = 2.1; almost double the incidence) for analgesic consumption between the groups at a 2-sided significance level of 0.05 (type I error rate) and 90% power (type II error) assuming a random intercept variance of a unit and an autoregressive first-order correlation structure between repeated-measures outcomes with a moderate correlation coefficient of 0.5. Because no previous data were available for the power analysis, we used these model assumptions, as recommended.
The total number of participants in this study was 150 (mean age, 14.5 years; SD, 1.7 years; 73 girls, 77 boys). They were consecutive patients who visited the private office of the first author for orthodontic treatment and were enrolled in the study if all inclusion criteria were satisfied and informed consent was obtained. All participants included in this study were from an urban area, were the same ethnicity (Asian), and had comparable socioeconomic statuses. The total study duration involving data collection was 18 months (June 2013 to November 2014). The study protocol was approved (June 12, 2013) by the ethics committee of the Indian Medical Association, Jalandhar, Punjab, India.
The inclusion criteria were as follows: (1) 12- to 18-year-old patients of both sexes who required fixed orthodontic treatment, (2) erupted permanent first and second molars, (3) placement of elastomeric separators and banding of posterior teeth required as part of fixed orthodontic treatment, (4) presence of antagonist teeth in the opposite arch and absence of posterior open bite and interdental spaces, (5) no concurrent use of analgesics and anti-inflammatory drugs, (6) caries-free dentition with a healthy periodontium, and (7) voluntary participation in the study confirmed by signing the informed consent form. The following exclusion criteria were applied: (1) medical condition or systemic disease that precluded the use of fixed orthodontic appliances, (2) chronic pain or pain in the orofacial or dental region, and (3) informed consent was not obtained.
The PAQs for older children (ages 8-14 years) and adolescents (ages 14-18 years) were used to assess baseline PA. The PAQ is a self-administered, 7-day recall instrument used to assess PA in children attending school. The PAQ has reasonable recall of the past week’s activity level and is easy to complete in a short time (approximately 15-20 minutes). The PAQ has acceptable reliability, convergent validity, and construct validity as shown by its sensitivity to known sex and age differences in PA.
The PAQ was designed in Canada. Because of global cultural and climatic differences, some activities (eg, cross-country skiing and ice-skating) on the original activity checklist are unsuitable for use in many countries. Thus, similar to the adjustments made by authors of a recent study to adapt the PAQ activity checklist for their local use, we adjusted the Canadian activity checklist to obtain our own version of the PAQ based on the physical activities practiced in local schools.
The administration and scoring of the 2 versions of the PAQ are described elsewhere. In brief, the questionnaires comprise 8 and 9 items (the children’s PAQ includes an additional item about recess), respectively. The questionnaires collect information on participation in different activities or sports (activity checklist), effort during physical education class, and activity during lunch, after school, in the evening, and on the weekend during the past 7 days. Each item is scored from 1 (low PA) to 5 (high PA), and the average score denotes the overall PAQ score. Because recess is no longer part of a typical day at secondary schools (grade 7; approximate age, 11 years) and all participants in the study were over 12 years of age, the adolescents’ PAQ was used to assess PA for all participants.
Various cutoff points have been proposed to categorize youths according to their self-reported PA based on the PAQ score. For example, subjects can be grouped as “active” or “not active” based on the median split of the PAQ scores. However, a recent study provided a criterion-referenced PAQ-score cutoff point specific to the subjects’ age and sex. Based on the study sample of adolescent participants, the authors recommended PAQ scores of 2.9 and 2.7 as cutoff points for boys and girls, respectively. We used similar cutoff points in our study.
Once the participants completed the PAQ, orthodontic separators (AlastiK S2 posterior separator modules; 3M Unitek, Monrovia, Calif) were placed at the mesial and distal contact points of the maxillary and mandibular first molars. The time of separator placement was recorded. For all participants, separators were placed during the evening, between 6:00 and 7:30 pm , although on different days. The follow-up period was 7 days.
A diary was given to each patient for pain assessment and analgesic consumption. Pain was assessed on the 100-mm VAS. Participants were requested to make a line across the scale corresponding to perceived pain. The VAS is a valid and reliable scale for pain assessment. For pain relief, participants were allowed to take any over-the-counter analgesic of their choice. They were asked to report whether they consumed analgesics each day and record this as a binary response (yes or no) along with the pain assessment.
Pain perception and analgesic consumption were assessed 2 to 4 hours after separator placement (baseline pain) and at bedtime from days 1 to 7 (7 follow-up times). The participants were recalled after 7 days for the banding procedures. At this time, their pain diaries were collected.
A trained dental assistant who was blinded to the status of the study participants was responsible for the data entry of the PAQ, VAS scores, and analgesic consumption. The PAQ scoring of each item involved straightforward recording of each participant’s scores (1-5) by the participant to the respective item. Similarly, the analgesic consumption was the “yes or no” response for each day. The VAS score in millimeters was measured from the left margin of the line of the scale to the nearest millimeter using a metallic ruler to quantify the pain. To examine the reproducibility and reliability, 40 randomly selected VAS scales were measured independently by the first author. The intraclass correlation coefficient of 0.91 showed excellent reproducibility and reliability.
Statistical analysis
Statistics based on demographic and clinical data such as frequency or percentage, arithmetic mean, and standard deviation were calculated using basic descriptive statistical methods. Between-group differences were assessed via chi-square tests for categorical measures and independent t tests for continuous variables.
The GLIMMIX procedure in SAS software (version 9.3; SAS Institute, Cary, NC) was used to analyze the longitudinal data with the multilevel mixed-effects model-analysis approach. Time was coded linearly with the intercept representing day 1. A 2-tailed significance level of 0.05 was used for hypothesis testing.
A linear mixed-effects model was used to analyze the pain data. Preliminary exploratory and graphic analyses showed that the pain trend was nonlinear and followed a quadratic pattern. Therefore, a quadratic random coefficient model was fit using the unstructured variance-covariance matrix, the maximum likelihood method of estimation, and the Kenward-Roger degrees of freedom approximation, which is strongly recommended for longitudinal studies in which group sizes are unequal. The fit of the quadratic model was evaluated as described by Littell et al to determine whether the quadratic polynomial time function was adequate to describe the observed nonlinear trend of pain. The log likelihood ratio test, Akaike information criteria, and Bayesian information criteria were used to assess the model fit during the model-building process.
A detailed examination of both level 1 and level 2 residuals was undertaken to check the model assumptions such as normality, linearity, and homogeneity of variance and to examine the autocorrelation of the residuals. Both the level 1 and level 2 residuals showed heteroscedasticity, which was compensated by including the separate intercept and linear and quadratic slopes for each group. The level 1 residual autocorrelation was handled using the autoregressive first-order correlation matrix structure. This was the best model as shown by the fit statistics and the comparisons of observed and model-predicted estimates.
Baseline pain was used as a covariate, which allows each subject to be his or her own control to assess the effect of other covariates of interest (predictors) over time. The predictors included in the analysis were age, sex, and the age-sex interaction effect. Baseline pain and age were used as standardized covariates (mean, 0; SD, 1), whereas PA group and sex were included as binary coded variables.
A generalized linear mixed-effects logistic regression model was used to analyze the longitudinal binary data using binomial distribution, the logit link function, and the marginal maximum pseudo-likelihood estimation technique. The marginal estimation method involves Taylor series expansions (linearization) of the random effects based on the marginal (mean), so the regression coefficients are interpreted in terms of marginal and population average effects. The model fit was evaluated by the pseudo-likelihood and generalized chi-square fit statistics and comparisons of the observed and predicted probabilities.
In the mixed-effects logistic regression analysis, random intercept and autoregressive first order structure were used to model the between-subject and within-subject (residual) variance-covariance structures, respectively. To account for heteroscedasticity, variance-covariance structures were modeled separately for the PA groups. The inclusion of the residual covariance structure accounts for the overdispersion as was observed in our data, where the outcome included excessive zeros, especially toward the end of the follow-up period. The comparison of the observed data and model-predicted probability showed a good model fit.
The covariates included in the binary data analysis were the same as those used for the VAS data analysis except for baseline pain. Because we had the baseline data for analgesic consumption, baseline analgesic consumption (binary covariate with yes/no response) was included as a baseline covariate.
Results
Of the 150 participants enrolled in this study, 3 requested removal of separators after 1 day because of excessive pain, and 2 others did not return for the scheduled appointment 7 days after separator placement. Of the remaining 145 participants, 8 did not return the pain diary and were therefore excluded from the data analysis. Therefore, data from 137 participants were included in the analysis (12-18 years old; mean age, 14.4 years; SD, 1.7 years; 65 girls, 72 boys).
Although the data included in the analysis for some subjects was missing for a few follow-up time points, multilevel models can handle the missing data well using the missing-at-random assumption, especially with the maximum likelihood method of estimation.
The mean overall scores across all 8 items of the PAQ were 2.95 (SD, 0.52) for boys and 2.33 (SD, 0.90) for girls. We categorized the subjects into “low” and “high” PA groups using predefined reference-based cutoff points for overall PAQ scores, as described previously. Eighty-four participants (61.3%) were identified as “low activity” and 53 participants (38.7%) as “high activity.” Pearson chi-square tests showed that the differences in the number of male and female participants in the low PA group (37 boys, 44%; 47 girls, 56%) and the high PA group (35 boys, 66%; 18 girls, 34%) were statistically significant. (χ 2 = 6.302; P = 0.0121). The t test showed a statistically significant difference in the mean ages between the low PA (mean, 14.69; SD, 1.68) and high PA (mean, 13.96; SD, 1.61) groups.
To further examine the adjusted effect of age and sex on PA, a 2-way factorial analysis of variance was run on the overall PAQ scores. In addition to significant main effects of sex ( F [1, 125] = 18.98; P <0.0001) and age ( F [5, 125] = 2.29; P = 0.0496), there was a significant positive interaction between the effects of sex and age on the overall PAQ score: F (5, 125) = 3.14; P = 0.0105; this implies that the effect of sex on the overall PAQ score was not the same across the age groups, and it increased with age. In other words, girls reported significantly less PA in the older age group (beyond the mean age of 14.4 years).
The results of the quadratic random coefficient analysis are shown in Table I . The pain decreased significantly from day 1 onward (linear estimate, −8.83; P <0.0001); however, the rate of decline decelerated with time (quadratic estimate, 0.49; P = 0.0023), indicating a nonlinear pain trend. The analysis undertaken to evaluate the quadratic model fit as proposed by Littell et al showed that the model fit the data well ( P = 0.7744).
| Effect | Estimate | SE | Degree of freedom ∗ | t value | P | 95% CI | |
|---|---|---|---|---|---|---|---|
| Lower | Upper | ||||||
| Intercept | 45.1165 | 3.917 | 112.1 | 11.52 | <0.0001 | 37.3555 | 52.8775 |
| Time (linear) | −8.8333 | 0.8844 | 182.4 | −9.99 | <0.0001 | −10.5783 | −7.0883 |
| Time (quadratic) | 0.4942 | 0.1589 | 118.8 | 3.11 | 0.0023 | 0.1795 | 0.8089 |
| Physical activity | |||||||
| High activity | −13.6433 | 4.7089 | 130 | −2.9 | 0.0044 | −22.9593 | −4.3273 |
| Low activity | Referent | ||||||
| Time (linear) × high activity | 2.1547 | 1.0058 | 172.2 | 2.14 | 0.0336 | 0.1693 | 4.14 |
| Time (linear) × low activity | Referent | ||||||
| Time (quadratic) × high activity | −0.1369 | 0.1851 | 137.9 | −0.74 | 0.4608 | −0.5029 | 0.2291 |
| Time (quadratic) × low activity | Referent | ||||||
| Sex | |||||||
| Female | 7.2937 | 4.5298 | 137.4 | 1.61 | 0.1097 | −1.6635 | 16.2508 |
| Male | Referent | ||||||
| Time (linear) × female | −0.6588 | 0.966 | 158.6 | −0.68 | 0.4963 | −2.5667 | 1.2491 |
| Time (linear) × male | Referent | ||||||
| Time (quadratic) × female | 0.1627 | 0.1795 | 136.9 | 0.91 | 0.3662 | −0.1922 | 0.5176 |
| Time (quadratic) × male | Referent | ||||||
| Age (standardized) | |||||||
| Age | 0.3323 | 2.9883 | 129.7 | 0.11 | 0.9116 | −5.5799 | 6.2444 |
| Time (linear) × age | −0.7658 | 0.6215 | 124.1 | −1.23 | 0.2202 | −1.9959 | 0.4643 |
| Time (quadratic) × age | 0.1107 | 0.1171 | 122 | 0.95 | 0.3463 | −0.1211 | 0.3424 |
| Age-sex interaction | |||||||
| Age × female | 9.4725 | 4.345 | 137.2 | 2.18 | 0.031 | 0.8808 | 18.0643 |
| Age × male | Referent | ||||||
| Time (linear) × age × female | 1.982 | 0.9287 | 160.2 | 2.13 | 0.0343 | 0.1481 | 3.816 |
| Time (linear) × age × male | Referent | ||||||
| Time (quadratic) × age × female | −0.2445 | 0.1724 | 137.2 | −1.42 | 0.1585 | −0.5854 | 0.09645 |
| Time (quadratic) × age × male | Referent | ||||||
| Baseline pain (standardized) | |||||||
| Baseline pain | 5.3063 | 2.2529 | 134.6 | 2.36 | 0.02 | 0.8507 | 9.762 |
| Time (linear) × baseline pain | −1.1248 | 0.4742 | 137.7 | −2.37 | 0.0191 | −2.0624 | −0.1873 |
| Time (quadratic) × baseline pain | 0.04171 | 0.08884 | 129.9 | 0.47 | 0.6395 | −0.1341 | 0.2175 |
∗ Kenward-Roger degree of freedom method was used; it adjusts for unequal group sizes involving repeated-measures data.
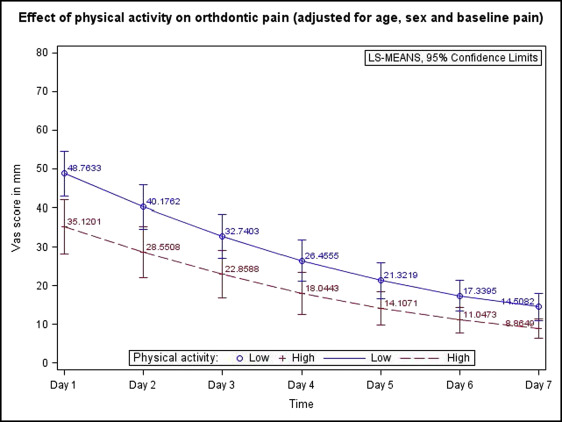
Compared with the low PA group, the high PA group experienced significantly less pain at day 1 (estimate, −13.64; P = 0.0044; 95% confidence interval [CI], −22.95 to −4.32), and the difference was also significant for the linear slope (linear estimate difference, 2.15; P = 0.0336; 95% CI, 0.16 to 4.14). The age-sex interaction effect showed that girls experienced significantly greater pain with each standard deviation beyond the mean age (14.4 years).
The adjusted least square means differences between the high PA and low PA groups for each follow-up time point are shown in Figure 1 and Table II . The overall mean average pain difference between the high PA and low PA groups was significant (estimate, −8.95; P = 0.0114; 95% CI, −15.86 to −2.04), indicating that the low PA group experienced greater pain across the entire study period.
| Time | Estimate | SE | Degree of freedom ∗ | t value | P | 95% CI | |
|---|---|---|---|---|---|---|---|
| Lower | Upper | ||||||
| Day 1 | −13.6433 | 4.7089 | 130 | −2.9 | 0.0044 | −22.9593 | −4.3273 |
| Day 2 | −11.6255 | 4.5894 | 132.1 | −2.53 | 0.0125 | −20.7036 | −2.5473 |
| Day 3 | −9.8815 | 4.3735 | 133.3 | −2.26 | 0.0255 | −18.5318 | −1.2311 |
| Day 4 | −8.4112 | 3.981 | 134.5 | −2.11 | 0.0365 | −16.2847 | −0.5378 |
| Day 5 | −7.2148 | 3.3953 | 135.7 | −2.12 | 0.0354 | −13.9293 | −0.5003 |
| Day 6 | −6.2921 | 2.7 | 134.4 | −2.33 | 0.0213 | −11.6322 | −0.9521 |
| Day 7 | −5.6433 | 2.2542 | 130.6 | −2.5 | 0.0135 | −10.1029 | −1.1837 |
| Overall | −8.9588 | 3.4942 | 136.5 | −2.56 | 0.0114 | −15.8686 | −2.049 |
Stay updated, free dental videos. Join our Telegram channel
VIDEdental - Online dental courses


