Introduction
The purpose of this study was to compare the soft-tissue profiles of matched Class I adolescent European Americans and Mexican Americans. The secondary aim was to explain profile differences based on group differences in soft-tissue thickness, skeletal morphology, dental position, and tooth size.
Methods
The study pertained to 207 untreated Class I adolescents, including 93 Mexican Americans and 114 European Americans. Lateral cephalometric and model analyses were performed to quantify morphologic differences. Two-way analyses of variance were used to evaluate ethnicity, sex, and their interaction.
Results
Mexican Americans had significantly ( P <0.05) greater lip protrusion and facial convexity than did European Americans. Mexican Americans had smaller craniofacial dimensions and larger teeth, resulting in maxillary and mandibular dentoalveolar protrusion. Mexican Americans also had thicker soft tissues and greater maxillary skeletal prognathism than European Americans. The combination of thicker soft tissues, maxillary skeletal prognathism, and dentoalveolar protrusion explained the protrusive lips of Mexican Americans. The greater facial convexity of Mexican Americans was due primarily to maxillary prognathism and mandibular hyperdivergence. Sex differences pertained primarily to size; the linear dimensions of the boys were consistently and significantly larger than those of the girls.
Conclusions
European American normative data and treatment objectives do not apply to Mexican Americans. Knowledge of the soft-tissue, skeletal morphology, and dental position differences should be applied when planning treatment for Mexican American patients.
Development of an individualized treatment plan is paramount for successfully achieving optimal esthetics, function, periodontal health, and stability. Because of the potentially detrimental effects of orthodontic treatment, the soft-tissue profile has become an increasingly important determinant of the final treatment plan. However, orthodontists, general dentists, and laypeople have differing opinions concerning profile preferences, depending on their level of education, ethnicity, treated status, and sex. The age, sex, and ethnicity of the subjects being judged have also been shown to affect esthetic preferences.
The soft-tissue profile depends on various morphologic factors. The horizontal positions of the hard tissues are among the most important determinants of horizontal soft-tissue positions. For example, extraction studies have consistently shown that lip position and the nasiolabial angle depend on the anteroposterior positions of the incisors. Soft tissues thickness also affects lip and chin positions. Orthodontic treatment can affect the interrelationships among the soft-tissue, skeletal, and dental components.
Although ethnic group differences have been well established for soft-tissue profile, soft-tissue thickness, skeletal morphology, dental position and inclination, and tooth size, comparative data for Mexican Americans are lacking. Such comparisons are important because subjects of Mexican descent comprise a large percentage of the population in the United States, and they are increasing more rapidly than any other ethnic group. Mexicans and Mexican Americans have been shown to be more protrusive, both skeletally and dentally, than European Americans. Impor-tantly, most studies comparing European Americans and Mexican Americans have focused on 1 or 2 morphologic components. Thus, they were unable to determine the basis of the differences in the profiles. For example, the lack of studies evaluating differences between Mexican Americans and European Americans in both soft-tissue profile and soft-tissue thickness makes it impossible to know whether these are related.
Because of the limited and inconsistent data pertaining to adolescent Mexican Americans, the primary aim of this study was to compare the soft-tissue profiles of matched Class I European Americans and Mexican Americans. To determine the basis of the group differences, the secondary aim was to evaluate differences in soft-tissue thickness, skeletal morphology, dental position, and tooth size between European Americans and Mexican Americans. This is the first comprehensive study on this topic.
Material and methods
This study pertains to untreated adolescents with Class I malocclusion. The Mexican American sample was collected from a private practice in Houston, Texas. A total of 1285 consecutive untreated patients were evaluated by the primary author (E.V.) to identify the Mexican American sample based on their surnames and frontal photographs exhibiting mestizo features. The photographs were used to verify that they had brown skin, dark brown eyes, and black hair. A total of 2710 consecutive untreated subjects were evaluated from a private practice in Arlington, Texas, to identify the European American sample.
To control for extraneous variations, the subjects had to have Class I molar relationships, lateral cephalograms of sufficient quality to unambiguously identify all landmarks, study models without worn or broken teeth, extraoral color photographs, intraoral color photographs, permanent dentitions, and known surnames. The Class I molar relationship was clinically confirmed by using intraoral photographs and study models; the mesiobuccal cusp of the maxillary first molars had to be within 1 mm of the buccal groove of the mandibular first molars. To control for maturational differences, boys had to be between 12.5 and 15.5 years of age; girls had to be between 11.5 and 13.5 years of age. These ages were chosen to adjust for sex differences in the timing of peak adolescent growth velocity, which occurs approximately 1.9 years later in boys than in girls. Subjects were excluded if they had congenital deformities or defects, a history of early treatment, impacted teeth (other than thirrd molars), or anterior crossbites.
The final sample included the pretreatment records of 207 adolescents: 114 European Americans and 93 Mexican Americans ( Table I ). The European American sample included 53 boys and 61 girls, with mean ages of 13.9 and 12.6 years, respectively. The Mexican American sample included 44 boys and 49 girls, with mean ages of 13.8 and 12.5 years, respectively ( Table I ).
| Boys | Girls | Total (n) | Mean age (y) | |||
|---|---|---|---|---|---|---|
| Mean age (y) | n | Mean age (y) | n | |||
| European Americans | 13.9 | 53 | 12.6 | 61 | 114 | 13.3 |
| Mexican Americans | 13.8 | 44 | 12.5 | 49 | 93 | 13.2 |
| Mean age | 13.9 | 12.6 | ||||
| Total | 97 | 110 | ||||
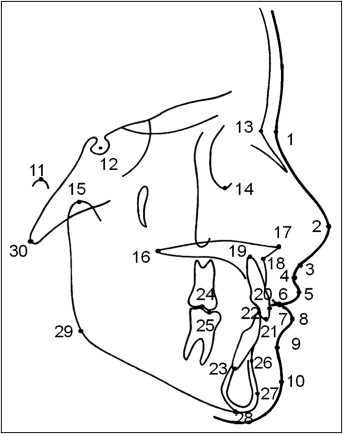
Because the lateral cephalograms were taken on 2 different cephalostats, all size measurements were adjusted based on the subject-to-film distances to eliminate magnification differences. A custom analysis was created by using Dolphin Imaging Premium Software (version 11.0; Dolphin Imaging Systems, Chatsworth, Calif). Thirty landmarks ( Fig 1 ) were digitized according to the hard-tissue and soft-tissue definitions of Riolo et al and Molsted et al. Landmarks were used to create 19 soft-tissue measurements, 25 skeletal measurements, and 9 dental measurements. All landmarks were digitized by 1 investigator (E.V.).
To measure the mesiodistal diameters of the 6 anterior teeth (central and lateral incisors, and canines) on both the maxillary and mandibular casts, a total of 24 mesial and distal contact points (2 points per tooth for each arch) were identified. The contact points were defined as the greatest distance between approximate surfaces, as observed when teeth were rotated or poorly aligned. The casts were measured by using digital calipers accurate to the nearest 0.01 mm. Anterior arch perimeters were measured with the continuous brass-wire technique. The brass wire was contoured over the dentition to estimate where the contacts of the teeth would be in ideal alignment and upright over basal bone, and the distance between the mesial aspect of the first premolar on 1 side to the mesial aspect of the first premolar on the other side was measured with digital calipers accurate to the nearest 0.01 mm. All model analysis measurements were made by 1 investigator (E.V.).
Intraexaminer measurement reliabilities were based on replicate analyses performed on 32 lateral cephalograms and 25 sets of models, measured at 2 times. Random method errors (√[∑d 2 /2n]) for the linear and angular cephalometric measurements averaged 0.65 mm and 1.3°, respectively. Method errors for dental cast measurements averaged 0.15 mm.
Statistical analysis
Skewness and kurtosis statistics showed that the variables were normally distributed. Two-way analysis of variance (ANOVA) was used to simultaneously evaluate ethnicity (European American vs Mexican American), sex (male vs female), and their interactions. No statistically significant interactions were found between ethnicity and sex. All analyses were performed by using SPSS software (version 15; SPSS, Chicago, Ill), with a significance level of 0.05 for the statistical comparisons.
Results
There were statistically significant ( P <0.05) differences between the European Americans and Mexican Americans for all soft-tissue profile variables ( Table II ). Mexican Americans had significantly more protrusive upper (2.0-3.0 mm) and lower (0.6-2.4 mm) lips than did European Americans, with differences depending on the reference plane used. Mexican Americans were also more convex, with larger H-angles and larger soft-tissue facial angles than European Americans. Soft tissues were consistently thicker in Mexican Americans, with significant differences at the vermilion border, B-point, and soft-tissue pogonion.
| Soft-tissue measurement | Unit | European Americans | Mexican Americans | P | ||
|---|---|---|---|---|---|---|
| Mean | SD | Mean | SD | |||
| Profile | ||||||
| Ls ⊥ P-Pg′ | mm | −3.29 | 2.19 | −0.53 | 1.97 | <0.001 |
| Ls ⊥ S line | mm | −0.54 | 1.87 | 1.90 | 1.70 | <0.001 |
| Ls ⊥ Sn-Pg′ | mm | 2.96 | 1.57 | 4.98 | 1.51 | <0.001 |
| Ls ⊥ N′-Pg′ | mm | 8.75 | 2.58 | 11.71 | 2.22 | <0.001 |
| Sn ⊥ Ls-Pg′ | mm | 4.19 | 2.21 | 6.96 | 2.12 | <0.001 |
| SLS⊥ Sn-LS | mm | 3.15 | 1.24 | 4.34 | 1.72 | <0.001 |
| Li ⊥ P-Pg′ | mm | −2.04 | 2.41 | 0.35 | 2.36 | <0.001 |
| Li ⊥ Ls-Pg′ | mm | 0.13 | 1.39 | 0.70 | 1.59 | 0.007 |
| Li ⊥ S line | mm | −0.25 | 2.17 | 1.87 | 2.17 | <0.001 |
| Li ⊥ Sn-Pg′ | mm | 2.03 | 1.90 | 3.78 | 1.99 | <0.001 |
| Li ⊥ N′-Pg′ | mm | 5.75 | 2.47 | 7.90 | 2.23 | <0.001 |
| Convexity | ||||||
| N′-Pg′-Ls | ° | 14.03 | 3.98 | 18.89 | 3.64 | <0.001 |
| (Po-Or)-(N′-Pg′) | ° | 91.31 | 2.80 | 92.28 | 3.30 | 0.026 |
| Soft-tissue thickness | ||||||
| A-SLS | mm | 13.95 | 1.53 | 14.23 | 1.68 | 0.191 |
| Ls-U1 labial | mm | 13.24 | 2.19 | 13.87 | 2.19 | 0.040 |
| Ls-U1 tip | mm | 16.78 | 2.62 | 16.62 | 2.36 | 0.533 |
| Li-U1 tip | mm | 11.52 | 1.80 | 11.83 | 1.91 | 0.227 |
| B-ILS | mm | 11.56 | 1.66 | 12.31 | 2.16 | 0.006 |
| Pg-Pg′ | mm | 12.72 | 2.36 | 14.48 | 2.75 | <0.001 |
European Americans and Mexican Americans also differed significantly ( P <0.05) in their skeletal dimensions ( Table III ). All 4 measures of anteroposterior maxillary position showed greater protrusion among Mexican Americans; SNA was 2.4° larger, A-point was 1.8 mm farther in front of nasion perpendicular, maxillary depth was 1.9° greater, and ANS was located 1.8 mm farther ahead of nasion. In contrast, the anteroposterior positions of the mandible of Mexican Americans and European Americans did not differ significantly. Only pogonion to nasion-basion (NB) showed a significant group difference, with chin protrusion 1.4 mm greater among European Americans. Mexican Americans had significantly larger ANB angles, greater convexity, and smaller maxillomandibular differential than European Americans. The Mexican Americans were also more hyperdivergent than were the European Americans, with mandibular plane angles 1.6° to 2° greater. Except for lower anterior face height, European Americans were significantly larger for all size and length measurements than Mexican-Americans, with differences between 2.5% and 4.2% for all measurements except for the sella-nasion line, which differed by 8.6%.
| Skeletal measurement | Unit | European Americans | Mexican Americans | P | ||
|---|---|---|---|---|---|---|
| Mean | SD | Mean | SD | |||
| Maxilla | ||||||
| SNA | ° | 81.55 | 3.25 | 83.97 | 3.65 | <0.001 |
| (Po-Or)-(N-A) | ° | 90.39 | 2.89 | 92.31 | 3.56 | <0.001 |
| A ⊥ (N⊥[Po-Or]) | mm | 0.42 | 3.00 | 2.26 | 3.44 | <0.001 |
| ANS ⊥ (N⊥[Po-Or]) | mm | 4.77 | 2.98 | 6.52 | 3.21 | <0.001 |
| Mandible | ||||||
| SNB | ° | 78.52 | 3.47 | 79.36 | 3.22 | 0.067 |
| Pg ⊥ (N⊥[Po-Or]) | mm | −3.12 | 5.22 | −3.79 | 5.65 | 0.370 |
| Pg ⊥ (N-B) | mm | 1.88 | 1.69 | 0.45 | 1.34 | <0.001 |
| (S-N)-(N-Pg) | ° | 79.53 | 3.55 | 79.60 | 3.37 | 0.846 |
| Maxillomandibular relationships | ||||||
| ANB | ° | 3.06 | 2.05 | 4.62 | 2.12 | <0.001 |
| Wits | mm | −0.44 | 2.32 | 0.13 | 2.72 | 0.121 |
| N-A-Pg | ° | 4.56 | 5.61 | 9.41 | 5.23 | <0.001 |
| A ⊥ (N-Pg) | mm | 2.13 | 2.63 | 4.28 | 2.38 | <0.001 |
| (Co-Pg)-(Co-ANS) | mm | 21.01 | 4.11 | 19.90 | 4.33 | 0.045 |
| Ba-S-N | ° | 131.33 | 4.73 | 133.77 | 5.11 | <0.001 |
| (Po-Or)-(Go-Me) | ° | 24.56 | 4.44 | 26.55 | 4.22 | 0.002 |
| (S-N)-(Go-Me) | ° | 33.39 | 4.97 | 34.92 | 5.11 | 0.039 |
| Sizes/lengths | ||||||
| N-Me | mm | 113.23 | 7.75 | 110.44 | 6.00 | <0.001 |
| N-ANS | mm | 53.26 | 3.69 | 51.29 | 3.20 | <0.001 |
| ANS-Me | mm | 62.38 | 5.49 | 62.49 | 4.34 | 0.976 |
| S-N | mm | 70.02 | 3.54 | 64.45 | 3.19 | <0.001 |
| ANS-PNS | mm | 52.27 | 3.30 | 50.29 | 2.79 | <0.001 |
| Co-A | mm | 87.00 | 4.50 | 84.72 | 5.21 | <0.001 |
| Co-Pg | mm | 110.39 | 6.28 | 106.96 | 6.33 | <0.001 |
| Go-Pg | mm | 72.10 | 4.56 | 69.21 | 4.54 | <0.001 |
| S-Go | mm | 75.24 | 5.84 | 73.39 | 6.15 | 0.007 |
The maxillary incisors of Mexican Americans were significantly more protrusive and proclined ( Table IV ), with differences ranging from 2.3° to 3.2° and 2 to 3 mm. The mandibular incisors were also significantly more protrusive and proclined among Mexican Americans than European Americans; IMPA was 4.1° greater, FMIA was 6.0° greater, mandibular incisor to the A-pogonion reference plane was 1.9 mm greater, and mandibular incisor to NB was 2.3 mm greater. The interincisal angle was 8.7° smaller in the Mexican Americans than in the European Americans.
| Dental measurement | Unit | European Americans | Mexican Americans | P | ||
|---|---|---|---|---|---|---|
| Mean | SD | Mean | SD | |||
| Maxilla | ||||||
| (S-N)-(U1 tip -U1 root ) | ° | 102.27 | 6.56 | 105.50 | 6.61 | 0.001 |
| (Po-Or)-(U1 tip -U1 root ) | ° | 111.09 | 6.00 | 113.83 | 6.50 | 0.002 |
| U1 tip ⊥ (N-A) | mm | 2.97 | 2.20 | 3.51 | 2.19 | 0.080 |
| U1 tip ⊥ (A-Pg) | mm | 4.68 | 2.00 | 6.94 | 1.98 | <0.001 |
| Mandible | ||||||
| (Go-Me)-(L1 tip -L1 root ) | ° | 90.63 | 6.70 | 94.72 | 6.41 | <0.001 |
| Po-Or-(L1 tip -L1 root ) | ° | 64.77 | 6.49 | 58.81 | 6.18 | <0.001 |
| L1 tip ⊥ (A-Pg) | mm | 1.22 | 1.67 | 3.15 | 1.97 | <0.001 |
| L1 tip ⊥ (N-B) | mm | 3.93 | 1.88 | 6.21 | 2.04 | <0.001 |
| Maxillomandibular relationship | ||||||
| (U1 tip -U1 root )-(U1 tip -U1 root ) | ° | 133.68 | 8.18 | 124.97 | 9.37 | <0.001 |
Tooth sizes and arch lengths were consistently larger in Mexican Americans than in European Americans ( Table V ). The teeth of Mexican Americans were 4.2% to 6.4% larger; the maxillary central incisors (2.6%-3.1%) had the smallest difference, and the maxillary lateral incisors (8.8%-9.3%) had the largest ethnic differences.
| Measurement | Unit | European Americans | Mexican Americans | P | ||
|---|---|---|---|---|---|---|
| Mean | SD | Mean | SD | |||
| UR canine | mm | 7.96 | 0.47 | 8.35 | 0.54 | <0.001 |
| UR lateral incisor | mm | 6.70 | 0.59 | 7.32 | 0.51 | <0.001 |
| UR central incisor | mm | 8.64 | 0.48 | 8.91 | 0.49 | <0.001 |
| UL central incisor | mm | 8.64 | 0.51 | 8.86 | 0.49 | 0.002 |
| UL lateral incisor | mm | 6.62 | 0.60 | 7.20 | 0.53 | <0.001 |
| UL canine | mm | 7.87 | 0.49 | 8.25 | 0.46 | <0.001 |
| U ant perimeter | mm | 46.30 | 3.16 | 48.18 | 3.23 | <0.001 |
| LR canine | mm | 6.87 | 0.41 | 7.19 | 0.44 | <0.001 |
| LR lateral incisor | mm | 5.98 | 0.37 | 6.32 | 0.38 | <0.001 |
| LR central incisor | mm | 5.50 | 0.31 | 5.73 | 0.35 | <0.001 |
| LL central incisor | mm | 5.48 | 0.33 | 5.71 | 0.34 | <0.001 |
| LL lateral incisor | mm | 5.95 | 0.35 | 6.33 | 0.44 | <0.001 |
| LL canine | mm | 6.88 | 0.44 | 7.29 | 0.47 | <0.001 |
| L ant perimeter | mm | 35.07 | 2.57 | 36.53 | 2.74 | <0.001 |
| Bolton | % | 79.01 | 2.22 | 78.93 | 2.34 | 0.833 |
There were no statistically significant sex differences in soft-tissue profile or facial convexity. Boys had significantly thicker soft tissues than did girls, with differences ranging from 1.3 to 1.7 mm for the upper lip, and from 1.1 to 1.4 mm for the lower lip ( Table VI ).


