Introduction
A wide variety of factors affect the success of orthodontic miniscrews in clinical situations, including thickness of the soft tissues. Our objectives were to assess area-related and sex-related differences in the soft tissue thicknesses of the buccal attached gingiva of the maxilla and the mandible, and the palatal masticatory mucosa at common orthodontic miniscrew placement sites, and to prescribe a guideline for miniscrew selection for a predictable clinical outcome.
Methods
The sample consisted of 32 randomly selected adults in the age group of 20 to 25 years. Soft-tissue thickness of the concerned areas was measured intraorally using an A-mode ultrasound transducer probe (Biomedix Optotechnik & Devices, Bangalore, India). Independent t tests, paired t tests, and 1-way analysis of variance with Duncan post hoc tests were used for statistical analysis.
Results
The palatal masticatory mucosa was 2 to 3 times thicker than the corresponding buccal attached gingiva in both sexes. The thickness of the palatal masticatory mucosa in the midpalatal region was consistently less than 1 mm (range, 0.7-1 mm). The buccal attached gingiva was comparatively thicker in the maxilla than in the mandible, except for the mandibular molar regions. It also was found that the buccal attached gingiva was thicker in women in the maxillary anterior regions, whereas, the thickness was greater in the maxillary posterior regions in the men.
Conclusions
Evaluating the soft tissue thicknesses before selecting an orthodontic miniscrew can help in providing a definite guide for orthodontists to select an appropriate screw in everyday clinical practice, further enhancing the predictability of miniscrew-assisted orthodontics.
Highlights
- •
Soft-tissue thickness varies in buccal and labial areas, especially in the maxillary palatal area.
- •
Palatal masticatory mucosa is thicker than corresponding buccal attached gingiva.
- •
Buccal attached gingiva is thicker in the maxilla than in the mandible except near molars.
- •
In the maxillary anterior region, buccal attached gingiva is thicker in women.
- •
In the maxillary posterior region, buccal attached gingiva is thicker in men.
Loss of anchorage is a major orthodontic problem that often leads to compromised treatment results, not only in patients needing extractions but also in those requiring molar distalization or protraction. Conventional means of enhancing orthodontic anchorage are less than ideal because they rely on structures that are themselves potentially mobile (teeth), or they rely too heavily on patient compliance (wearing headgear or intraoral elastics). In all such situations where anchorage is critical, temporary skeletal anchorage devices have been demonstrated as a reliable solution. These miniature anchorage devices have opened a new era in clinical orthodontics by revolutionizing the way anchorage is controlled.
Various studies have documented the success rates of orthodontic miniscrews between 80% and 95%. Park et al reported a miniscrew failure rate of 8.4%, and Kuroda et al reported a failure rate less then 20%. However, for miniscrews placed in the palate, success rates of nearly 100% have been reported.
The stability and success of orthodontic miniscrews depend on a number of factors, including the site of screw implantation, the angulation of the miniscrew to bone, the quality and quantity of cortical bone, the insertion and removal torques, the degree of miniscrew to bone contact, the degree of inflammation of the peri-orthodontic miniscrew tissues, the thickness and mobility of the soft tissues, the patient’s craniofacial morphology, and the screw dimensions.
For the soft tissue component of stability, the risk of failure of orthodontic miniscrews surrounded by nonkeratinized mucosa is greater than for screws surrounded by keratinized mucosa. The palatal masticatory mucosa consists of keratinized tissues where orthodontic miniscrews can be reliably installed. However, the palatal masticatory mucosa is significantly thicker than the buccal attached gingiva, and different areas of the buccal attached gingiva have different soft-tissue thicknesses. As a result, if orthodontic miniscrews of the same length are installed in areas with different thicknesses of the soft tissues, the bone-to-screw contact and the retentive bone-to-screw surface area contact for primary retention of the screw would be different, and this can immensely affect the primary stability of the orthodontic miniscrews. Therefore, variations in the soft tissue measurements should also be considered before selecting a miniscrew, since it is a potential factor among the many factors affecting the success of orthodontic miniscrews.
The aims of this study were to evaluate the soft tissue thicknesses at potential orthodontic miniscrew installation sites and to provide a useful guideline for clinicians for miniscrew selection for enhanced predictability of miniscrew-assisted orthodontics.
Material and methods
Thirty-two subjects (15 men, 17 women; mean age, 21.7 years; range, 20-25 years) volunteered to participate in the study and gave informed consent. The study protocol was approved by the ethics committee of Sri Sai College of Dental Surgery under Dr. NTR University, Vijayawada, Andhra Pradesh, India.
All subjects selected for the study were healthy, with no history of orthodontic or prosthodontic treatment or tooth extractions (except for the third molars), with a skeletal Class I jaw base (ANB, 2°-5°) and an Angle Class I malocclusion with an average mandibular plane angle (GoGn-Sn, 32°-35°). All subjects were of Indian origin.
Subjects with gingival swelling, gingival recession, destructive periodontal disease, severe crowding, ectopically positioned teeth, missing teeth, any fixed or removable prosthesis, or extensive restorations, or taking medications that affect the periodontal tissues (eg, cyclosporine-A, calcium channel blockers, or phenytoin) were excluded from the study.
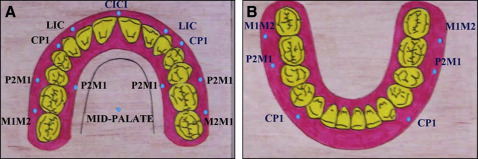
Soft-tissue thicknesses were measured in the interdental areas of buccal attached gingiva in the maxilla and the mandible between the permanent canine and the first premolar, between the second premolar and the permanent first molar, and between the permanent first and second molars. Thicknesses of the interdental buccal attached gingiva in the maxilla between the permanent central incisors, and between the permanent lateral incisor and canine were also measured.
The sites assessed in the palate were attached gingiva between the second premolar and the permanent first molar, and in the midpalatine raphae between the permanent first molars. The thickness of the soft tissue on the palatal side was measured 6 mm below the gingival crest, which is slightly apical to the trifurcation area of the permanent first molars, and is approximately parallel to their center of resistance, interdentally. A total of 12 sites in the maxillary arch and 6 in the mandibular arch were selected ( Fig 1 ).
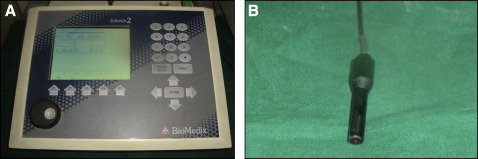
The ultrasound equipment consisted of an A-scan measuring 13.5 × 7-in for the digital display, a scan display, a transducer probe, a built-in printer, and a foot switch (model Echorule 2; Biomedix Optotechnik & Devices, Bangalore, India). The frequency was 10 MHz at 10% ( Fig 2 ).
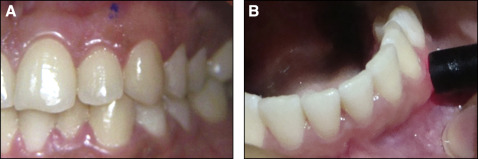
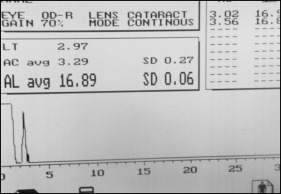
The ultrasonic measurements were made with the A-scan, which uses the pulse echo principle. The transducer probe was adapted perpendicular to the most gingival surface ( Fig 3 , B ). These areas were premarked with an indelible pencil for the desired placement of the probe ( Fig 3 , A ). The mechanism of action of the ultrasound, based on the transit time for the pulse (ultrasound wave) to travel to the bone (hard tissue) and echoed back, creates spikes on the monitor immediately ( Fig 4 ). Using the printout of this graph and with the help of the optical projector, the thicknesses of soft tissues were determined.
Accuracy and reliability of ultrasonic assessments of soft tissue thickness in different parts of the oral cavity may depend on placing the device precisely and repeatedly at the specified location. Consequently, areas that were difficult to access with the sensor, such as the retromolar pad and the maxillary tuberosity, were excluded in this study.
One investigator (R.P.), previously calibrated in the placement of the ultrasonography probe, did all the measurements, with minimal pressure on the soft tissues and in a wet environment ( Fig 3 , B ).The same investigator remeasured 5 randomly selected samples 10 days later to determine any measurement error. A paired t test showed no significant difference. Therefore, the first measurements were used for this study. There was no difference between the right and left sides in the paired t tests; hence, average values of the variables of both sides were used.
Statistical analysis
The sample size was determined using the results from a study by Cha et al. Group 1 was the men, and group 2 was the women. The means were 1.84 for group 1 and 1.48 for group 2. The mean difference was 0.36 (SD, 0.33). Type I error (α) was 0.05, the power of the test (1−β) was 0.80, and the confidence level was 0.95. The sample size required was 15 for each group. Independent t tests, paired t tests, and 1-way analysis of variance with the Duncan post hoc test were used for statistical analysis to determine area-related and sex-related differences.
Results
The thickness of the buccal attached gingiva in the maxilla showed no statistically significant difference between the left and right sides in the men ( Table I ). In the women also, the thickness of the buccal attached gingiva in the maxilla showed no statistically significant difference between the left and right sides ( Table I ). When we compared the thickness of the buccal attached gingiva in the male and female samples in the maxilla, the women had thicker attached gingiva between the canine and first premolar than the men. However, the men showed thicker buccal attached gingiva between the first and second molars; this was statistically significant ( Table I ). The differences in the thickness of the buccal attached gingiva in the maxilla between the central incisors were not statistically significant in the men and women.
| Variable | Male mean | Female mean | Male SD | Female SD | P value |
|---|---|---|---|---|---|
| Maxilla LIC | 1.91 | 1.93 | 0.18 | 0.23 | 0.723 |
| Maxilla CP1 | 1.43 | 1.74 | 0.11 | 0.21 | <0.001 |
| Maxilla P2M1 | 1.29 | 1.22 | 0.11 | 0.10 | 0.057 |
| Maxilla M1M2 | 1.46 | 1.34 | 0.15 | 0.12 | 0.021 |
| Maxilla palate P2M1 | 3.17 | 3.1 | 0.08 | 0.12 | 0.085 |
| Maxilla midpalate | 0.79 | 0.80 | 0.11 | 0.10 | 0.727 |
| Mandible CP1 | 1.18 | 1.04 | 0.09 | 0.08 | <0.001 |
| Mandible P2M1 | 1.14 | 1.14 | 0.15 | 0.17 | 0.983 |
| Mandible M1M2 | 1.50 | 1.62 | 0.18 | 0.20 | 0.08 |
The thickness of the buccal attached gingiva in the mandible showed no statistically significant difference between the left and right sides in the men ( Table I ). In the women also, the thickness of the buccal attached gingiva in the mandible showed no statistically significant difference between the left and right sides ( Table I ). When we compared the male and female groups, the thicknesses of the buccal attached gingiva in the mandible showed significant differences between the canines and first premolars, wherein the men showed thicker attached gingiva than the women. However, for all other areas in the mandible, the differences were not significant ( Table I ).
The thickness of the palatal masticatory mucosa showed no statistically significant difference between the left and right sides in the men ( Table I ). In the women also, the thickness of the palatal masticatory mucosa showed no statistically significant difference between the left and right sides ( Table I ). Between the sexes, the thickness of the palatal masticatory mucosa did not show any significant difference ( Table I ). The intergroup difference (ie, between the sexes) of the thickness of the midpalatal soft tissue was not significant ( Table I ).
There were other significant findings. In both the men and women, the thicknesses of the buccal attached gingiva were greater in the maxilla than in the mandible. In both groups, the palatal masticatory mucosa was nearly 2.5 to 3 times as thick as the buccal attached gingiva ( Table I ), and the buccal attached gingiva between the lateral incisor and the canine was thickest, followed by that between the first and second molars ( Table II ). Also, the buccal attached gingiva in the mandible was thickest between the first and second molars ( Table III ).
| Sex | Maxilla ∗ | Mean | SD | P value | Post hoc test |
|---|---|---|---|---|---|
| Male | CICI (1) | 1.33 | 0.10 | <0.001 | (3, 1) < 4 < 2 |
| LIC (2) | 1.91 | 0.18 | |||
| P2M1 (3) | 1.29 | 0.11 | |||
| M1M2 (4) | 1.46 | 0.15 | |||
| Female | CICI (1) | 1.41 | 0.16 | <0.001 | 3 < (4, 1) < 2 |
| LIC (2) | 1.93 | 0.23 | |||
| P2M1 (3) | 1.22 | 0.10 | |||
| M1M2 (4) | 1.34 | 0.12 |
| Sex | Mandible ∗ | Mean | SD | P value | Post hoc test |
|---|---|---|---|---|---|
| Male | CP1 (1) | 1.18 | 0.09 | <0.001 | (2, 1) < 3 |
| P2M1 (2) | 1.14 | 0.15 | |||
| M1M2 (3) | 1.50 | 0.18 | |||
| Female | CP1 (1) | 1.04 | 0.08 | <0.001 | (1, 2) <3 |
| P2M1 (2) | 1.14 | 0.17 | |||
| M1M2 (3) | 1.62 | 0.20 |
Stay updated, free dental videos. Join our Telegram channel
VIDEdental - Online dental courses


