Introduction
The aim of the study was to analyze the morphology of dental arches and skeletal mandibular-maxillary bases in untreated pseudo-Class III and true Class III malocclusions, by using posteroanterior radiographs and 3-dimensional digital models.
Methods
The records of 50 untreated patients (24 boys and 26 girls between 14 and 16 years of age) with Class III malocclusions were included in this study. They were divided into 2 groups according to their Class III malocclusion type: true or pseudo-Class III malocclusion. Maxillary skeletal base, and bigonial and biantegonial widths were measured on posteroanterior cephalograms. Also, maxillary and mandibular intermolar widths were calculated on 3-dimensional digital models. For the statistical evaluation, the independent-samples t test was used, and the Pearson correlation coefficient was calculated to determine the relationship between the dental and skeletal widths.
Results
Maxillary intermolar, and bigonial and biantegonial widths in true Class III malocclusions were significantly larger than those in pseudo-Class III malocclusions ( P <0.05). On the other hand, maxillary skeletal base width in pseudo-Class III malocclusions was significantly larger than in true Class III malocclusions ( P <0.05). Also, mandibular intermolar widths in true Class III malocclusions were larger than in pseudo-Class III malocclusions, but the difference was not significant ( P >0.05). Significant positive correlations were determined not only between the maxillary and mandibular molar widths but also between the bigonial and biantegonial widths ( P <0.01).
Conclusions
The morphologies of the dental arches and the skeletal mandibular-maxillary bases differ in a significant manner between untreated pseudo-Class III and true Class III malocclusions.
Highlights
- •
Morphology of dental arches differs between untreated pseudo-Class III and true Class III.
- •
Morphology of mandibular-maxillary bases differs between pseudo-Class III and true Class III.
- •
Transversal evaluation should be considered when planning treatment.
- •
True and pseudo-Class III differ in maxillary molar and biantegonial widths.
A Class III malocclusion is one of the most difficult malocclusions to treat, and its prevalences were reported as 16.8% in the Kenyan population and 1.4% in the Danish population. Data from the third National Health and Nutrition Examination Survey showed that only a fraction of a percentage of all adults have Class III malocclusions in the United States. Among 965 Turkish children, a 3.5% incidence of Class III malocclusion was found in the region of Konya. Gelgor et al reported that the prevalence of Class III malocclusion is 10.3% in the Turkish population.
Class III malocclusions may have an underlying skeletal or dental components. Skeletal Class III malocclusions are often seen with maxillary retrognathia, mandibular prognathia, or a combination of these conditions. Bell et al reported that there is some degree of maxillary deficiency in addition to the more obvious mandibular excess for most patients with skeletal Class III malocclusions. Tweed divided Class III malocclusions into 2 categories: category A for a pseudo-Class III malocclusion with a normal mandible and an underdeveloped maxilla, and category B for a skeletal (true) Class III malocclusion with a large mandible. True Class III malocclusions may develop as a result of an inherent growth abnormality, usually accompanied by a Class III dental malocclusion. Pseudo-Class III malocclusions are caused by premature occlusal contacts that lead to functional forward positioning or shifting of the mandible at centric occlusion. In patients with pseudo-Class III malocclusion, when the mandible is guided into a normal centric relationship, a normal overjet or an edge-to-edge position of the incisors can be obtained. Pseudo-Class III malocclusion is characterized by certain morphologic, dental, and skeletal characteristics: retrusive upper lip, decreased midface length, retroclined maxillary incisors, increased maxillomandibular difference, normal SNA, and slightly increased SNB because of the forward positioning of the mandible. Nakasima et al studied craniofacial morphology in different types of malocclusions and reported the following etiologic factors in pseudo-Class III malocclusion.
- 1.
Dental factors: ectopic eruption of the maxillary central incisors and premature loss of the deciduous molars.
- 2.
Functional factors: anomalies in tongue position, neuromuscular features, and nasorespiratory or airway problems.
- 3.
Skeletal factors: minor transverse maxillary discrepancy.
Diagnosis and treatment of Class III dentofacial disharmony poses a significant challenge to clinicians. Detailed and exhaustive dentofacial analysis should be performed to evaluate the anteroposterior disharmony and the transverse structure of the mandibular-maxillary base. The growth potential of a Class III patient may directly affect the treatment outcome; thus, it is important to determine, if possible, the patient’s growth potential to enhance success.
Plaster orthodontic models are important tools for diagnosis and treatment planning and for evaluating progress and outcomes of treatment. However, they have been criticized for the demand on storage space, the high risk of breakage, the loss of information, the labor-intensive work, and the difficulty of sending them to other clinicians in multidisciplinary cases. To overcome these problems, some alternatives to plaster models have been suggested.
Three-dimensional (3D) digital models now offer some advantages and have increased in popularity. Garino and Garino, Caspersen et al, and Zilberman et al compared linear dental anatomic measurements obtained from plaster and digital models. They found statistically significant differences between plaster and digital model linear measurements but concluded that the average difference was clinically insignificant.
In the literature, most studies have compared dental arch widths of Class II patients with those of normal occlusion samples. Only a few studies are available with respect to Class III malocclusions, represented 10.3% of patients in Turkey, and especially pseudo-Class III malocclusions. Therefore, the purpose of this study was to evaluate the skeletal and dental components in untreated Class III and pseudo-Class III malocclusions with posteroanterior (PA) cephalometric radiographs and digital models. The null hypothesis tested in this study was that dental arch widths and mandibular-maxillary base widths are not different between true and pseudo-Class III malocclusions.
Material and methods
A power analysis established by G*Power software (version 3.1.3; Franz Faul University, Kiel, Germany), based on an equal ratio among groups and a group size of 24 subjects, would give 85% power to detect significant differences with an 0.8 effect size and at the α = 0.05 significance level (critical t, 1.678660; noncentrality parameter, λ 2.771281). So, for the 2 groups, a total of 50 patients (24 boys, 26 girls) were included.
Fifty PA radiographs, lateral cephalograms, and 3D digital models were used, and sample selection was based on the initial dentoalveolar and skeletal characteristics. The selection criteria were the following: (1) normal SNA (82° ± 2°), increased SNB (>82°), and negative ANB (<0°) values ; (2) negative Wits value ; (3) family history of mandibular prognathism for true Class III malocclusions; (4) at least 2 incisors with negative overjet and overbite at habitual occlusion; (5) centric relation-centric occlusion discrepancy (forward displacement of the mandible to permit closure into a position in which the posterior teeth can comfortably occlude); (6) minimal or no crowding ; (7) all permanent teeth up to the first molars; (8) no supernumerary or congenitally missing teeth, excluding third molars, or teeth with extensive restorations or gross decay; (9) no ectopic teeth or anomalies in tooth shape; and (10) no previous orthodontic treatment.
Also, patients with nasal obstruction, tongue thrusting, or abnormal swallowing and sucking behaviors indicating narrow maxillary dental arch widths were excluded from this study.
All subjects had white ancestry. The assessments of the stages of cervical vertebral maturation on the lateral cephalograms for each subject were performed by 1 investigator (B.A.); the baseline assessments corresponded to stages V and VI. The mean age of the patients was 15.5 years. The mean values were 81.18° ± 1.28° for SNA angles and 84.39° ± 1.99° for SNB angles for the true Class III group.
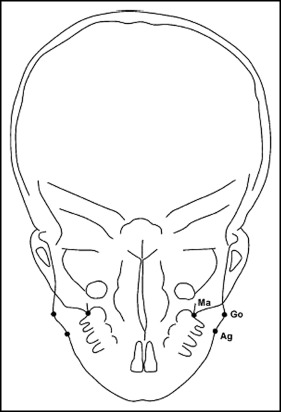
The skeletal landmarks used in this study were as follows ( Fig 1 ).
- 1.
Maxillary skeletal base width. This is the distance between the right and left maxillares. Maxillare is the intersection of the lateral contour of the maxillary alveolar process and the lower contour of the maxillozygomatic process of the maxilla.
- 2.
Bigonial width. This is the distance between both gonia. Gonion is the most inferior, posterior, and lateral point on the external angle of the mandible.
- 3.
Biantegonial width. This is the distance between both antegonia. Antegonion is the deepest point on the curvature at the antegonial notch.
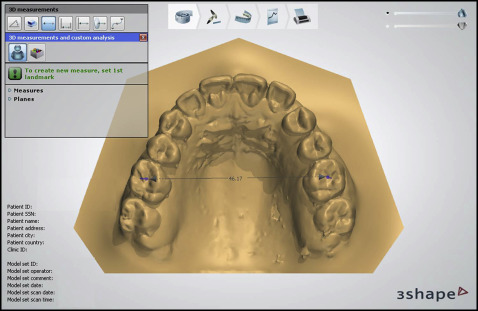
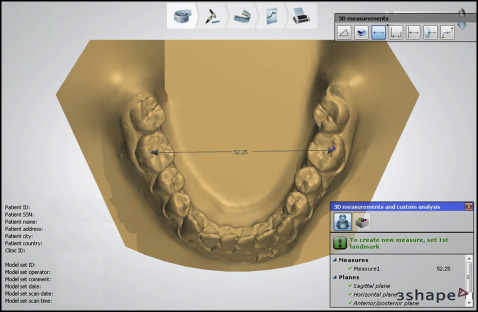
Digital models were generated from plaster models scanned with a 3D model laser scanner (D250 3D Dental Scanner; 3Shape A/S, Copenhagen, Denmark). The digital models were analyzed by 1 investigator (B.A.) using the 3Shape Orthoanalyzer software (version 1.0; 3Shape A/S). The dental landmarks used in this study were as follows ( Figs 2 and 3 ).
- 1.
Maxillary intermolar width. This is the distance between the central fossae of the maxillary right and left first molars.
- 2.
Mandibular intermolar width. This is the distance between the tips of the distobuccal cusps of the mandibular right and left first molars.
Ten randomly selected PA radiographs and 10 models were redigitized and remeasured by the same investigator (B.A.) 2 weeks after the first measurements to calculate the method error by means of Dahlberg’s formula. Intraexaminer reliability was quantified by using the intraclass correlation coefficient.
Statistical analysis
All data analyses were carried out using SigmaStat (version 3.5; Systat Software, San Jose, Calif) with a prespecified level of statistical significance of P <0.05. Normal distribution of the data was verified with the Kolmogorov-Smirnov test. The data were normally distributed, and there was homogeneity of variance among the groups. Thus, statistical evaluation was performed using parametric tests.
Unpaired and paired-sample t tests were used for sex and data comparisons, respectively. Because no sex differences were found in all measured parameters, the patients were pooled in each group. Pearson correlation coefficients were calculated to determine the associations among measurements between true and pseudo-Class III malocclusions.
Results
The method errors for the measurements on the dental casts were 0.17 mm for maxillary intermolar width, 0.25 mm for mandibular intermolar width, and 0.31 mm for molar difference. Measurement errors made on the radiographs were 0.40 mm for biantegonial width, 0.46 mm for maxillary skeletal base width, and 0.31 mm for bigonial width. A high degree of intraexaminer reliability was noticed for all variables. (intraclass correlation coefficient values, 0.936-0.982).
The sex distribution in the groups is shown in Table I . Table II summarizes the descriptive statistics and intragroup comparisons of sex differences in transverse skeletal and dental measurements, and no statistically significant differences were found in either group.
| Subjects | True Class III | Pseudo-Class III |
|---|---|---|
| Boys | 11 | 13 |
| Girls | 14 | 12 |
| Total | 25 | 25 |
| True Class III | Pseudo-Class III | |||||||||
|---|---|---|---|---|---|---|---|---|---|---|
| Male | Female | P | Male | Female | P | |||||
| Mean | SD | Mean | SD | Mean | SD | Mean | SD | |||
| RU6-LU6 | 48.29 | 3.23 | 45.62 | 3.23 | 0.05 | 44.37 | 3.08 | 45.25 | 3.14 | 0.49 |
| RL6-LL6 | 50.43 | 3.35 | 46.86 | 2.65 | 0.07 | 46.89 | 2.07 | 46.86 | 3.22 | 0.98 |
| RGo-LGo | 93.64 | 8.38 | 89.07 | 5.67 | 0.12 | 86.22 | 5.67 | 83.85 | 7.23 | 0.37 |
| RAg-LAg | 82.05 | 6.88 | 78.94 | 4.79 | 0.19 | 77.69 | 4.35 | 75.252 | 5.61 | 0.23 |
| RMa-LMa | 52.78 | 4.88 | 52.8 | 4.59 | 0.99 | 53.13 | 4.53 | 54.52 | 4.06 | 0.44 |
According to the findings shown in Table III , statistically significant differences were detected in maxillary intermolar, and bigonial and biantegonial widths between true and pseudo-Class III malocclusions. Maxillary intermolar width was significantly lower in pseudo-Class III malocclusions than in true Class III malocclusions. On the other hand, no significant changes were found in mandibular intermolar widths between pseudo-Class III and true Class III malocclusions. Moreover, although significant differences were found in bigonial and biantegonial widths, the mean maxillary skeletal base widths were not significant.
| Measurement | True Class III | Pseudo-Class III | P | ||
|---|---|---|---|---|---|
| Mean | SD | Mean | SD | ||
| RU6-LU6 | 46.79 | 3.44 | 44.76 | 3.07 | 0.032 ∗ |
| RL6-LL6 | 48.43 | 3.43 | 46.88 | 2.57 | 0.08 |
| RGo-LGo | 91.08 | 7.21 | 85.18 | 6.39 | 0.004 † |
| RAg-LAg | 80.31 | 5.88 | 76.62 | 4.99 | 0.021 ∗ |
| RMa-LMa | 52.79 | 4.62 | 53.74 | 4.30 | 0.46 |
Stay updated, free dental videos. Join our Telegram channel
VIDEdental - Online dental courses


