Introduction
The purpose of this study was to determine the relationships between cephalometric measurements and cone-beam computed tomography-based measurements of the palatal bone thickness.
Methods
Thirty sets of cone-beam computed tomography images and lateral cephalograms were used. Palatal bone thicknesses were measured anteroposteriorly from between the first and second premolars to between the first and second molars using both imaging methods, and also laterally from 1.5 mm off-center to 10 mm off-center in the cone-beam computed tomography images. Repeated-measures analysis of variance was used to examine the differences between the measurements.
Results
Bland-Altman plots showed that the 95% limits of agreement were smallest at 5 mm off-center (−0.2 ± 1.7 mm). The 5-mm off-center measurements were the only ones for which there were no statistically significant differences compared with the cephalometric measurements in all anteroposterior areas. The measurements at 1.5 mm off-center were significantly thicker than the cephalometric measurements only from the area between the second premolar and the first molar to the area between the first and second molars.
Conclusions
Among the areas measured, the bone at 5 mm off-center is most likely to be depicted in cephalograms as palatal bone contours.
The palate is a preferred area for orthodontic mini-implant placement because there is little danger of damaging anatomic structures other than the incisive foramen. Also, there is a relatively large bone mass in the median and flanking regions of the palate with dense soft tissues on the surface of the hard palate, thus facilitating the formation of compact connective tissues around the cervical part of the implant.
The most appropriate length for a mini-implant should be determined from measurements of the palatal bone thickness to ensure that the maximum thickness of palatal bone is used without penetrating the palate. Although cone-beam computed tomography (CBCT) can be used to measure palatal bone thickness, Jung et al and Winsauer et al suggested that CBCT should be used only in rare cases of borderline palatal bone thickness.
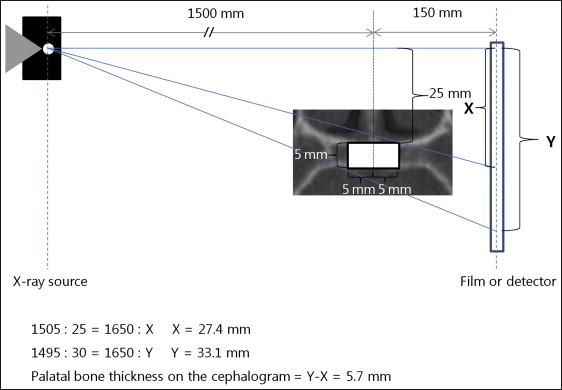
A cephalogram can be used to measure palatal bone thickness, but care must be taken because of the magnification, which is typically 110%. Because a cephalogram is a 2-dimensional view of a 3-dimensional object with a perspective projection, the magnifications of the right and left structures differ, resulting in an unequal overlap of these structures. The location of an object between the x-ray source and the film determines the magnification of the image, with structures closer to the x-ray source appearing larger. The distance between the source and the subject’s midsagittal plane is typically 1500 mm, and the distance between the subject’s midsagittal plane and the detector is 150 mm, with the central ray passing through the center of the mechanical porion. The half of the palatal bone that is closer to the source is projected on the film as if it were positioned more inferiorly, and so it appears larger than the half on the contralateral side. To illustrate the typical magnification in the cephalogram of palatal bone thickness at 5 mm off-center, consider the following assumptions ( Fig 1 ): the palatal bone thickness at 5 mm off-center is 5 mm, and the vertical distance from the central ray to the superior side of the palatal bone is 25 mm. According to the calculation of magnification illustrated in Figure 1 , a 5-mm thickness of palatal bone at 5 mm off-center will be projected onto the film as a thickness of 5.7 mm, which is a magnification of 114%. Jung et al reported that the vertical dimensions on lateral cephalometry reflect the minimum thickness of bone and not the maximum thickness in the median plane. In that study, the nasal floors and palates of dry skulls were covered with tinfoil before the radiographs were obtained. In this condition, the bony palate will probably appear thinner in the cephalogram because its apparent thickness will be determined by the oblique x-rays passing through the tinfoil on the nasal floor closer to the x-ray source and the tinfoil on the palatal side closer to the film. Covering the nasal floor and palate with tinfoil from the center to 5 mm off-center will result in 106% magnification instead of 114% when the same conditions shown in Figure 1 are assumed.
In several studies, the authors, using CBCT or computed tomography, found that the palatal bone thickness tends to decrease laterally or posteriorly. Wehrbein et al reported that the thickness of the anterior and median hard palate was 2 mm thicker than that shown in lateral cephalograms. Cephalograms might not depict the maximum thickness of the median palate, but no previous study has investigated which part of the palate in the transverse aspect is depicted on the cephalogram.
The purpose of our study was to test the null hypothesis that there is no relationship between palatal bone thickness values in various transverse areas measured cephalometrically and with CBCT.
Material and methods
This study was approved by the local ethics committee of School of Dentistry, Chosun University, Gwangju, Korea (CDMDIRB 1218-86). Thirty sets of CBCT images and cephalograms (for 15 male and 15 female subjects) were selected from among the CBCT and cephalogram sets from patients for whom CBCT was performed during an orthodontic examination ( Table I ). The exclusion criteria included pathologic findings, cleft palate, missing or supernumerary teeth, and previous orthodontic treatment. The lateral cephalograms and the CBCT images were obtained on the same day.
| Males (n = 15) | Females (n = 15) | |||
|---|---|---|---|---|
| Mean | SD | Mean | SD | |
| Age (y) | 19.6 | 3.4 | 19.7 | 3.8 |
| ANB (°) | 1.2 | 5.1 | 3.1 | 3.7 |
| FMA (°) | 26.5 | 4.7 | 28.0 | 4.1 |
| ICW (mm) | 36.0 | 2.6 | 35.7 | 2.1 |
| IMW (mm) | 38.7 | 3.2 | 38.2 | 3.3 |
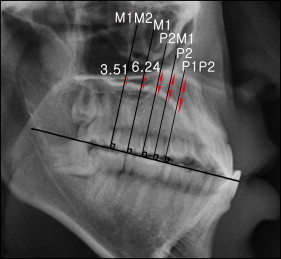
The lateral cephalograms were obtained using an orthopantomograph equipped with a cephalostat (PM 2002 Proline; Planmeca, Helsinki, Finland). The following parameters were used for lateral cephalometry: 80 kV, 12 mA, and exposure time of 1.4 to 1.6 seconds. The cephalograms were stored in a picture archiving and communications system server after scanning the computed radiography cassette. Measurements were made using STARPACS PiViewSTAR (version 5.0; Infinitt, Seoul, Korea). The occlusal plane was used as a reference plane for both cephalometric and CBCT-based measurements ( Table II ). The occlusal plane was determined as the plane passing the incisal edge of the maxillary left central incisor and the mesiolingual cusp tips of the maxillary right and left first molars. Average points between the right and left landmarks were used in the cephalometric measurements. Lines were then drawn that were perpendicular to the occlusal plane and passed at the contact point of the first and second premolars (P1P2), at the lingual cusps of the right and left second premolars (P2), at the contact point of the second premolars and the right and left first molars (P2M1), at the mesiolingual cusps of the right and left first molars (M1), and at the contact point of the first and second molars (M1M2). In all cases, the average points between the right and left landmarks were used. Palatal bone thicknesses were measured along these lines ( Table II ; Fig 2 ).
| Plane or landmark | Definition |
|---|---|
| Occlusal plane | A plane passing the incisal edge of the maxillary left central incisor and cusp tips of the mesiolingual cusps of both maxillary first molars |
| Midsagittal reference plane ∗ | A plane constructed by using crista galli, anterior nasal spine, and posterior nasal spine |
| P1P2 | Contact point of the maxillary first and second premolars |
| P2 | Lingual cusp tip of the maxillary second premolar |
| P2M1 | Contact point of the maxillary second premolar and first molar |
| M1 | Mesiolingual cusp tip of the maxillary first molar |
| M1M2 | Contact point of the first and second molars |
To compare the CBCT-based measurements and the cephalometric measurements, the cephalometric measurements were converted to 100% magnification. The x-ray source to object distance was 1510 mm, and the object to film distance was 128 mm, resulting in magnification of 108.5%. Therefore, conversion to 100% magnification was achieved by dividing the cephalometric measurements of palatal bone thickness by 1.085.
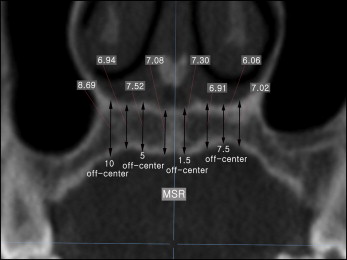
The CBCT images were obtained using a scanner (CB MercuRay; Hitachi, Osaka, Japan) with the following parameters: field of view, 149.5 × 149.5 mm; 120 kV; 15 mA; scan time, 9.6 seconds; slice thickness, 0.292 mm; and isometric voxel size, 0.292 mm. Measurements from the CBCT images were made using Ondemand3D 1.0 (Cybermed, Seoul, Korea). A preset of window level (level, 805 HU; width, 2829 HU) was used to maintain a constant viewing condition. This window leveling ensured that only voxels having values from −609 to 2220 HU were displayed in the program window. A midsagittal reference plane was constructed as the plane passing through the crista galli, anterior nasal spine, and posterior nasal spine. Coronal sections that were perpendicular to the occlusal plane and passing the right and left P1P2, P2, P2M1, M1, and M1M2 were selected. For each of these coronal sections, palatal bone thicknesses were measured along vertical measurement lines parallel to the midsagittal reference plane and offset from it by 1.5, 5, 7.5, and 10 mm ( Fig 3 ); these measurements were labeled as 1.5, 5, 7.5, and 10 mm off-center. The minimum palatal bone thickness was also measured within the range from the midsagittal reference plane to 10 mm off-center. The right and left measurements made on the CBCT images were averaged for each patient.
When the incisive canal or the maxillary sinus was encountered along the measurement line, the thickness value was not recorded ( Table III ). When the maxillary sinus extended medially below the nasal cavity, the palatal bone thickness measurements were made from the floor of the sinus to the inferior surface of the bony palate. Measurements made from the canal or sinus floor cannot be compared with the cephalometric measurements made from the nasal floor, which is the same as the superior surface of the bony palate; therefore, these measurements were treated as missing values.
| 1.5 mm off-center | 5 mm off-center | 7.5 mm off-center | 10 mm off-center | |
|---|---|---|---|---|
| P1P2 | ||||
| Canal | 18 (60%) | 1 (3%) | ||
| Sinus | 2 (7%) | |||
| P2 | ||||
| Canal | 4 (13%) | |||
| Sinus | 2 (7%) | 5 (17%) | ||
| P2M1 | ||||
| Canal | 1 (3%) | |||
| Sinus | 2 (7%) | 4 (13%) | ||
| M1 | ||||
| Canal | ||||
| Sinus | 1 (3%) | 4 (13%) | ||
| M1M2 | ||||
| Canal | ||||
| Sinus | 1 (3%) | 2 (7%) |
Stay updated, free dental videos. Join our Telegram channel
VIDEdental - Online dental courses


