Three-dimensional imaging techniques have greatly improved our ability to assess asymmetry by means of linear and angular measurements. However, visualizing deformities enables a unique appreciation of the underlying deformity, which might not be possible by looking at quantitative numbers alone. This article describes the method of a mirror-image analysis technique to visualize the asymmetry to assist in diagnosis and treatment planning. Other advantages of a mirror-image analysis, in addition to the quantitative analysis, are also discussed.
The development of computerized tomography (CT) has greatly reduced errors of frontal cephalometry and improved our ability to diagnose asymmetry and other craniofacial deformities. Cone-beam CT (CBCT) was developed for 3-dimensional (3D) imaging of the maxillofacial area and has become popular in dentistry, orthodontics, and maxillofacial surgery. The advantages of CBCT include less radiation exposure (than conventional CT), less artefact formation, and submillimeter spatial resolution. CBCT has been shown to produce accurate 3D images of the craniofacial region and a 1-to-1 image-to-reality ratio, which is necessary for accurate detection of the underlying deformities and asymmetries.
Recent literature has described new quantitative analyses to diagnose asymmetries on 3D CT or CBCT images. Because quantitative measurement is a key element in diagnosis of asymmetry, 3D images are best suited for accurate diagnosis. Quantitative measurement provides important information for treatment planning; eg, it determines the target area for operation and the surgical method to be followed. However, by looking at quantitative numbers alone, it might not be possible to appreciate the extent of the underlying deformity. To overcome this limitation, Terajima et al described a visual 3D method for analyzing the morphology of patients with maxillofacial deformities. They superimposed a standard 3D Japanese skeletal model on the patient’s 3D CT images to show the underlying deformities. However, these 3D templates only satisfy the Japanese norms; this limits their clinical applications. We use a mirror image for visual analysis of the asymmetry. The mirror-image analysis does not rely on population norms and can therefore be used for the detection of asymmetries in all populations. A mirror image is a reflected duplication that appears identical but in reverse. By superimposition of the mirror image of the anatomically correct part of the anatomy over the deformity, the differences become visual and can also be quantified. The use of mirror images is not new in craniofacial imaging techniques. In maxillofacial surgery, the reverse models of 3D mirror-image templates have been described to correct and reconstruct various craniofacial abnormalities.
The aims of this study were to illustrate and discuss the method of mirror-image analysis in addition to the quantitative 3D analysis of asymmetry with a case report. The advantages of the mirror-image analysis will also be discussed.
Material and methods
A boy, aged 14 years, was referred to the Department of Orthodontics at the University of Groningen, Groningen, The Netherlands, as part of the multidisciplinary approach for treatment of Parry-Romberg syndrome. His medical history showed that noticeable asymmetry began at the age of 6 years, indicating early onset of the disease. The diagnosis of Parry-Romberg disease was made at the age of 7 years. The extraoral examination showed a marked asymmetry from atrophy of the right side of the face. The chin was deviated to the right, and deviation of the nose to the affected side was noticeable. The intraoral examination showed that the mandibular dental midline was rotated to the right. Delayed eruption of the mandibular premolars and molars was noted on the right side.
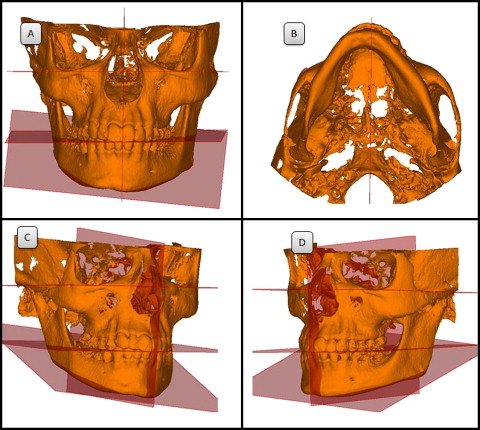
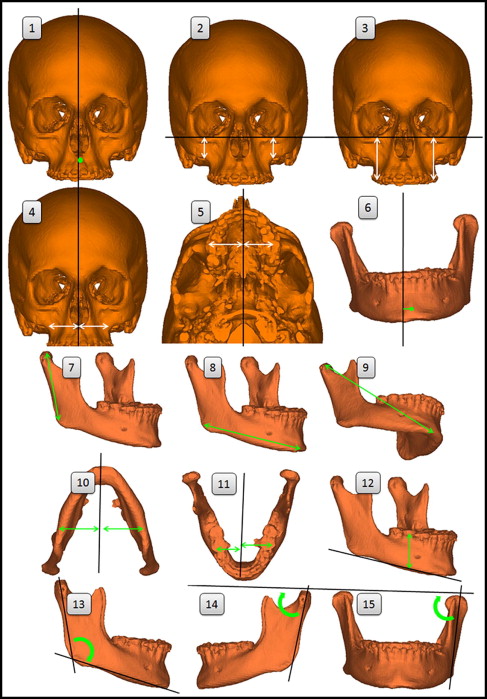
A CBCT image of the patient was acquired by using a KaVo 3D eXam scanner (KaVo Dental, Bismarckring, Germany). The image was made with a 17-cm field of view at a voxel resolution of 0.4 mm. The CBCT data set was exported in DICOM file format and imported into SimPlant Ortho Pro software (version 2.00; Materialise Dental, Leuven, Belgium). The 3D image was rendered, and surface models of the hard tissues were created with the software ( Fig 1 ). To quantify the osseous changes, a 3D analysis was developed combining linear and angular measurements previously described. The measurements used for the quantitative 3D analysis are illustrated in Figure 2 and described in Table I . Asymmetry was described by the right-side measurement subtracted from the left-side measurement.
| Reference planes | Description |
|---|---|
| 1. Midsagittal | Plane that passes through nasion and the constructed midpoint between the lateral points of the foramen magnum and the constructed midpoint between the left and right clinoid processes |
| 2. Frankfort horizontal | Plane that passes through both orbitale landmarks and through the mean of the 2 porion landmarks |
| 3. Occlusal | Plane that passes through the midpoint of the maxillary incisor tip and mandibular incisor tip landmarks, the midpoint of the maxillary right first molar mesial cusp and the mandibular right first molar mesial cusp and the mean of the maxillary left first molar mesial cusp and the mandibular left first molar mesial cusp |
| 4. Mandibular | Plane that passes through both gonion landmarks and menton |
| Measurements | Description (distance or angle) |
|---|---|
| 1. Maxillary rotation | Point A to the midsagittal plane |
| 2. Maxillary height | Jugulare to the Frankfort horizontal plane |
| 3. Maxillary dental height | Mesial cusp tip of the maxillary first molar to the Frankfort horizontal plane |
| 4. Maxillary width | Jugulare to the midsagittal plane |
| 5. Maxillary dental width | Mesial cusp tip of the maxillary first molar to the midsagittal plane |
| 6. Mandibular rotation | Pogonion to the midsagittal plane |
| 7. Ramus length | Condylion to gonion |
| 8. Body length | Gonion to menton |
| 9. Total mandibular length | Condylion to menton |
| 10. Mandibular width difference | Antegonion to the midsagittal plane |
| 11. Mandibular dental width difference | Mesial cusp tip of the mandibular first molar to the midsagittal plane |
| 12. Mandibular dental height difference | Mesial cusp tip of the mandibular first molar to the mandibular plane |
| 13. Gonial angle | Angle between a line that connects the landmarks of gonion and condylion and a line that connects gonion and menton |
| 14. Lateral ramus inclination | Angle between the Frankfort horizontal plane and a line formed by connecting the landmarks of gonion and condylion from the lateral view |
| 15. Frontal ramus inclination | Angle between the Frankfort horizontal plane and a line formed by connecting the landmarks of gonion and condylion from the frontal view |
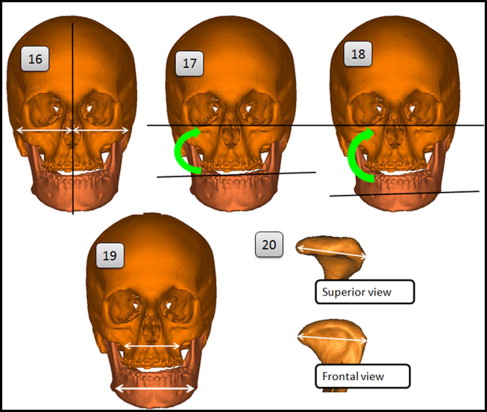
| 16. Facial width | Zygion to the midsagittal plane |
| 17. Occlusal cant | Angle between the Frankfort horizontal plane and a line connecting the maxillary left and right first molar cusps |
| 18. Mandibular cant | Angle between the Frankfort horizontal plane and a line connecting the left and right antegonion landmarks |
| 19. Maxillary total width | Jugulare left to jugulare right |
| Mandibular total width | Antegonion left to antegonion right |
| 20. Condylar width | Most lateral point of the condylar head to the most medial point of the condylar head |
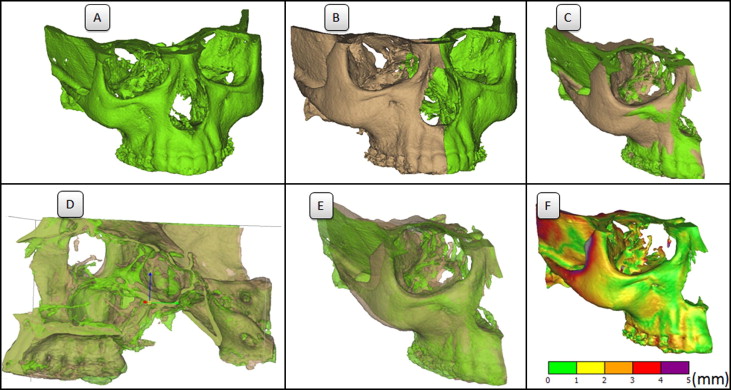
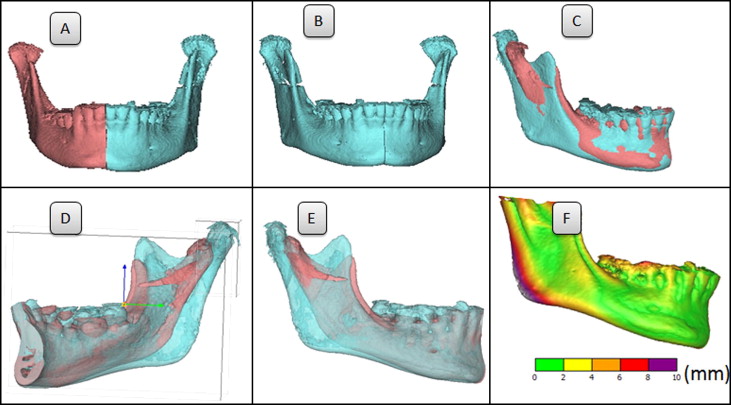
In addition to the quantitative 3D analysis, a mirror-image analysis was performed to visually analyze the extent of the atrophy and confirm the diagnosis. The method for the mirror image of the maxilla was as follows: the left unaffected side was mirrored along the midsagittal plane. The mirror image was then superimposed over the right affected side ( Fig 3 , A-C ). The software allows for the surface models to become semitransparent and allows for movement of the models in all 3 planes of space. Visual inspection of the anterior and posterior cranial base confirmed the superimposition ( Fig 3 , D ). For the mandible, a vertical plane through the spina mentalis, parallel to the midsagittal plane, was used because of the chin deviation ( Fig 4 , A ). The left side was mirrored and superimposed over the right side ( Fig 4 , A-C ). Visual inspection of the inner contour of the cortical plates of the inferior border of the symphysis confirmed the superimposition ( Fig 4 , D ). For both the maxilla and mandible, the difference in volume was visualized with the software by means of a customized color scale ( Figs 3 , F , and 4 , F ). The measurement differences were used as a guide to determine the parameters of the color scales.
Results
The quantitative results of the 3D cephalometric analysis are described in Table II . The smaller measurements indicate that the mandible and the maxilla were affected on the right side. The facial width was 5 mm less on the right side compared with the left side. This indicates restricted growth of the zygomatic arch because of soft-tissue atrophy. The maxilla height was decreased on the right side (1.7 mm). However, there was no difference between the maxillary dental heights of the left and right sides, possibly because of the overeruption of the maxillary dentition from the delayed eruption of the posterior mandibular dentition.


