Introduction
We aimed to investigate the morphometric development of the cranial base and its related structures, and their growth rate changes from the ninth gestational week to full term in a large group of human fetuses.
Methods
We selected 203 (109 male, 94 female) fetuses between 9 and 40 weeks of gestation and without any external anomalies. From each fetus, standard lateral and posteroanterior cephalometric images were taken using a dental digital panoramic and cephalometric x-ray machine. Fourteen linear and 9 angular parameters were measured.
Results
The cranial base angle showed a statistically significant increase between the groups from only the second to the third trimester periods. The sagittal translation of the maxilla increased during the prenatal period, whereas the mandibular sagittal relation grew at a steady rate. The vertical plane angles of the maxilla and the mandible did not show any significant changes. The maxillary length to mandibular length ratio remained stable.
Conclusions
The cranial base angle increased, especially in the second through the third trimesters. The maxilla and the mandible demonstrated different growth patterns in the sagittal direction. The findings of this study could be a guide for interpreting the relationships among the craniofacial structures.
Successful orthodontic diagnosis, treatment planning, and clinical procedures require a thorough understanding of growth and development. The prevention, interception, and correction of dentofacial deformities also depend largely on a proper understanding of craniofacial growth and development. The craniofacial region is a dynamic biologic continuum that begins in embryonic development and continues through senility, and its growth patterns are even more complex. The greatest changes in the proportions of the postnatal skull are those that take place in the dentofacial region, especially the jaws. The morphometric changes in this region are a challenge because all parts of the cranial and facial bones grow at different rates and in different directions.
The importance of craniofacial growth before birth and its relevance postnatally have been reported previously. Prenatal development sheds light on postnatal development. The etiologic factors responsible for some positional abnormalities of the maxilla and the mandible are also related to their embryonic fetal development. Studies of prenatal craniofacial growth, especially during the last 2 trimesters, have also shown growth patterns that are similar to postnatal craniofacial growth.
In previous studies, morphometric measurements of the craniofacial region during the prenatal period were carried out either anatomically on cadavers or by ultrasound on pregnant women. Cephalometric growth studies have been devoted almost exclusively to the period from birth to adulthood. Little radiographic work has been done on fetus cadavers. Rabkin studied 125 embryos and fetuses up to 6 months old. He reported that the skeletal structure and morphology of the jaws have an inherent predetermined pattern in the embryo-fetal life of each person. Ford analyzed 76 fetuses from 10 to 40 weeks of age. By means of linear measurements, he demonstrated changes in width, height, and depth as a result of differential growth rates of the fetal skull. However, most studies on the prenatal period are limited to a certain number of gestational weeks or have limited samples. Kjaer argued that malformations of any cranial region or the dentition affect all craniofacial tissues, and that there is a need for prenatal autopsy studies to advance fetopathology and the understanding of postnatal development. Therefore, we aimed to investigate the development of the cranial base and its related facial structures and to determine their growth rate changes from 9 weeks until full term in a large series of human fetuses using the cephalometric method.
Material and methods
In this study, a collection of 335 human fetus cadavers was examined. All fetuses resulting from spontaneous or legally induced abortions were collected between 1997 and 2010 in the Isparta province of southwestern Turkey. Thorax and abdomen autopsies were made, and fetuses with any organ anomalies or external malformations were excluded from the study. We obtained 232 fetus cadavers, with approval from the parents. The fetuses were between 9 and 40 weeks of gestation and had no external anomalies. Eighteen fetuses were excluded because of deformations in the craniofacial region. During the radiographic measurements, 11 fetuses were excluded because of the lack of accurate anatomic landmarks. Moreover, in 7 fetuses, measurements related to nasion and sella were not recorded at the ninth and tenth gestational weeks because they could not be accurately determined radiographically. Consequently, 203 fetuses (109 male, 94 female) were used for the study. Written consent from the families, permission from the Ministry of Health of Turkey, and ethical approval from the board of the faculty of medicine of the University of Süleyman Demirel were obtained before the study. The fetuses were fixed in 10% formaldehyde.
The gestational ages of the fetuses were determined according to general parameters (crown-rump length, biparietal diameter, head circumference, femur length, and foot length) between weeks 9 and 40 ( Table I ).
| Gestational age (wk) | n | Crown-rump length | Head circumference | Biparietal diamater | Femur length | Foot length |
|---|---|---|---|---|---|---|
| 9 | 4 | 65 | 60 | 15 | 13 | 8 |
| 10 | 2 | 68 | 67 | 16 | 13 | 9 |
| 11 | 3 | 84 | 81 | 17 | 20 | 12 |
| 12 | 4 | 90 | 84 | 22 | 21 | 12 |
| 13 | 6 | 94 | 97 | 24 | 21 | 14 |
| 14 | 7 | 105 | 97 | 25 | 25 | 16 |
| 15 | 6 | 107 | 114 | 31 | 29 | 18 |
| 16 | 12 | 121 | 122 | 33 | 31 | 21 |
| 17 | 15 | 126 | 132 | 36 | 35 | 22 |
| 18 | 10 | 144 | 146 | 39 | 38 | 26 |
| 19 | 8 | 152 | 159 | 41 | 41 | 29 |
| 20 | 9 | 159 | 170 | 46 | 44 | 31 |
| 21 | 8 | 167 | 183 | 49 | 49 | 34 |
| 22 | 6 | 185 | 203 | 55 | 51 | 37 |
| 23 | 7 | 187 | 210 | 55 | 54 | 39 |
| 24 | 8 | 199 | 218 | 57 | 60 | 43 |
| 25 | 10 | 206 | 228 | 58 | 61 | 44 |
| 26 | 6 | 207 | 234 | 60 | 64 | 46 |
| 27 | 6 | 233 | 247 | 64 | 65 | 54 |
| 28 | 4 | 237 | 267 | 66 | 70 | 55 |
| 29 | 4 | 245 | 273 | 67 | 73 | 55 |
| 30 | 6 | 252 | 275 | 71 | 72 | 56 |
| 31 | 5 | 263 | 281 | 74 | 73 | 59 |
| 32 | 3 | 266 | 292 | 76 | 76 | 60 |
| 33 | 6 | 266 | 295 | 77 | 79 | 62 |
| 34 | 3 | 267 | 301 | 77 | 79 | 63 |
| 35 | 3 | 278 | 305 | 78 | 85 | 68 |
| 36 | 7 | 292 | 323 | 80 | 89 | 72 |
| 37 | 5 | 294 | 338 | 93 | 91 | 72 |
| 38 | 6 | 302 | 349 | 93 | 96 | 74 |
| 39 | 3 | 312 | 353 | 96 | 97 | 77 |
| 40 | 11 | 328 | 363 | 95 | 99 | 78 |
General parameters were the following: (1) crown-rump length, the vertical length between 2 planes passing through the vertex and lowermost point of the rump; (2) head circumference, circumferential line passing through glabella, parietal tubers, and inion (external occipital protuberance); (3) biparietal diameter, transverse length between parietal tubers; (4) femur length, vertical length between the tip of the greater trochanter and the midpoint of the knee joint; and (5) foot length, length between the posteriormost point of the heel and the anteriormost point of the toes.
The fetuses were divided into 8 groups according to gestational months (9-12 weeks, third month; 13-16 weeks, fourth month; 17-20 weeks, fifth month; 21-24 weeks, sixth month; 25-28 weeks, seventh month; 29-32 weeks, eighth month; 33-36 weeks, ninth month; and 37-40 weeks, tenth month). They were also divided into 4 groups according to trimester. Fetuses aged 9 to 13, 13 to 25, 26 to 37, and 38 to 40 weeks were allocated into groups I (first trimester), II (second trimester), III (third trimester), and IV (full term), respectively.
Lateral and posteroanterior cephalometric images were taken of each fetus using a dental digital panoramic and cephalometric x-ray machine (Pax-400C; Vatech Co Ltd, Gyeonggi-Do, Korea). All fetuses were placed in a standard vertical position using cephalostat rods. Radiation doses were adjusted in a range of 40 to 70 kV and 3 to 8 mA according to gestational weeks. The film-to-focal spot distance was 160 cm. Fourteen linear and 9 angular parameters were measured on the lateral cephalometric films using Easy Dent 4 Viewer (Vatech Co Ltd). In addition, 3 proportional measurements were also calculated. The Easy Dent 4 Viewer software program is as precise as 10 μm and 0.1°. The parameters were defined as follows.
N-S, S-Ba, N-S-Ba angle, and N-S/S-Ba were used as cranial base measurements for the lateral cephalometric films ( Figs 1 and 2 , A ).
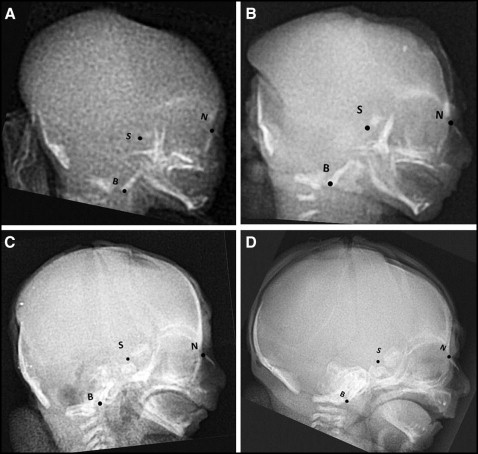

Since sella turcica was not formed exactly in the early stages of gestation, sella was measured as the geometric midpoint of the area located among the presphenoid and postsphenoid bones from weeks 11 to 24 of gestation as described in previous studies, and this point was termed “sella mean” until 24 weeks of gestation. After 24 weeks, sella could be determined easily ( Fig 1 ).
S-N-ANS angle, S-N-Pg angle, ANS-N-Pg angle, and N-ANS-Pg angle were used to assess the maxillary and mandibular sagittal positions.
ANS and Pg were used for these parameters because Points A and B had not yet formed.
We also measured maxillary length (ANS-PNS), mandibular corpus length (Go-Me), mandibular ramus length (Co-Go), and gonial angle (Co-Go-Me).
The vertical facial heights and angles were SN-PP angle, SN-MP angle, PP-MP angle, N-ANS, ANS-Me, N-Me, S-Go, and N-ANS/ANS-Me.
The posteroanterior cephalometric measurements ( Fig 2 , B ) were 7 linear parameters measured on the posteroanterior cephalometric films: internal-canthal length, external-canthal length, nasal width, bizygomatic length, bicondylar length, bimaxillary length, and bigonial length.
Statistical analysis
Dahlberg’s formula was used to assess the method error for all parameters on 50 randomly selected films. The first measurements were done by the first author (E.E.), and the second measurements were done by the second author (E.H.S.) 1 month later. The errors ranged from r = 0.81 to 0.96 for intraobserver variability, and from r = 0.73 to 0.92 for interobserver variability ( Table II ). No significant differences were found between the intraobserver and interobserver variabilities ( P <0.05). The means and standard deviations of all parameters with respect to sex, gestational age, and groups were computed using SPSS software (version 15; SPSS, Chicago, Ill). A P value of <0.05 was considered the threshold for statistical significance. Parametric values of the groups are presented as means and standard deviations in Tables III through VI . Analysis of variance was used for group comparisons. Nonparametric tests were also used because of the limited number of fetuses in some groups. The Kruskal-Wallis analysis of variance was performed, and then any significant groups according to these results were compared pairwise with the Mann-Whitney U test. The levels of significance were tested with the Bonferroni correction. The Pearson correlation was used to assess the relationships between the parameters and gestational age (in weeks) and the general parameters. The Student t test (for all cases combined) was used to determine the sex differences in the parametric data.
| Parameter | r1 | r2 | Parameter | r1 | r2 | Parameter | r1 | r2 |
|---|---|---|---|---|---|---|---|---|
| N-S (mm) | 0.86 | 0.78 | Co-Go-Me (°) | 0.88 | 0.81 | Internal canthal (mm) | 0.82 | 0.79 |
| S-Ba (mm) | 0.83 | 0.73 | ANS-PNS (mm) | 0.87 | 0.85 | External canthal (mm) | 0.90 | 0.84 |
| N-S-Ba (mm) | 0.81 | 0.73 | SN-PP (°) | 0.87 | 0.77 | Bizygomatic (mm) | 0.92 | 0.87 |
| S-N-ANS (°) | 0.84 | 0.79 | PP-MP (°) | 0.91 | 0.82 | Nasal width (mm) | 0.92 | 0.87 |
| S-N-Pg (°) | 0.88 | 0.82 | SN-MP (°) | 0.87 | 0.82 | Bimaxillary (mm) | 0.84 | 0.78 |
| ANS-N-Pg (°) | 0.91 | 0.88 | N-ANS (mm) | 0.93 | 0.91 | Bicondylar (mm) | 0.89 | 0.81 |
| N-ANS-Pg (°) | 0.91 | 0.89 | ANS-Me (mm) | 0.93 | 0.90 | Bigonial (mm) | 0.91 | 0.83 |
| Co-Go (mm) | 0.88 | 0.86 | N-Me (mm) | 0.96 | 0.92 | |||
| Go-Me (mm) | 0.93 | 0.89 | S-Go | 0.88 | 0.77 |
| Group (mo) | n | N-S (mm) ∗ | S-Ba (mm) † | N-S-Ba (°) ‡ | S-N-ANS (°) § | S-N-Pg (°) ‖ | ANS-N-Pg (°) ¶ | N-ANS-Pg (°) # |
|---|---|---|---|---|---|---|---|---|
| Third (11-12 wk) | 7 (4 M, 3 F) | 12.21 ± 4.51 | 7.41 ± 1.77 | 130.15 ± 7.80 | 76.82 ± 6.17 | 64.06 ± 4.55 | 12.38 ± 4.61 | 155.94 ± 9.58 |
| Fourth (13-16 wk) | 31 (21 M, 10 F) | 15.50 ± 2.09 | 10.31 ± 1.71 | 130.14 ± 8.22 | 80.98 ± 5.67 | 62.01 ± 4.47 | 18.96 ± 5.32 | 147.23 ± 6.98 |
| Fifth (17-20 wk) | 42 (18 M, 24 F) | 19.88 ± 2.44 | 13.20 ± 1.69 | 131.37 ± 7.92 | 84.59 ± 5.22 | 65.75 ± 4.76 | 18.73 ± 4.51 | 147.10 ± 7.02 |
| Sixth (21-24 wk) | 29 (14 M, 15 F) | 25.93 ± 2.33 | 16.23 ± 1.31 | 131.34 ± 5.78 | 89.43 ± 4.86 | 68.33 ± 4.50 | 21.07 ± 2.47 | 143.95 ± 5.19 |
| Seventh (25-28 wk) | 26 (14 M, 12 F) | 29.42 ± 2.22 | 17.59 ± 1.22 | 131.60 ± 5.74 | 88.72 ± 4.32 | 67.68 ± 3.06 | 21.03 ± 3.06 | 144.84 ± 4.15 |
| Eighth (29-32 wk) | 18 (9 M, 9 F) | 34.26 ± 1.82 | 19.57 ± 1.31 | 137.16 ± 5.08 | 90.20 ± 3.03 | 67.79 ± 4.29 | 22.41 ± 2.72 | 142.23 ± 4.70 |
| Ninth (33-36 wk) | 19 (11 M, 8 F) | 37.24 ± 1.85 | 20.23 ± 1.93 | 138.52 ± 4.91 | 87.34 ± 5.34 | 67.66 ± 4.32 | 19.68 ± 3.55 | 146.35 ± 5.76 |
| Tenth (37-40 wk) | 25 (13 M, 12 F) | 41.36 ± 4.52 | 22.42 ± 2.21 | 140.32 ± 5.10 | 90.81 ± 4.08 | 68.64 ± 3.73 | 22.14 ± 3.95 | 141.29 ± 5.72 |
| Group (trimester) | n | N-S (mm) ∗ ∗ ,† †, ‡ ‡ | S-Ba (mm) ∗ ∗ ,†† ,‡‡ | N-S-Ba (°) †† | S-N-ANS (°) ∗∗ ,†† ,‡‡ | S-N-Pg (°) † | ANS-N-Pg (°) ∗∗ ,†† | N-ANS-Pg (°) ∗∗ |
|---|---|---|---|---|---|---|---|---|
| I (11-12 wk) | 7 (4 M, 3 F) | 12.21 ± 4.51 | 7.41 ± 1.77 | 130.15 ± 7.80 | 76.82 ± 6.17 | 64.06 ± 4.55 | 12.38 ± 4.61 | 155.94 ± 9.58 |
| II (13-25 wk) | 112 (57 M, 55 F) | 21.03 ± 5.06 | 13.55 ± 2.91 | 130.80 ± 7.20 | 85.17 ± 6.03 | 65.55 ± 5.03 | 19.56 ± 4.27 | 146.22 ± 6.41 |
| III (26-37 wk) | 58 (32 M, 26 F) | 34.67 ± 4.34 | 19.55 ± 2.03 | 136.99 ± 5.76 | 88.76 ± 4.46 | 67.68 ± 3.84 | 21.07 ± 3.34 | 144.23 ± 5.13 |
| IV (38-40 wk) | 20 (11 M, 9 F) | 41.23 ± 4.61 | 22.39 ± 2.39 | 139.78 ± 5.41 | 91.49 ± 4.06 | 68.96 ± 4.08 | 22.50 ± 4.11 | 140.70 ± .96 |
| Total absolute change (11-40 wk) | 197 (109 M, 94 F) | 29.15 | 15.32 | 10.17 | 13.99 | 4.58 | 9.76 | −145.65 |
∗ P <0.05, differences between all groups.
† P < 0.05, differences between all groups except between months 8 and 9.
‡ P <0.05, differences between months 7 and 8, and 8 and 9.
§ P <0.05, differences between all groups except between months 6 and 7, 7 and 8, and 8 and 9.
‖ P < 0.05, differences between months 3 and 4, 4 and 5, and 5 and 6.
¶ P <0.05, differences between months 3 and 4, 5 and 6, and 8 and 9.
# P <0.05, differences between months 3 and 4, 5 and 6, 8 and 9, and 9 and 10.
∗∗ P <0.05, differences between trimesters 1 and 2.
| Group (mo) | n | Co-Go (mm) ∗ | Go-Me (mm) ∗ | Co-Go-Me (°) † | ANS-PNS (mm) ∗ |
|---|---|---|---|---|---|
| Third (9-12 wk) | 13 (9 M, 4 F) | 3.42 ± 0.99 | 6.96 ± 0.76 | 152.60 ± 5.03 | 7.07 ± 1.27 |
| Fourth (13-16 wk) | 31 (21 M, 10 F) | 4.70 ± 0.99 | 9.38 ± 1.57 | 152.38 ± 7.79 | 10.25 ± 1.51 |
| Fifth (17-20 wk) | 42 (18 M, 24 F) | 6.03 ± 1.10 | 12.81 ± 2.06 | 146.57 ± 6.85 | 13.41 ± 2.07 |
| Sixth (21-24 wk) | 29 (14 M, 15 F) | 8.08 ± 1.35 | 17.43 ± 2.08 | 146.82 ± 7.66 | 18.07 ± 1.66 |
| Seventh (25-28 wk) | 26 (14 M, 12 F) | 9.47 ± 1.54 | 20.20 ± 2.70 | 144.18 ± 6.72 | 20.84 ± 1.67 |
| Eighth (29-32 wk) | 18 (9 M, 9 F) | 11.61 ± 1.11 | 24.33 ± 2.23 | 139.39 ± 6.47 | 23.79 ± 1.93 |
| Ninth (33-36 wk) | 19 (11 M, 8 F) | 12.44 ± 1.70 | 26.17 ± 3.00 | 141.25 ± 8.38 | 25.44 ± 2.93 |
| Tenth (37-40 wk) | 25 (13 M, 12 F) | 14.75 ± 2.01 | 28.96 ± 3.97 | 147.36 ± 9.29 | 29.48 ± 3.24 |
| Group (trimester) | n | Co-Go (mm) ‡,§,‖ | Go-Me (mm) ‡,§,‖ | Co-Go-Me (°) §,‖ | ANS-PNS (mm) ‡,§,‖ |
|---|---|---|---|---|---|
| I (9-12 wk) | 13 (9 M, 4 F) | 3.42 ± 0.99 | 6.96 ± 0.76 | 152.60 ± 5.03 | 7.07 ± 1.27 |
| II (13-25 wk) | 112 (57 M, 55 F) | 6.41 ± 1.78 | 13.63 ± 3.95 | 148.32 ± 7.63 | 14.37 ± 3.86 |
| III (26-37 wk) | 58 (32 M, 26 F) | 11.74 ± 1.97 | 24.32 ± 3.70 | 141.17 ± 7.05 | 24.04 ± 3.23 |
| IV (38-40 wk) | 20 (11 M, 9 F) | 14.74 ± 2.13 | 29.07 ± 4.08 | 148.16 ± 9.88 | 29.61 ± 3.42 |
| Total absolute change (9-40 wk) | 203 (109 M, 94 F) | 11.33 | 22 | −5.24 | 22.41 |
∗ P <0.05, differences between all groups except between months 8 and 9.
† P <0.05, differences between months 4 and 5, and 7 and 8.
‡ P <0.05, differences between trimesters 1 and 2.
Results
Arithmetic means and comparisons of all parameters with respect to months and trimester groups are presented in Tables III through VI . Significant linear increases in the metric parameters were observed throughout the fetal period as expected ( P <0.05). A correlation between the general and cephalometric parameters was found, but there were no significant differences in morphometric parameters between the sexes.
Stay updated, free dental videos. Join our Telegram channel
VIDEdental - Online dental courses


