Abstract
The aim of this study was to describe skeletal and posterior airway changes after orthodontic treatment and surgical jaw advancement, and to evaluate whether there is a correlation between increasing advancement and a long-term reduction in obstructive sleep apnoea (OSA). Lateral cephalograms and polysomnography (apnoea–hypopnoea index, AHI) were collected from patients treated with bilateral sagittal split osteotomy (BSSO) or maxillomandibular advancement (MMA) in combination with orthodontics. Patients completed a questionnaire and the Epworth Sleepiness Scale (ESS) to assess long-term outcomes. Descriptive statistics for cephalometric measurements and linear regression were performed to find estimates of the final OSA (AHI and ESS) as a function of mandibular advancement. Forty-three patients with surgical advancement of the maxilla (5.2 mm) and mandible (8.3 mm) had a 4-mm increase in posterior airway. Thirty-three patients completed the long-term survey (6.3 ± 2.6 years after treatment); 91% reported a reduction of OSA and were pleased with their facial appearance. The maxillomandibular and posterior airway increased. There was no evidence of a linear relationship between greater amounts of mandibular advancement and improvement of OSA. Patients with less than 10 mm advancement had successful objective short-term and subjective long-term OSA reduction.
The surgical management of obstructive sleep apnoea (OSA) has evolved over the last decade and often includes orthodontics for coordination and stabilization. A systematic review in 2010 recommended larger maxillomandibular advancement (MMA) for more predictable surgical success, a concept based on the initial findings of Riley et al. in 2000. In this landmark study, a positive correlation was found with the amount of advancement and clinical improvement based on polysomnography results. The study reported a clinically significant difference in the amount of advancement when separating patients based on improvement in Respiratory Disturbance Index (RDI), and the authors concluded that 10 mm of advancement should be considered the surgical standard.
This 10 mm value has become the gold standard and the minimum amount of mandibular advancement that providers should strive to achieve in patients with OSA. However, this value is based on one relatively small study where patients did not undergo orthodontic treatment in conjunction with the surgical procedures, possibly reducing the long-term stability. The correlation between the amounts of surgical advancement and long-term reduction of sleep apnoea remains unclear. Clinical studies have shown a reduction of apnoea–hypopnoea index (AHI) scores in the short-term follow-up of 6–9 months, but long-term clinical results are unknown. In a recent cohort study with an 8-year follow-up, patients who underwent 8 mm of MMA showed significant, stable reduction of AHI. The improvements in OSA symptoms were achieved without the preferred 10 mm advancement. However, the study had a small sample.
The purpose of this study was to describe the posterior airway space changes in patients undergoing orthodontics and single or dual surgical jaw advancement, and to evaluate if there is a correlation between increasing amounts of advancement and a long-term reduction in OSA.
Materials and methods
The orthognathic surgical records of one oral surgeon and of one orthodontist were searched for all OSA patients treated (independent of outcome) with orthodontics and surgical jaw advancement from 1995 to 2010. A sleep apnoea diagnosis code in the electronic health record identified patients eligible for the study. Once patients were identified, an attempt was made to collect the cephalometric films from the oral surgeon and/or orthodontist who had overseen the completed treatment.
The following inclusion criteria were used: (1) Diagnosis of OSA prior to orthodontic treatment, as diagnosed by initial sleep study results (RDI >20 or AHI >20). (2) Treatment with orthodontics in conjunction with bilateral sagittal split osteotomy (BSSO) advancement or MMA osteotomies. (3) Cephalometric films available for four time-points: T1, the initial/pre-orthodontic film; T2, presurgical film (taken within 3 weeks before the surgery); T3, post-surgical film (taken on average 5 days post-surgery); T4, appliance removal/end of active orthodontics film (taken on average 13 months after the surgery).
Exclusion criteria were incomplete, illegible, or non-diagnostic radiographs, and pre-treatment history of facial trauma, facial surgery, or any syndrome affecting the face. Human subjects approval for this study was obtained from the institution’s human subjects divisions.
Study identification numbers for each cephalometric film replaced all patient identification information. Conventional cephalometric films were scanned with an Epson Expression 1680 scanner (Epson, Long Beach, CA, USA) at 200 dpi and captured into Dolphin Imaging Software version 11.0 (Dolphin Imaging and Management Solutions, Chatsworth, CA, USA) for measurement. When digital films or images taken on the 3dMD system (3dMD, Atlanta, GA, USA) were available, they were captured and converted into a two-dimensional (2D) lateral cephalogram for consistency.
All cephalometric radiographs were digitized and traced by the same examiner. The examiner was blinded to the subject’s identity; however, the presence of malocclusion, appliances, and fixation allowed the examiner tracing the film to be aware of the temporal sequence of the T1, T2, T3, and T4 films. The following orthodontic and skeletal landmarks were identified ( Fig. 1 ): sella (S), nasion (N), porion (Po), orbitale (Or), posterior nasal spine (PNS), A-point (A), B-point (B), gonion (Go), maxillary incisor tip (U1T), maxillary molar mesiobuccal cusp tip (Mx MBT), mandibular incisor tip (L1T), mandibular molar mesiobuccal cusp tip (Mn MBT) ( Fig. 1 ). The following reference lines were made on all tracings in order to create the descriptive linear and angular measurements of interest ( Fig. 1 ): constructed horizontal plane (S–N line, 7°) and x -axis (vertical at S, perpendicular to constructed horizontal plane).

The descriptive linear and angular cephalometric film measurements made at each time interval included the following ( Fig. 1 ): overjet (OJ), posterior airway space (PAS; distance between the base of the tongue and the posterior pharyngeal wall, derived from a line connecting B-point to Go in millimetres), x -axis to PNS (PNSx; from the constructed vertical to PNS in millimetres, describes the horizontal position of the maxilla), x -axis to B-point (Bx; from the constructed vertical to B-point in millimetres, describes the horizontal position of the mandible).
To measure the skeletal changes throughout treatment, the difference was calculated for each of the descriptive measurements of PAS, PNSx, and Bx. The differences were calculated for each of the following time periods: T1–T2, T2–T3, T3–T4, and T1–T4. The measured changes from T2–T3 verified the surgical advancement of the maxilla and/or mandible. The changes from T3–T4 demonstrated any post-surgical relapse and dentoalveolar corrections or compensations. The changes from T1–T4 demonstrated the overall skeletal changes throughout treatment.
All linear measurements were corrected for magnification. Cephalometric films possessing rulers or some magnification scale were adjusted accordingly. For films not possessing rulers, magnification was adjusted by using the length of the sella–nasion line in millimetres and calibrated in Dolphin, as the cranial base is considered relatively stable beyond 7 years of age.
Survey
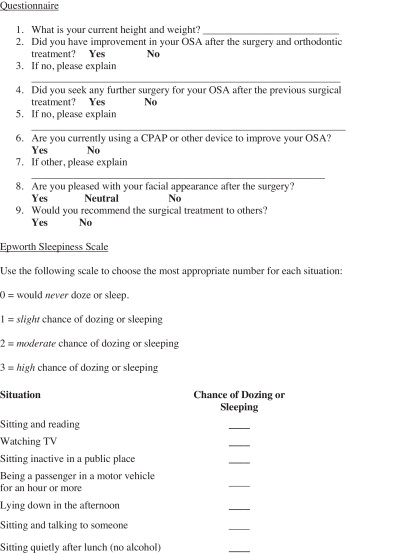
All patients identified for the retrospective cephalometric study were recruited to participate in an online survey. The survey assessed the long-term results of the OSA treatment. In addition to the Epsworth Sleepiness Scale (ESS), questions were asked regarding current height and weight, improvement in OSA, whether further treatment was obtained, whether they were pleased with their facial appearance, and whether they would recommend the surgery to others (see Fig. 2 ). Contact information was collected during the initial screening of records, along with the age, height, weight, gender, pretreatment start date, date of surgery, date of fixed orthodontic appliance removal, Angle classification, and initial and final polysomnography reports.
Subgroups
The ‘total sample’ comprised the total number of patient records that were identified and met the inclusion criteria. The ‘cephalometric subsample’ comprised the subgroup of patients for whom all four lateral cephalograms were available. The ‘survey subsample’ consisted of those patients who returned the long-term survey questionnaire. The ‘ESS subsample’ included patients with all four lateral cephalograms, who also returned the long-term survey questionnaire. The ‘AHI subsample’ comprised patients with all four lateral cephalograms and both initial and final sleep study analyses (AHI index).
Statistical analysis
Data collection and statistical analysis was completed using Microsoft Excel (Microsoft, Redmond, WA, USA) and IBM SPSS Statistics, version 19.0 (IBM Corp., Armonk, NY, USA). Descriptive statistics were calculated for all cephalometric measurements, and the significance level was set at P < 0.05 for the change from initial to final measurements. Linear regression was performed to find estimates for the final OSA outcomes (AHI and ESS) as a function of mandibular advancement.
Errors due to landmark identification, tracing, digitization, and measurement were assessed by randomly choosing four patients (16 films), for the 16 linear and angular cephalometric parameters. Measurement error was assessed with Dahlberg’s formula: S 2 = ∑ d 2 /2 N , where d is the difference between repeated measurements and N is the sample size that was re-measured. The highest method error was calculated to be 1.7 for the PAS and the lowest error was 0.1 mm for upper lip to E-line (UL–E-line) and upper lip to soft tissue nasion (UL–STN).
Results
Forty-three patients treated with mandibular or dual jaw advancement in conjunction with presurgical and post-surgical orthodontics for their OSA were identified in the surgical and orthodontic records. Table 1 describes the initial presentation of the total sample and sub-samples from the screening of records. The cephalometric sub-sample consisted of 29 patients who had complete cephalometric films from initial to final treatment. The survey sub-sample consisted of 33 patients who participated in the long-term outcomes questionnaire and ESS evaluation. The ESS sub-sample consisted of 22 patients from the original 33, who had complete cephalometric films, initial AHI values, and long-term ESS scores. The AHI sub-sample consisted of 12 patients who had complete cephalometric films and initial and final AHI values.
| Parameters | Total sample ( N = 43) | Ceph sub-sample ( n = 29) | Survey sub-sample ( n = 33) | ESS sub-sample ( n = 22) | AHI sub-sample ( n = 12) |
|---|---|---|---|---|---|
| Age, years | 44.9 ± 9.4 | 44.9 ± 9.3 | 45.7 ± 8.9 | 45.4 ± 9.0 | 43.6 ± 8.4 |
| Men | 26 (60%) | 15 (52%) | 18 (55%) | 10 (45%) | 5 (42%) |
| Women | 17 (40%) | 14 (48%) | 15 (45%) | 12 (55%) | 7 (58%) |
| BMI, kg/m 2 | 28.2 ± 5.6 b | 28.3 ± 6.5 d | 27.3 ± 4.0 f | 26.6 ± 3.6 | 25.8 ± 3.3 |
| AHI, events/h | 44.9 ± 23.6 b | 48.6 ± 23.7 d | 47.8 ± 24.8 f | 40.2 ± 29.5 | 39.1 ± 25.2 |
| LSAT, % | 82.9 ± 6.9 c | 82.0 ± 6.8 e | 82.3 ± 7.3 g | 83.3 ± 6.5 | 83.3 ± 6.4 |
| MMA | 38 (88%) | 27 (93%) | 30 (91%) | 20 (91%) | 11 (92%) |
| Mandibular advancement | 5 (12%) | 2 (7%) | 3 (9%) | 2 (9%) | 1 (8%) |
| Skeletal class | |||||
| I | 8 (19%) | 6 (21%) | 6 (18%) | 3 (14%) | 2 (17%) |
| II | 27 (63%) | 19 (66%) | 22 (67%) | 17 (77%) | 10 (83%) |
| III | 8 (19%) | 4 (13%) | 5 (15%) | 2 (9%) | 0 (0%) |
a Results are given as the mean ± standard deviation, or number (%). Ceph, AHI, ESS, and survey sub-samples are as described in the text.
Twenty-nine patients fit the inclusion criteria for the cephalometric study. The main reason for exclusion was the lack of complete films at the four time-points, most specifically the long-term film. Table 1 outlines the initial presentation of the cephalometric sub-sample. This sample had a balanced distribution of 15 men and 14 women, with an average age of 44.9 ± 9.3 years. The average body mass index (BMI) was 28.3 ± 6.5 kg/m 2 , categorizing the patients as overweight. The average AHI was severe at 48.6 ± 23.7 events/h and the lowest oxygen saturation (LSAT) was 82.0 ± 6.8%, which are values expected to qualify patients for the surgical management of OSA. There were six patients with a skeletal class I relationship, 19 with a class II relationship, and four with a class III relationship. Twenty-seven patients had MMA, while the remaining two had a mandibular advancement only. The average time from end of surgery to completion of treatment was 13.0 ± 8.1 months. The overall average treatment time from placement of orthodontic appliances to removal was 31.5 ± 11.8 months.
Compared to normal cephalometric measures, the cephalometric sub-sample patients presented with a decreased SNB, increased OJ, increased nasolabial angle, increased distance of UL–E-line and LL–STN perpendicular, and a constricted PAS in the anteroposterior (AP) dimension at T1. The other soft tissue and skeletal measurements were within normal cephalometric ranges.
Fig. 3 displays cephalometric medians for each of the four time-points throughout surgical and orthodontic treatment. From initial to final time points, the large skeletal changes caused many of the patients to have fuller soft tissue profiles, based on the cephalometric values. The maxilla was significantly advanced by 5.2 mm ( P = 0.002) and the mandible by 8.3 mm ( P = 0.025). This amount of skeletal advancement achieved a significant PAS increase of 4 mm ( P = 0.0001). The angular measurements of SNA and SNB were also significantly increased by 3.0° ( P = 0.009) and 2.3° ( P = 0.007), respectively. The final values of SNA (85.8°) and SNB (82°) were both above the normal range, resulting in a protrusive appearance.
From post-surgery to debond, there was minimal, insignificant clinical relapse in the maxilla, mandible, and PAS.
Forty-three patients were recruited for the online survey, which was completed by 33. Compared to the original recruited sample of 43, the survey sub-sample had a similar distribution of men and women, with slightly higher average age of 45.7 ± 8.9 years. The average BMI value paralleled the initial sample, but the AHI values were more severe at 47.8 ± 24.8 events/h versus 44.9 ± 23.6 events/h. The majority of patients had a class II skeletal discrepancy and all but three patients had MMA. The average maxillary and mandibular advancement was 4.5 ± 2.8 mm and 7.1 ± 4.6 mm, respectively.
The responses to the long-term survey questions are summarized in Table 2 . The average follow up post-surgery/debond was 6.3 ± 2.6 years (range 2–12 years). Ninety-one percent of patients reported an improvement in OSA symptoms after the surgical and orthodontic treatment. The majority of patients did not pursue any further treatment, but individuals who had unresolved symptoms tended to revert back to the use of continuous positive airway pressure (CPAP). A majority of patients experienced fluctuations in weight ( Table 2 ). Seventy-six percent of patients reported a change in weight after the surgery, with 42% experiencing an average increase of 6.8 kg (range 2.3–18.1 kg). Forty-two percent of patients had noted changes in exercise habits, with the majority decreasing their activity. Overall, patients were aware of the changes that resulted from the surgery and 91% were pleased with their facial appearance. Considering the positive responses to a successful reduction of OSA symptoms and postoperative facial changes, 79% of patients were overall satisfied with treatment and would recommend this OSA management to prospective candidates.


