A smile has a tremendous impact on perceptions of one’s attractiveness and one’s personality. Previous psychological research has shown that attractive people are perceived as more successful, intelligent, and friendly. Research extends these findings by demonstrating that teeth alone can have an impact on overall attractiveness and perceptions of personality attributes. The results of the study discussed in this article extend the attractiveness research and demonstrate that one’s smile is an important part of the physical attractiveness stereotype. One’s smile clearly plays a significant role in the perception that others have of our appearance and our personality.
One of the intriguing findings in psychological research is the existence of a physical attractiveness stereotype. Researchers have found that people believe that beautiful individuals are happier, sexually warmer, more outgoing, more intelligent, and more successful than their less attractive counterparts . Research on cosmetic surgery has shown this effect in its strongest form. One study used photographs of women before and after cosmetic surgery and found that the pictured women were perceived as more physically attractive, kinder, more sensitive, sexually warmer, more responsive, and more likable after surgery than before it .
Although the physical attractiveness stereotype has been demonstrated with overall attractiveness, the role teeth play in perceptions of overall attractiveness has never been established. It has never been ascertained whether appealing teeth alone can influence perceptions of one’s personality. This research study investigates these two questions. (The American Academy of Cosmetic Dentistry commissioned Beall Research & Training, Inc. to conduct this study to ascertain what impact attractive teeth have on perceptions of an individual’s appearance and personality attributes.)
Research design
This research used a between-subject’s design in which one half of respondents viewed one set of pictures (Set A) and the other half viewed another set of pictures (Set B) ( Table 1 ). Sets A and B comprised pictures of individuals in which one half of all photos were of a person with a “before” smile and the other half were with people with a smile “after” cosmetic dentistry. No respondent ever saw the same person with a “before” and “after” smile; however, all respondents viewed the same set of eight individuals.
| Picture set A | Picture set B | Change |
|---|---|---|
| Female pictures | ||
| Maribel ( before smile ) | Maribel ( after smile ) | Major |
| Stephanie ( after smile ) | Stephanie ( before smile ) | Major |
| Kathy ( after smile ) | Kathy ( before smile ) | Moderate |
| Shelley ( before smile ) | Shelley ( after smile ) | Minor |
| Male pictures | ||
| Jim ( before smile ) | Jim ( after smile ) | Major |
| Mike ( after smile ) | Mike ( before smile ) | Major |
| Milt ( before smile ) | Milt ( after smile ) | Moderate |
| Bob ( after smile ) | Bob ( before smile ) | Minor |
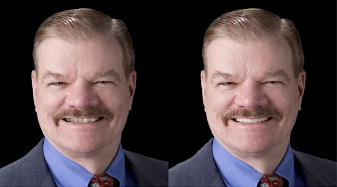
Fig. 1 contains one picture set that was shown. (To see all pictures used in this study, please visit www.aacd.com .) One half of the pictures were of men and the other half were of women. Each picture was classified in terms of the degree of change between the “before” and “after” smile. Four of the photos involved patients who underwent major changes, two underwent moderate changes, and two showed minor changes. After seeing each picture, respondents rated each person on the following attributes:
- •
Attractive
- •
Intelligent
- •
Happy
- •
Successful in their career
- •
Friendly
- •
Interesting
- •
Kind
- •
Wealthy
- •
Popular with the opposite sex
- •
Sensitive to other people
Respondents used a 1 to 10 scale, in which “1” represented “not at all” and “10” represented “extremely.” A rating of “10” on the first attribute would indicate that the respondent thought the pictured person was “extremely attractive.” Photos and ratings were randomized to eliminate order effects. All photos were randomized for each respondent along with the order of the rated attributes.
We conducted this study with a national sample of the US population. Completion quotas were set for age groups, income groups, geographic region and gender to represent the US population. The percentage of respondents in each quota category is shown at the end of this document along with the percentage of individuals for that category of the US population.
We conducted this study over the Internet. Five hundred twenty-eight respondents completed the survey. This sample size yields a confidence interval of ±4%, which means that the true answer for the US population is ±4%.
Statistical analyses
All statistical analyses were conducted on the mean ratings, which are shown in Tables 2 and 3 . We conducted a paired T-test, which is a statistical test of significance that is designed to establish if a difference exists between sample means. In this research, that result is the difference between the mean rating of people with “before” smiles and the mean rating of people with “after” smiles. Statistically speaking, the T-test is the ratio of the variance that occurs between the sample means to the variance occurring within the sample groups. A large T-value occurs when the variance between groups is larger than the variance within groups. Large T-values indicate a significant difference between the sample means.
| Attribute | Rating of “before” smile a | Rating of “after” smile a | T-statistic | Significance |
|---|---|---|---|---|
| Attractive | 4.63 | 5.89 | 25.81 | <.0001 |
| Intelligent | 5.85 | 6.51 | 16.11 | <.0001 |
| Happy | 6.22 | 6.82 | 13.59 | <.0001 |
| Successful in their career | 5.76 | 6.69 | 20.87 | <.0001 |
| Friendly | 6.26 | 6.75 | 11.94 | <.0001 |
| Interesting | 5.43 | 6.12 | 16.34 | <.0001 |
| Kind | 5.98 | 6.40 | 10.37 | <.0001 |
| Wealthy | 4.93 | 5.89 | 20.27 | <.0001 |
| Popular with the opposite sex | 5.00 | 6.18 | 23.61 | <.0001 |
| Sensitive to other people | 5.65 | 6.10 | 10.97 | <.0001 |
| Attribute | Rating of “before” smile a | Rating of “after” smile a | T-statistic | Significance |
|---|---|---|---|---|
| Attractive | 4.63 | 5.89 | 25.81 | <.0001 |
| Popular with the opposite sex | 5.00 | 6.18 | 23.61 | <.0001 |
| Successful in their career | 5.76 | 6.69 | 20.87 | <.0001 |
| Wealthy | 4.93 | 5.89 | 20.27 | <.0001 |
| Interesting | 5.43 | 6.12 | 16.34 | <.0001 |
| Intelligent | 5.85 | 6.51 | 16.11 | <.0001 |
| Happy | 6.22 | 6.82 | 13.59 | <.0001 |
| Friendly | 6.26 | 6.75 | 11.94 | <.0001 |
| Sensitive to other people | 5.65 | 6.10 | 10.97 | <.0001 |
| Kind | 5.98 | 6.40 | 10.37 | <.0001 |
We conducted a paired T-test on each attribute individually. We looked at the mean rating for the “before” smile and the “after” smile and determined if this difference was statistically significant. Because each respondent rated eight different pictures, we created a composite mean of their ratings for the “before” smile pictures and the “after” smile pictures. The T-test was conducted on these composite means.
Statistical analyses
All statistical analyses were conducted on the mean ratings, which are shown in Tables 2 and 3 . We conducted a paired T-test, which is a statistical test of significance that is designed to establish if a difference exists between sample means. In this research, that result is the difference between the mean rating of people with “before” smiles and the mean rating of people with “after” smiles. Statistically speaking, the T-test is the ratio of the variance that occurs between the sample means to the variance occurring within the sample groups. A large T-value occurs when the variance between groups is larger than the variance within groups. Large T-values indicate a significant difference between the sample means.


