Introduction
The aims of this study were to determine the linear accuracy of 3-dimensional surface models derived from a commercially available cone-beam computed tomography (CBCT) dental imaging system and volumetric rendering software and to investigate the influence of voxel resolution on the linear accuracy of CBCT surface models.
Methods
Glass sphere markers were fixed on 10 dry mandibles. The mandibles were scanned with 0.40 and 0.25 voxel size resolutions in 3 sessions. Anatomic truth was established with 6 direct digital caliper measurements. The surface models were rendered by a volumetric rendering program, and the CBCT measurements were established as the mean of the 3 measurements.
Results
The intraclass correlation coefficients between the physical measurements and the measurements of the CBCT images of 0.40 and 0.25 voxels were all more than 0.99. All CBCT measurements were accurate. There was no difference between the accuracy of the measurements between the 0.40 and 0.25 voxel size groups. The smallest detectable differences of the CBCT measurements were minimal, confirming the accuracy of the CBCT measurement procedure.
Conclusions
The measurements on 3-dimensional surface models of 0.25 and 0.40 voxel size data sets made with the 3D eXam CBCT scanner (KaVo Dental GmbH, Bismarckring, Germany) and SimPlant Ortho Pro software (version 2.00, Materialise Dental, Leuven, Belgium) are accurate compared with direct caliper measurements. An increased voxel resolution did not result in greater accuracy of the surface model measurments.
Because of the high cost and relatively high radiation exposure of helical computed tomography (CT) imaging methods, cone-beam CT (CBCT) is used more frequently for craniofacial assessment in orthodontics and oral maxillofacial surgery. CBCT captures the craniofacial structures with a single 360° rotation of a tube-detector unit. This is contrary to classic CT, in which imaging is performed in sections or layers. During the rotational scanning, many single projections are produced and these 2-dimensional images are churned by the reconstruction algorithm directly into a 3-dimensional (3D) or volumetric data set.
Drawing an object with a computer is called rendering. The object is given some characteristics to make it appear to be a real-world object with shadows and transparency. To draw a 3D image, the raw CT data are transformed to vector data by constructing a surface of many triangles covering the object of interest. Volumetric rendering programs are used to construct the 3D surface models from imported CBCT data sets by implementing an algorithm that is usually unique for each program. The 3D surface model allows for actions such as indicating landmarks, making measurements, moving bone fragments, and performing virtual osteotomies. The accuracy of the derived surface model is therefore of utmost importance, not only for diagnostic purposes but also for treatment planning and outcome.
The accuracy of CBCT images has been confirmed with various CBCT scanners. However, the accuracy of surface models derived from CBCT seems to vary. Some authors illustrated differences that, even though statistically significant, were not considered clinically relevant. These studies used anatomic landmarks on the surface models, which are subject to identification errors in the segmentation process. These factors might influence the accuracy of the measurement procedure. Therefore, the accuracy of the measurement procedures should be calculated to fully determine whether there is a significant difference between surface models and anatomic truth. To overcome the problem of landmark identification, Mischkowski et al used gutta-percha markers and concluded that the CBCT device provides satisfactory information about linear distances. Lagravere et al used titanium markers with a hollow cone on a synthetic mandible and concluded that volumetric renderings from the CBCT device produce a 1-to-1 image-to-reality ratio.
A factor that could possibly influence the accuracy of the surface models is the voxel resolution. Volume is composed of voxels, which can be considered tiny cubes arranged next to each other. Each voxel is a value (brightness or gray-scale color) that represents the x-ray density of the corresponding structure. Reducing the voxel resolution can result in a lower-quality image, more noise and artifacts, and less detailed anatomic information. Spatial resolution is lower at faster scanning times and larger voxel sizes. Greater spatial and voxel resolution results in generally “smoother” images by increasing the signal-to-noise ratio, with fewer artifacts from metallic restorations. However, greater voxel resolution is accomplished with an increased scanning time, exposing the patient to a higher radiation dosage, but there is also an increased risk of patient movement. Therefore, the influence of voxel resolution on the linear accuracy of CBCT-rendered surface models needs further investigation, since the result might be clinically relevant.
Our aims in this study were to determine the linear accuracy of CBCT-derived surface models, to investigate the influence of voxel resolution on the linear accuracy of CBCT-derived surface models, and to determine the accuracy of the measuring procedures.
Material and methods
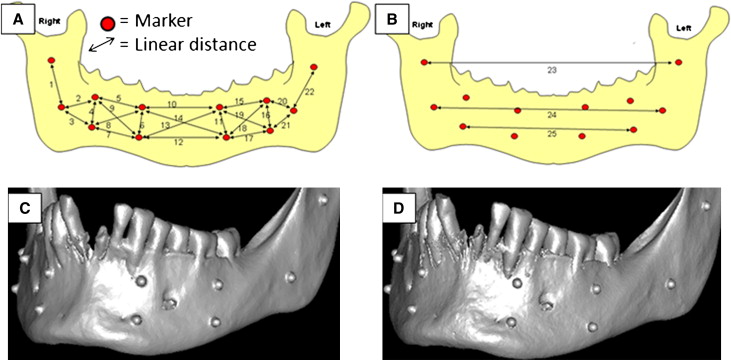
The sample included 10 dry anonymous partially dentate adult mandibles, selected from the collection of dry skulls at the Department of Orthodontics, University Medical Center Groningen. Mandibles with teeth containing metallic restorations were not used because of possible scattering and artifact formation. Twelve areas were prepared in the cortical bone of the mandibles with a round surgical bur. Spherical glass markers with a diameter of 2.4 mm (KGM Kugelfabrik Gebauer GmbH, Fulda, Germany) were fixed in the prepared areas with cyanoacrylate glue (Pattex, Uni-rapide Gold, Henkel, Nieuwegein, The Netherlands). The spherical glass markers were used to minimize inherent differences in landmark identification and to establish fiducial anatomic locations. Twenty-five linear distances, representing all 3 planes of space, were measured between the landmarks ( Fig , A ). The midpoint of the outer-most part of the sphere from the direct frontal view, opposite where it was glued to the mandible, was the reference mark. The distances between the reference marks were determined with an electronic digital caliper (GAC, Bohemia, NY) on 6 occasions, at least 3 days apart, by 2 observers (J.D. and Z.F.). The mean of the measurements was designated as the reference value, or anatomic truth.
To provide soft-tissue equivalent attenuation, a latex balloon filled with water was placed in the lingual area of the mandible. Before imaging in the CBCT scanner, the mandible was adjusted with the mandibular plane parallel to the floor and the sagittal laser reference coinciding with pogonion. The CBCT images were acquired with a 3D eXam scanner (KaVo Dental GmbH, Bismarckring, Germany). There were 3 scanning sessions of the mandibles at least a week apart. Each mandible was scanned twice during each session: once with a 0.40 voxel resolution and once with a 0.25 voxel resolution. Ultimately, each voxel size group consisted of 30 3D images of scanned mandibles. The preset parameters of the scanner are summarized in Table I . The CBCT data were exported from the eXamVisionQ software (Imaging Sciences International LCC, Hatfield, Pa) in DICOM multi-file format and imported into SimPlant Ortho Pro software (version 2.00, Materialise Dental, Leuven, Belgium) on an Aspire 7730G laptop computer (Acer, Hertogenbosch, The Netherlands) with a dedicated 512-mb video card (Geforce 9600M-GT, NVIDIA, Santa Clara, Calif). All measurements were performed on the surface models on a 17-in CrystalBrite LCD flat-panel color screen (Acer) with a maximum resolution of 1440 × 900 pixels.
| Voxel size | Projections (n) | kV | mAs | Scanning time (s) |
|---|---|---|---|---|
| 0.40 | 236 | 120 | 18.54 | 8.9 |
| 0.25 | 400 | 120 | 37.07 | 26.9 |
The 3D surface models of all mandibular images were generated by the preset threshold value for bone (250-3071 Hounsfield units) as specified by the rendering software. The SimPlant Ortho Pro software provides various views by rotating and translating the rendered image. The reference points were identified on the spherical glass markers by using a cursor-driven pointer. After landmark identification, a preprogrammed analysis provided the distances to the nearest 0.01 mm of the 25 linear measurements described in the Figure , A . The values were then exported and saved in Excel file format (Microsoft, Redmond, Wash). Each CBCT image was rendered and measured on 3 occasions by 1 observer (J.D.). The mean of the 3 measurements was called the CBCT measurement value.
Statistical analysis
The accuracy of these measurements was expressed by means of the absolute error (AE) and absolute percentage error (APE). Absolute error was defined as the CBCT measurement value subtracted from the reference value. Absolute percentage error was calculated with the following equation: APE = 100 ∗(AE/reference value). Means and standard deviations were calculated.
As a measure of reliability, the intraclass correlation coefficient (ICC) for absolute agreement based on a 2-way random-effects analysis of variance (ANOVA) was calculated between the 3 measurement techniques (digital caliper, 0.40 voxel size, and 0.25 voxel size) used in the study.
To determine the linear accuracy of the measurement procedures (direct caliper and CBCT measurements), the standard error of measurement (SEM) of the 3 consecutive CBCT sessions was calculated as the variance of the random error (interaction between locations and measurement session) from the 2-way random-effects ANOVA. SEM values were calculated for each voxel size and the physical measurements. The smallest detectable difference (SDD) was then calculated as 1.96 ∗ √2 ∗ SEM 2 . All statistical analyses were performed with a standard statistical software package (version 14, SPSS, Chicago, Ill).
Results
Accuracy of the measurements was determined by the AE and APE ( Table II ). The AE values were small: 0.01 to 0.15 mm (0.05 ± 0.04 mm) for the 0.4-voxel group and 0.00 to 0.16 mm (0.07 ± 0.05 mm) for the 0.25-voxel group. The APE values were 0.25% ± 0.37% and 0.33% ± 0.47% for the 0.40- and 0.25-voxel groups, respectively. The ICC values between the physical measurements and measurements of the CBCT images of the 2 groups were all more than 0.99.
| CBCT measurements 0.4 voxel | CBCT measurements 0.25 voxel | |||||||||||||||||
|---|---|---|---|---|---|---|---|---|---|---|---|---|---|---|---|---|---|---|
| Physical measurement (mm) | T1 | T2 | T3 | AE | T1 | T2 | T3 | AE | ||||||||||
| Measurement | Mean | SD | Mean | SD | Mean | SD | Mean | SD | Mean | SD | Mean | SD | Mean | SD | Mean | SD | Mean | SD |
| 1 | 26.14 | 5.43 | 26.09 | 5.32 | 26.09 | 5.33 | 26.08 | 5.35 | 0.09 | 0.02 | 26.17 | 5.43 | 26.13 | 5.42 | 26.13 | 5.41 | 0.02 | 0.01 |
| 2 | 24.52 | 2.96 | 24.45 | 3.02 | 24.43 | 3.00 | 24.42 | 2.97 | 0.05 | 0.05 | 24.44 | 2.92 | 24.39 | 2.85 | 24.44 | 2.88 | 0.10 | 0.03 |
| 3 | 23.73 | 2.84 | 23.73 | 2.84 | 23.63 | 2.70 | 23.68 | 2.82 | 0.14 | 0.03 | 23.72 | 2.81 | 23.73 | 2.77 | 23.73 | 2.81 | 0.00 | 0.01 |
| 4 | 10.27 | 0.94 | 10.15 | 0.93 | 10.10 | 0.96 | 10.13 | 0.93 | 0.06 | 0.04 | 10.07 | 0.96 | 10.07 | 0.96 | 10.07 | 0.99 | 0.20 | 0.00 |
| 5 | 27.41 | 2.64 | 27.36 | 2.59 | 27.51 | 2.57 | 27.43 | 2.52 | 0.03 | 0.04 | 27.50 | 2.53 | 27.50 | 2.52 | 27.49 | 2.49 | 0.09 | 0.01 |
| 6 | 10.65 | 0.64 | 10.63 | 0.66 | 10.58 | 0.71 | 10.65 | 0.71 | 0.05 | 0.01 | 10.62 | 0.68 | 10.63 | 0.71 | 10.57 | 0.67 | 0.04 | 0.03 |
| 7 | 28.69 | 2.19 | 28.64 | 2.11 | 28.63 | 2.09 | 28.64 | 2.09 | 0.13 | 0.04 | 28.74 | 2.05 | 28.72 | 2.12 | 28.71 | 2.06 | 0.03 | 0.02 |
| 8 | 30.61 | 2.31 | 30.45 | 2.13 | 30.46 | 2.10 | 30.52 | 2.15 | 0.01 | 0.01 | 30.56 | 2.10 | 30.51 | 2.11 | 30.52 | 2.09 | 0.08 | 0.03 |
| 9 | 29.16 | 2.51 | 29.17 | 2.43 | 29.15 | 2.33 | 29.18 | 2.38 | 0.01 | 0.02 | 29.25 | 2.32 | 29.29 | 2.35 | 29.24 | 2.34 | 0.10 | 0.03 |
| 10 | 36.51 | 3.94 | 36.55 | 3.86 | 36.51 | 3.84 | 36.51 | 3.82 | 0.01 | 0.00 | 36.50 | 3.85 | 36.50 | 3.87 | 36.47 | 3.89 | 0.02 | 0.02 |
| 11 | 11.10 | 0.29 | 11.09 | 0.30 | 11.11 | 0.28 | 11.09 | 0.28 | 0.02 | 0.01 | 11.02 | 0.27 | 11.09 | 0.30 | 11.07 | 0.31 | 0.04 | 0.04 |
| 12 | 37.85 | 4.06 | 37.88 | 4.14 | 37.86 | 4.10 | 37.84 | 4.16 | 0.08 | 0.01 | 37.73 | 4.18 | 37.72 | 4.10 | 37.72 | 4.15 | 0.13 | 0.01 |
| 13 | 39.47 | 3.59 | 39.39 | 3.69 | 39.38 | 3.66 | 39.39 | 3.67 | 0.05 | 0.02 | 39.33 | 3.66 | 39.33 | 3.64 | 39.32 | 3.67 | 0.14 | 0.01 |
| 14 | 38.04 | 3.73 | 38.08 | 3.69 | 37.99 | 3.71 | 37.97 | 3.73 | 0.07 | 0.03 | 37.93 | 3.75 | 37.94 | 3.69 | 37.90 | 3.74 | 0.12 | 0.02 |
| 15 | 28.49 | 2.38 | 28.44 | 2.32 | 28.42 | 2.39 | 28.39 | 2.42 | 0.15 | 0.02 | 28.45 | 2.42 | 28.47 | 2.40 | 28.50 | 2.37 | 0.02 | 0.02 |
| 16 | 10.12 | 1.38 | 9.98 | 1.34 | 9.99 | 1.36 | 9.95 | 1.31 | 0.06 | 0.02 | 9.94 | 1.36 | 9.96 | 1.36 | 9.97 | 1.36 | 0.16 | 0.02 |
| 17 | 29.45 | 2.71 | 29.53 | 2.62 | 29.51 | 2.61 | 29.50 | 2.66 | 0.01 | 0.01 | 29.49 | 2.59 | 29.53 | 2.70 | 29.57 | 2.64 | 0.08 | 0.04 |
| 18 | 31.88 | 2.43 | 31.88 | 2.33 | 31.86 | 2.35 | 31.86 | 2.37 | 0.03 | 0.02 | 31.88 | 2.37 | 31.95 | 2.40 | 31.94 | 2.36 | 0.04 | 0.04 |
| 19 | 29.67 | 2.33 | 29.71 | 2.26 | 29.70 | 2.28 | 29.66 | 2.32 | 0.04 | 0.02 | 29.64 | 2.23 | 29.66 | 2.28 | 29.68 | 2.27 | 0.02 | 0.01 |
| 20 | 20.67 | 3.88 | 20.64 | 3.90 | 20.61 | 3.89 | 20.65 | 3.90 | 0.01 | 0.01 | 20.64 | 3.87 | 20.56 | 3.86 | 20.56 | 3.87 | 0.08 | 0.05 |
| 21 | 22.38 | 4.56 | 22.39 | 4.52 | 22.40 | 4.48 | 22.39 | 4.51 | 0.01 | 0.02 | 22.48 | 4.54 | 22.42 | 4.54 | 22.37 | 4.56 | 0.05 | 0.05 |
| 22 | 25.57 | 4.72 | 25.60 | 4.69 | 25.57 | 4.73 | 25.58 | 4.71 | 0.04 | 0.02 | 25.59 | 4.77 | 25.56 | 4.78 | 25.60 | 4.75 | 0.02 | 0.01 |
| 23 | 94.53 | 2.75 | 94.50 | 2.76 | 94.51 | 2.79 | 94.47 | 2.79 | 0.02 | 0.01 | 94.58 | 2.72 | 94.56 | 2.73 | 94.53 | 2.73 | 0.03 | 0.03 |
| 24 | 86.49 | 4.88 | 86.52 | 4.82 | 86.50 | 4.85 | 86.50 | 4.88 | 0.04 | 0.04 | 86.56 | 4.82 | 86.52 | 4.80 | 86.49 | 4.82 | 0.03 | 0.04 |
| 25 | 72.83 | 3.76 | 72.79 | 3.75 | 72.75 | 3.69 | 72.83 | 3.77 | 0.09 | 0.02 | 72.78 | 3.74 | 72.76 | 3.75 | 72.74 | 3.74 | 0.07 | 0.02 |
| Mean absolute measurement error | 0.05 | 0.07 | 0.05 | |||||||||||||||
| Mean percentage measurement error | 0.25 | 0.33 | 0.46 | |||||||||||||||
Stay updated, free dental videos. Join our Telegram channel
VIDEdental - Online dental courses


