Introduction
The aim of this study was to determine the accuracy of cone-beam computed tomography (CBCT) with different voxel resolutions. Measurements were made of the bony covering of the mandibular anterior teeth because this region is crucial in orthodontic treatment planning.
Methods
CBCT data at 2 resolutions (0.125-mm and 0.4-mm voxels) were collected from 8 intact cadaver heads. The vertical position of the mucogingival junction was clinically assessed. After removal of the gingiva, vertical and horizontal bony measurements were taken, and the buccal alveolar bone margin was determined. Anatomic bony measures were compared with the CBCT measures, and the correlation of the mucogingival junction measures to the buccal alveolar bone margin measures was evaluated.
Results
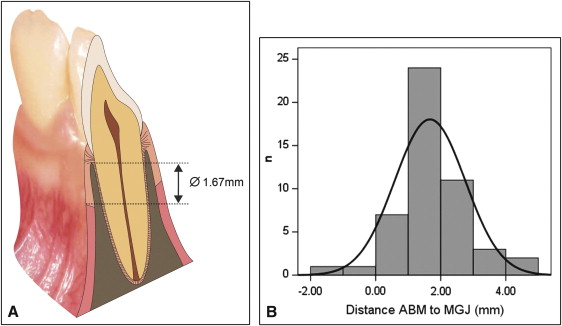
Bony measures obtained with CBCT were accurate and differed only slightly from the physical findings. The mean differences, ranging from −0.13 to +0.13 mm, were statistically not significant, but the limits of agreement showed discrepancies in the measurements as large as 2.10 mm, depending on measurement and resolution. Buccal alveolar bone margin measurements correlated with the mucogingival junction measurements ( P <0.001). On average, the mucogingival junction was 1.67 mm more apical than the buccal alveolar bone margin (CI 95%, 1.35-1.98 mm).
Conclusions
CBCT renders anatomic measures reliably and is an appropriate tool for linear measurements. Presence of soft tissue as well as different voxel size affect the precision of the data. A customized resolution protocol must be chosen according to the accuracy needed. However, even the 0.125-mm voxel protocol does not depict the thin buccal alveolar bone covering reliably, and there is a risk of overestimating fenestrations and dehiscences. The mucogingival junction appears to follow the buccal alveolar bone margin in a parallel line.
Cone-beam computed tomography (CBCT) has been used in the craniofacial region since 1998, and scientific contributions in orthodontics have been published since 2003. This new technology is attractive because of its high performance, low cost, and reduced radiation dose compared with conventional computed tomography. These advantages have led to a clearer definition of clinical applications of CBCT in implantology, oral and maxillofacial surgery, and orthodontics. However, as with every new development, CBCT data should be validated for their accuracy. Although the need to ascertain CBCT accuracy is not controversial, its accuracy has not been satisfactorily verified.
The first studies of CBCT accuracy in the oral and maxillofacial region appeared in 2004, and since then various attempts have been made to analyze the accuracy of these data based on the comparative measurements of physical objects. Every study made to ascertain the accuracy encounters the problem of what model to use to depict the anatomic truth reliably. Physical models, dry skulls, and mandibles immersed in solutions are common approaches to overcome this problem. These methodologies, however, do not accurately reflect clinical applications. The lack of soft tissues has been acknowledged to be a serious limitation in these studies, particularly since absence of soft tissues would likely facilitate the detection of bone surfaces. Use of cadaver heads would partly overcome this methodologic shortcoming.
An additional factor that could influence accuracy is the resolution of the obtained data volume. CBCT image data are acquired in digital format from a single 360° rotational scan. Image reconstruction from these projections is made by using an algorithm for volumetric tomography that renders the information into 3-dimensional images consisting of voxel elements. The size of each voxel is determined by its height, width, and thickness. Therefore, a study evaluating the accuracy should preferably also contain a comparison of different voxel settings, since the results depend not only on the examined object, but also on the inherent qualities of the acquired data. This way, the influence of both aspects can be juxtaposed.
The mandibular anterior incisors play an essential role in orthodontic treatment planning because of their restricted anatomic leeway in the symphysis. Hence, the assessment of the bony covering is pivotal when planning any tooth movement of the mandibular incisors, since it has been demonstrated that excessive sagittal movements or tipping can result in significant recession of the gingival margin and in bony dehiscences. Although some investigators found no association between orthodontic tooth movement and gingival recessions, it is commonly agreed that an especially narrow symphysis is an etiologic factor in the development of fenestrations and dehiscences. It is therefore important to investigate the possible limitations of CBCT data beyond the actual voxel sizes and to evaluate the clinical relevance of the obtained information about the bony covering.
The aims of this study were threefold: (1) to validate the accuracy of linear measurements of CBCT on intact cadaver heads, (2) to compare different voxel size settings and their impacts on the achieved accuracy, and (3) to examine the clinical relevance of the acquired data.
To validate the accuracy of the radiologic measures, the following statistical hypothesis was tested: there is no difference between the clinical and radiologic measurements.
Material and methods
Eight intact human cadaver heads (5 women, 3 men; age range, 65-95 years) with complete canine-to-canine dentitions in the mandibular front were supplied by the Anatomical Institute of the University of Zurich in accordance with state and federal regulations (voluntary body donation program on the basis of informed consent), the Convention on Human Rights and Medicine, and the recommendation of the Swiss Academy of Medical Science. Perfusion was carried out within 4 days after death with a fixation liquid consisting of the following formula: 2 parts alcohol (70%), 1 part glycerine, and 2% almudor (containing 8.10% formaldehyde, 10% glyoxal, and 3.70% glutaraldehyde). No specimen had an inflammation or recessions in the mandibular front.
Two CBCT scans (KaVo 3D eXam, KaVo Dental AG, Brugg, Switzerland) with different settings were performed on each head: high resolution (0.125-mm voxel) and low resolution (0.4-mm voxel) at 120 kV and 5mA. The radiologic measurements were made with a postprocessing software tool for DICOM data (eXam Vision software, Imaging Sciences International, Hatfield, Pa). All images were reconstructed by using multiplanar reformatting perpendicular to the curvature of the dentition, thereby enabling the depiction of every tooth in its buccolingual profile ( Fig 1 , A and B ).
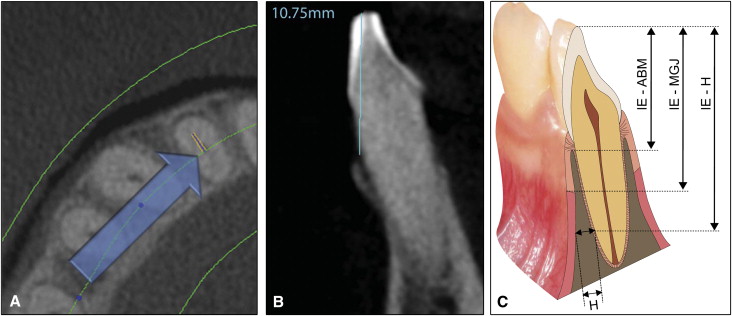
The radiologic measures were analogous to the clinical examination of the vertical (incisal edge-buccal alveolar bone margin) and horizontal bony measures, as shown in Figure 1 , C . All measurements were taken twice by the same observer (R.P.), at least a week apart.
The clinical examination consisted of 3 measurements ( Fig 1 , C ).
- 1.
Soft-tissue measurement (incisal edge-mucogingival junction; IE-MGJ): the width of the attached gingiva was determined for all mandibular front teeth. The most basal point of the undulated mucogingival junction was used to evaluate the distance to the incisal edge (canine to canine, n = 48). The attached gingiva was stained with Schiller solution as described by Fasske and Morgenroth (iodide pure: potassium-iodide: distilled water = 10:20:300) to facilitate locating the junction.
- 2.
Vertical bony measurement (incisal edge-buccal alveolar bone margin; IE-ABM): after the gingiva was removed, the distance from the buccal alveolar bone margin to the incisal edge was determined for every tooth (canine to canine, n = 48). Since the bone margin is not a horizontal line but lunar shaped, the most apical point was chosen.
- 3.
Horizontal bony measurement (H): a thin slat of the alveolar bone was removed with a scalpel. The thickness of the alveolar bone covering was measured at a distance of 15 mm (n = 48) from the incisal edge (incisal edge-horizontal). Occasionally, a second site was chosen at 18 mm (n = 13) from the incisal edge to increase the total measurements taken (n = 61).
Two electronic digital calipers were used for the clinical measures (accuracy of 0.01 mm): a customary caliper for measuring the length and the other especially designed for depth measurement. All clinical measures were repeated on different occasions and the mean value was used.
Statistical analysis
Two standard statistical software packages (version 17; SPSS, Chicago, Ill; and version 11.4.1.0; MedCalc, Mariakerke, Belgium) were used for data analysis. To determine intraobserver reliability, the intraclass correlation coefficient for absolute agreement based on a 1-way random-effects analysis of variance (ANOVA) was calculated for the repeated radiologic measurements from the same observer for all 4 protocols (low and high resolutions, vertical and horizontal measures).
Descriptive statistics for the clinical measurements and for the differences between the radiologic and clinical measures for each category were computed separately. In addition, the 95% CI was calculated, and the absolute measurement error (AME) was determined according to the following equation:
AME = | radiological measurement – clinical measurement |
To disclose deterministic differences between both methods of measurement, a 1-sample Student t test was applied to the differences. Moreover, the Bland-Altman method was applied, and the limits of agreement were identified. The Levene test was used to detect an increase of variability of the differences with the increase of the magnitude of the measurements. The Pearson correlation coefficient was computed to evaluate the association of soft-tissue measures to bony measures. In addition, the regression plot between soft-tissue measures to bony measures together with the 95% prediction interval was provided. The assumption of normality for the differences of soft to bony tissues was investigated by the Kolmogorov-Smirnov test. The results of the statistical analysis with P values smaller than 5% were considered to be statistically significant.
Results
The intraclass correlation coefficient showed good repeatability of the radiologic measures. The values for all 4 protocols ranged between 0.90 and 0.99 as illustrated in Table I . The results of the descriptive statistics for the clinical measurements are provided in Table II .
| ICC | Low resolution | High resolution |
|---|---|---|
| Vertical measurements | 0.96 | 0.99 |
| Horizontal measurements | 0.90 | 0.95 |
| Clinical measurements | Mean (mm) | Median (mm) | SD (mm) | 95% CI (mm) |
|---|---|---|---|---|
| Vertical (n = 48) | 12.13 | 11.93 | 1.58 | (11.67-12.58) |
| Horizontal (n = 61) | 1.02 | 0.82 | 0.77 | (0.82-1.22) |
| Distance ABM-MGJ (n = 48) | 1.67 | 1.78 | 1.08 | (1.36-1.98) |
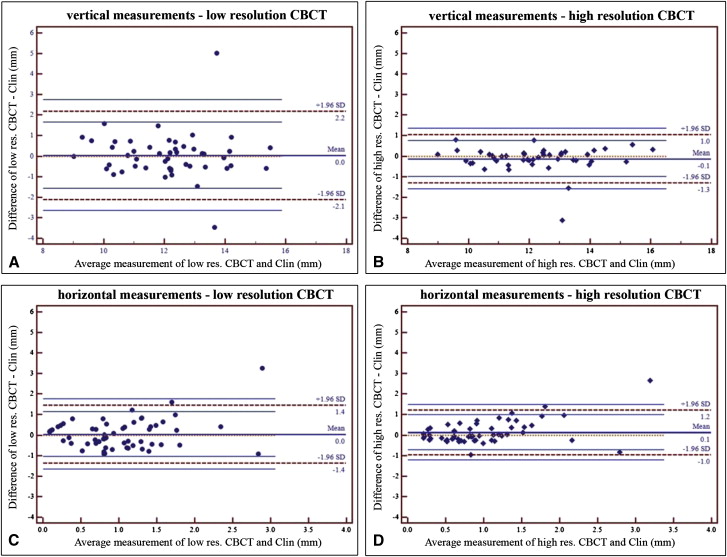
The accuracy of the scans proved to be acceptable for both the high-resolution and low-resolution protocols. The absolute measurement errors for all 4 protocols are given in Table III . The descriptive statistics for the differences of the measurements and the 1-sample Student t test are shown in Table IV . The mean difference between the clinical and radiologic measures were for all protocols close to 0 and ranged between −0.13 and +0.13 mm; 0 was within the 95% CI bounds, confirming no systematic bias in all 4 radiologic readings. The 1-sample t test showed no significant differences between the physical and the radiologic measures; consequently, the statistical hypothesis could not be rejected.
| Absolute errors | Mean (mm) | Median (mm) | SD (mm) | 99% CI (mm) |
|---|---|---|---|---|
| Vertical, low resolution (n = 48) | 0.70 | 0.53 | 0.84 | (0.37-1.02) |
| Vertical, high resolution (n = 48) | 0.34 | 0.21 | 0.50 | (0.14-0.54) |
| Horizontal, low resolution (n = 61) | 0.54 | 0.42 | 0.46 | (0.38-0.69) |
| Horizontal, high resolution (n = 61) | 0.37 | 0.25 | 0.43 | (0.22-0.52) |
| Differences CBCT-Clin | P value | Mean difference (mm) | SD (mm) | Range (mm) | 95% CI (mm) | Limits of agreement (mm) |
|---|---|---|---|---|---|---|
| Vertical, low resolution (n = 48) | 0.79 | 0.04 | 1.09 | 8.48 | (−0.27-0.35) | (−2.1-2.2) |
| Vertical, high resolution (n = 48) | 0.15 | −0.13 | 0.59 | 3.91 | (−0.30-0.05) | (−1.3-1.0) |
| Horizontal, low resolution (n = 61) | 0.63 | 0.04 | 0.71 | 4.18 | (−0.14-0.23) | (−1.4-1.4) |
| Horizontal, high resolution (n = 61) | 0.08 | 0.13 | 0.55 | 3.62 | (−0.02-0.28) | (−1.0-1.2) |
To validate the different measurements, the differences between the radiologic and clinical measurements were plotted against the average as recommended by Bland and Altman ( Fig 2 ). The limits of agreement were defined as ±1.96∗SD, and the 95% CI values for the limits of agreement were identified and are marked in the figures. The Levene test confirmed for the horizontal measurements an increase of the variability of the differences as the magnitude of the measurements increased ( P = 0.001) ( Fig 2 , C and D ). This indicates that for small horizontal measurements the differences were smaller than for large horizontal measurements.
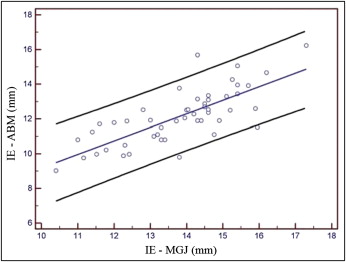
The Pearson correlation coefficient (0.756, P <0.001) between 2 distances (incisal edge-buccal alveolar bone margin and incisal edge-mucogingival junction; n = 48) proved to be moderate, but highly significant. The regression plot between both distances together with the 95% prediction interval is given in Figure 3 . The distance from the alveolar bone margin to the mucogingival junction seemed to follow a nearly ideal normal distribution ( P = 0.194) around the mean value of 1.67 mm (SD, 1.08; 95% CI, 1.35-1.98) ( Fig 4 ).
Stay updated, free dental videos. Join our Telegram channel
VIDEdental - Online dental courses


