Composition and Phase Diagrams
Pure materials are infrequently used in dentistry because they rarely offer the properties required. Mixtures of two or more substances are therefore generally encountered. It is necessary therefore to be able to relate properties to composition in terms of the mixtures. This would lead to difficulties of data management if only the enumeration of all relevant properties for all possible mixtures of all relevant substances were attempted. Means must be found to reduce the scale of the problem and facilitate exploration and comprehension of the effects of the mixtures.
The first concern is to make a map of the range of compositions available for a given set of ingredients. This can be done on an elementary geometrical basis on a line for two ingredients and in a triangle for three. The meanings of terms such as state, phase and component must be established.
Whenever a reaction is involved, it is necessary to enquire what the equilibrium condition is towards which the system tends to move, that is, we enquire about its thermodynamics. This is also true when we deal with systems such as alloys, where chemical reactions in the normal sense do not occur, and for changes of state as in melting and freezing.
There are two separate ways of describing the conditions which hold at equilibrium. The first is the thermodynamic, in the sense of no further reduction of overall energy being possible, reference being made to the chemical potential of each component. The second is a direct consequence of that thermodynamic statement, that is, the actual compositions of each phase and the environmental variables such temperature and pressure which are needed to make a complete observational physical description. This leads directly to the Phase Rule and the ability to read and interpret constitutional diagrams, to make predictions of behaviour which would arise from changes of composition, conditions or processing, and to understand the properties and reactions of systems as diverse as dental cements, amalgam, cermets and casting alloys.
It is only rarely that pure materials, a single element or compound, will be of interest in practical applications for engineering and related purposes such as in dentistry, where only pure gold (19§1.1, 28§4), platinum (25§4.7, 25§6.3), silver (or nearly so) (11§5.1, 28§9) tin (7§13) and titanium (28§1) have specific uses in that form. Much more often than not, the desired properties cannot be found in a pure substance, and mixtures of one kind or another must be used. This leads to the question of organizing the information on the properties of all investigated mixtures. Certainly, it is feasible merely to tabulate data for many mixtures, but the sheer volume of data needed for practical work would become overwhelming. It would be extremely difficult, if not impossible, to digest such a mass of data. More importantly, it is usually impossible to extrapolate or interpolate such data as it stands to find values for unlisted compositions or conditions, and generally obtain an appreciation of what is going on in a system. We are led inevitably to seeking graphical methods of understanding and communicating composition-dependent data, and in particular to graphical methods for handling the thermodynamic data of the equilibria and equilibrium descriptions of multicomponent, multiphase systems. The concise manner in which such data is then presented makes phase diagrams indispensable tools in such studies and, as will be shown in the next chapter, capable of providing new insights otherwise inaccessible.
§1 Plotting Composition
In displaying data graphically in terms of the composition of a mixture, whether expressed by mass, volume or molecular proportions, the key problem is representing that composition. It may appear to be self-evident, but there are implications that require some consideration and it is worth being systematic. Obviously, a pure substance can only be represented as a single point (Fig. 1.1) as it is defined to have no possible variation. Also, any property can only have a single value under given conditions and so needs no graphical representation.
•1.1 Two components
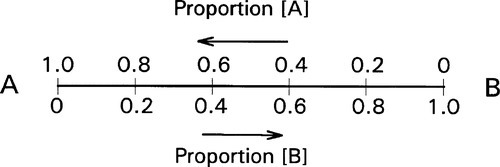
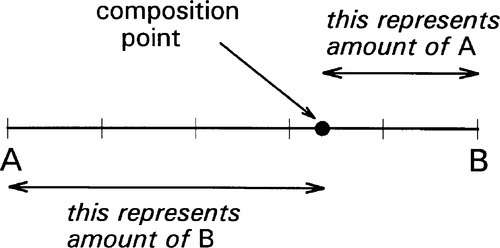
If we now consider two different substances, we have to be able to represent all possible mixtures. This is done on a composition line (Fig. 1.2). Between two points representing the pure substances (as in Fig. 1.1) a line is drawn and divided, the divisions being taken as representing the proportions of the two amounts of substance, measured in any convenient units, such as mass, volume, or molarity, for example. Thus, the amount of A is determined by the relative distance towards the 100% A point, that is, measured from the 100% B point, where by definition there is 0% A. The amount of B is determined in a complementary fashion (Fig. 1.3) since necessarily
< ?xml:namespace prefix = "mml" ns = "http://www.w3.org/1998/Math/MathML" />
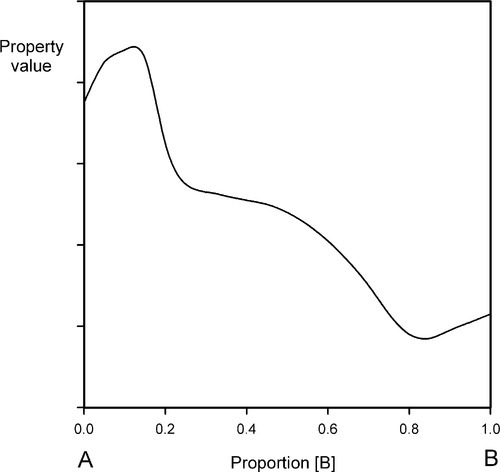
It now becomes feasible to represent variation in some property, such as strength or density, as ordinates raised on this composition line as abscissa (Fig. 1.4). This then is an extension of a familiar kind of graph (e.g. Fig. 2§8.3) and has already been used to express the behaviour of composite structures (e.g. Fig. 6§2.10).
•1.2 Three components
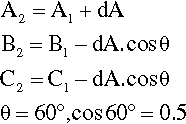
Depicting the composition of a mixture of three components is only slightly more difficult. The sum of the perpendicular distances of a point within an equilateral triangle to the three sides is a constant. That this is so is readily shown. In Fig. 1.5, point 1 is distant from the three sides by amounts of A1, B1 and C1 respectively. If A1 is increased to A2, then B2 and C2 are smaller than B1 and C1 respectively, shown by point 2. Then,
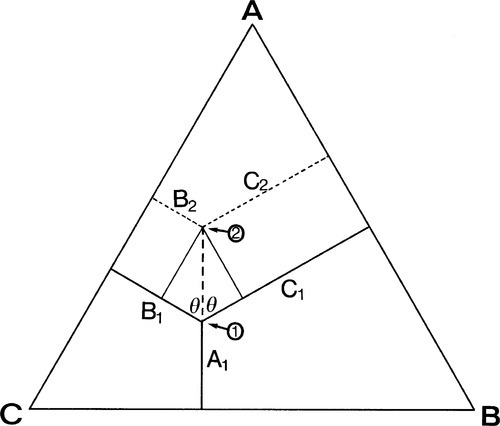
Hence A2 + B2 + C2 = A1 + B1 + C1 = the height of the triangle.
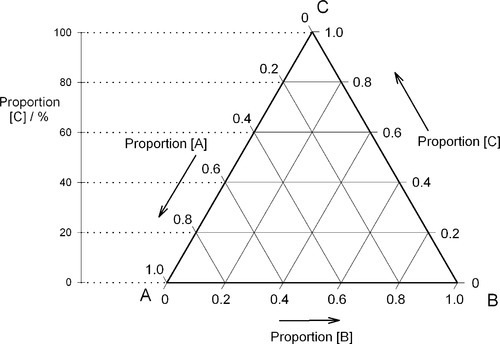
If, then, the height of the triangle is taken as unity or 100%, and the vertices of the triangle represent the pure components, the distances from the opposite sides may represent the proportions of these components in any mixture (Figs 1.6, 1.7). A grid may be drawn in such a triangle to facilitate reading the composition represented by a point. From this it can be seen that each side of the triangle is in fact a composition line for the components represented at its ends. In other words, the edges of the triangle represent all compositions in which the amount of the third component is zero. The relationship of the proportion scale on the triangle sides to the height may be seen from the extra scale shown on the left in Fig. 1.6. Similarly, ‘height’ scales could be drawn for the other two components.
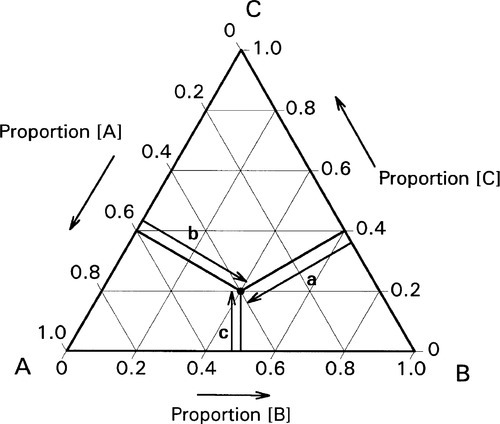
The equilateral triangle on which the above is based is in fact only a special case, chosen for its convenience. It will be noted that the actual size of the triangle is obviously irrelevant. Thus, universally, the proportion of a component in the mixture is represented as the proportion of the distance from any point on the edge opposite the apex for that component, to that apex, along a straight line. This is therefore true for any size triangle. It is also true for any shape of triangle: the sum of the proportions is constant, i.e. unity (Fig. 1.8).
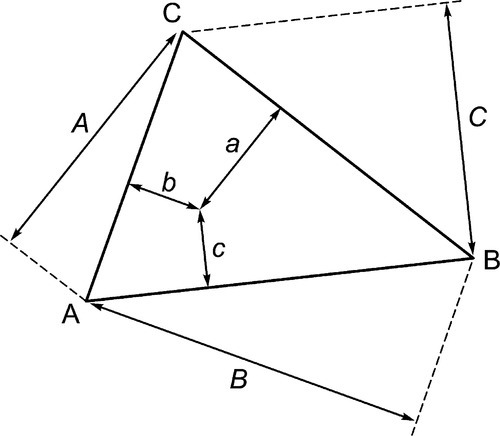
Of course, orientation is of no concern. This means that it is always possible to calculate the proportions of components represented at the apices at any point in an arbitrary triangle (Fig. 1.9). This becomes important when looking at sub-regions in a composition diagram.
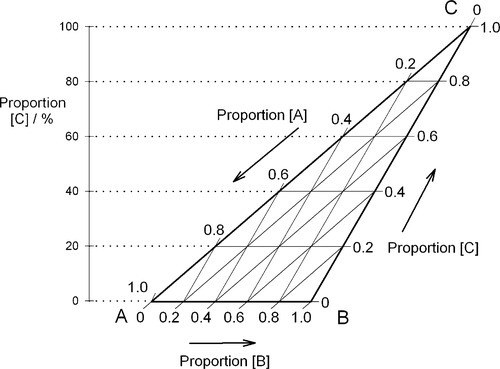
Clearly, if any property of a three-component mixture were to be plotted as a function of composition over the whole range, the ordinate would be perpendicular to the plane of the triangle to give a three-dimensional graph like a prism (see for examples Figs 14§3.7 and 19§1.10).
•1.3 Four components
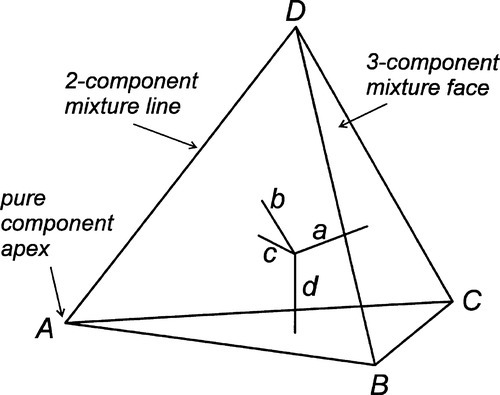
The same principles can be applied to a system of four components: within a regular tetrahedron whose apices represent the pure components, the perpendicular distances from the faces again sum to a constant, and may be used to represent the proportions (Fig. 1.10). There are clearly difficulties with drawing this type of diagram, and evidently any property needs to be plotted in an axis orthogonal, i.e. at right angles, to the tetrahedron, impossible without resorting to a fourth spatial dimension (to which, of course, we have no access). In this case, various sections through the tetrahedron have to be used to suit each region of interest, plotting a triangular prism as before.
Mixtures of more than four components present similar but more formidable difficulties, although the formal geometry for such systems is known and straightforward (just hard to visualize). Nevertheless, we have established that for the simpler systems compositions may be plotted according to some elementary geometrical rules, and this will facilitate the later discussion of a number of systems of immediate relevance to dentistry.
Referring again to Fig. 1.6, it was pointed out that the edges of the triangle are composition lines of the type shown in Fig. 1.2, that is, for mixtures of two components. Similarly, the apices are really as in Fig. 1.1. Likewise, each face of the tetrahedron of Fig. 1.10 is a triangle as in Fig. 1.6, and each edge as in Fig. 1.2, and so on.
•1.4 Special cases
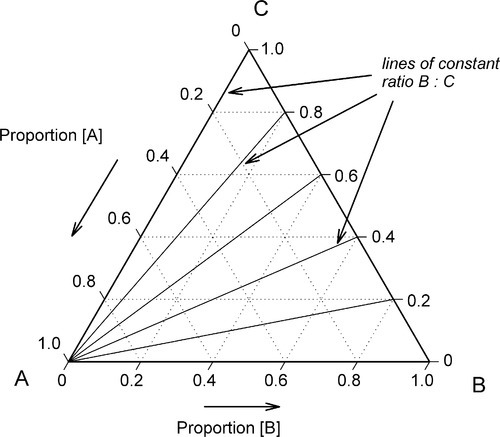
These diagrams also have other properties of interest. Again in Fig. 1.6, a line from an apex, say A, to cut anywhere on line BC represents a series of mixtures of constant ratio of B : C for varying A (Fig. 1.11). Such a line is called an isopleth, i.e. this is the locus of all points satisfying B : C = constant. Likewise, any line parallel to BC represents constant A and varying ratio B : C. Similar arguments apply to sections through tetrahedral composition diagrams.
Furthermore, a line drawn between any two points in a 3- or more component diagram is itself a composition line for the mixture of the mixtures represented by the end points. That is, one can discuss the outcome of mixing two complicated liquids, say, milk and sea water, in the same terms.
So far, all that these diagrams have achieved is a means of plotting an overall composition for a mixture, or of a property’s value as a function of overall composition. There is no indication yet as to the condition of the mixture, its structure, or the compounds present. Further information is required, but it is a strength of such a diagram that this extra information can be plotted in it simply, a mere map.
§2 States and Phases
There are three states of matter encountered at ordinary temperatures and pressures: solid, liquid and gaseous. Gases tend to expand to fill completely the available space and have no bounding surface except by virtue of being adjacent to another type of phase. This means that two identifiably different gas phases cannot exist adjacent to each other – all gases are freely miscible (in the absence of reaction). Liquids take the shape of their container under gravity and show a sharp boundary at the free surface, i.e. adjacent to a gaseous phase. Sharp boundaries between immiscible liquids can also be seen, for example mercury, oil and water together. Solids have a very definite shape with sharp boundaries. Evidently, such boundaries can be maintained between solids of different kinds. Liquids and solids are known as condensed states, because the component atoms or molecules are closely approximated.
Judging from common experience, all three states can exist together for a given material. For example, water as the solid ice, the liquid itself and its vapour may be in contact, although the ice may be melting, or the liquid evaporating or freezing, depending on conditions. Chemically, the three are indistinguishable, but clear sharp boundaries exist between them. These boundaries represent the transition between the differing structures of the regions in the different states, even though (for a pure substance) the composition is the same in all three. No difficulty of identification occurs for changes in subdivision: raindrops are still liquid, snowflakes are still solid. Nor is there a problem of scale: the states maintain their identities down to the molecular level.
•2.1 Environmental variables
In general, for a single pure substance, we may examine the states present as a function of temperature and pressure (Fig. 2.1), when the relative amounts of material in the various states are stable for fixed conditions. Each point in such a graph, which is called a P–T diagram, represents the description of the system at equilibrium. The effect of any change in these environmental variables can be readily mapped. For example, for any given temperature, the condensation of the vapour to liquid, or its deposition as solid, as the pressure is increased can be noted.
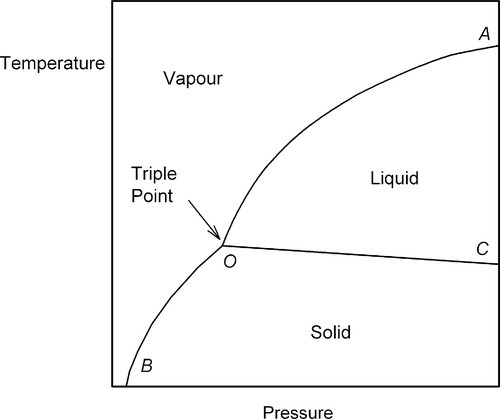
However, it is not a question simply of either one phase or the other everywhere. There are conditions where more than one phase can coexist at equilibrium. Thus, the line OA represents the equilibrium coexistence of liquid and vapour, OB of solid and vapour, OC of liquid and solid, while the point O – known as the triple point – represents the only conditions of temperature and pressure under which solid, liquid and vapour may coexist at equilibrium. In the regions marked out by those lines, but not actually on the lines, there can be only one state of matter represented at equilibrium.
•2.2 Kinetic limitation
This brings out an important point which is relevant in many circumstances in dental materials, especially where there is some chemical or physical process in operation: what may be observed may not be (indeed, usually is not) an equilibrium condition. That is to say, by equilibrium is meant the lowest energy state available to the system, the thermodynamic end-point of the process. Thus, in the ‘common experience’ example above, of ice, water and vapour, observation of coexistence does not necessarily imply equilibrium. Rather, kinetic limitations of diffusion, heat flow, or the availability of the activation energy for a process may limit the approach to equilibrium, or even prevent it altogether. This should always be borne in mind. Thermodynamic considerations provide the driving force for a process, kinetics controls the rate of approach to the end-point. Nevertheless, we shall nearly always approach a mixture problem first from the point of view of equilibrium, and then consider the kinetic aspects, for in order to understand the process (whether it be a setting reaction or some other behaviour) we must first understand where that process is going. The motivation now in this chapter is therefore the depiction of equilibrium systems.
•2.3 Definition of a phase
We need now to extend these ideas to systems containing more than one substance. To reiterate: gases mix perfectly and no boundary between any pair may exist, but between liquids such boundaries readily occur for many combinations such as oil and water. Again, subdivision and scale have no effect; there are evidently two distinct regions which are liquid but chemically identifiable. Equally, we may have two solids, such as the core and matrix of a filled resin restoration, in intimate contact, yet chemically and structurally distinct. Similarly, gas-liquid, liquid-solid, gas-solid and gas-liquid-solid systems may be envisaged where in addition to the state differences there are chemical differences. There is yet one more possibility: water ice, for example, goes through a series of different crystal structures (15, at the last count) as the pressure is greatly increased and the temperature is lowered. They are chemically identical, and certainly in the same state, they may yet be distinguished on the basis of structure alone. From that point of view, ice, liquid water and water vapour are distinguished by structure alone. We can summarize the state, chemical and structure distinction of each type of bounded region by referring to it as a phase of the system. All regions of the same description belong to the same phase, irrespective of shape, size, subdivision or separation.
We may define a phase as
any homogeneous and physically-distinct part of a system which is separated from other parts of the system by definite boundary surfaces.
bearing in mind that ‘physically-distinct’ means by virtue of state or other structural description. Note also that the existence of definite boundaries implies that, in principle at least, a mixture of phases are mechanically-separable without affecting the existence or stability of those phases (if the environmental conditions are preserved). Fig. 2.1 may therefore be called a phase equilibrium or constitutional diagram. The definite boundary surface is an important requirement. In contrast, for example, composition gradients within a single phase are perfectly reasonable. Consider a beaker of water into which some sodium chloride crystals were put, but without stirring. After a while the salt will have dissolved, but the concentration at the bottom will be very high while that at the top will be low. Despite variation in refractive index, density and other properties from top to bottom, no definite boundary exists along those gradients. If one were to contrive to arrange a layer of pure water on top of a concentrated salt solution, a boundary may appear to be present, but in reality it must have a substantial thickness, and diffusion on standing will blur and eventually eliminate it. Simple stirring will show immediately the complete miscibility of the two regions, and thereby demonstrate that the apparent boundary was not a phase boundary. Indeed, such a system will not have been at equilibrium until it had been well stirred.
It is the definition of a phase which allows us to recognize when we are dealing with composite structures (6§1.13), the implications of which are so far-reaching. It is by study of the conditions that control the number of phases, which phases are present, or the reactions between them, that the properties and handling of many materials can be understood.
•2.4 Calcium sulphate – water
As another example we may consider the system H2O – CaSO
Stay updated, free dental videos. Join our Telegram channel

VIDEdental - Online dental courses


