Numerical and Graphical Information Concerning Development of the Dentition
The information presented here is based mainly on data derived from investigations carried out in different countries of the western world on the Caucasian race. The information presented includes the following:
—formation and emergence of teeth
—initiation of calcification
—formation stages
—crown dimensions
—eruption speed
—emergence sequences
—occurrence of agenesis of teeth
—various jaw relations
In most instances, the type and the size of the material on which the investigation is based are incorporated in the tables. Occasionally, this information is supplied additionally.
The numerical and graphical information supplied here about different aspects of the development of the dentition forms a selection from a vast amount of data available in the literature. The selection was based mainly on the criterion of providing information that could support different aspects treated in the text. Another purpose was to present in a compact and easily retrievable way some data for which there is no sense in committing.
Dental Arch Dimensions
The data on transverse dental arch dimensions (Tables 17-9 through 17-12) and times of emergence of permanent teeth (Table 17-4) are based on material of the Nymegen Growth Study.81 A total of 486 boys and girls participated in this study and were followed longitudinally during a 5-year period. The ages were chosen to arrive at overlapping cohorts: from 4 to 9, from 7 to 12, and from 9 to 14 years of age. Every half year, the children were observed and data and material such as impressions of the dental arches were collected. The sample was representative for the population of Nymegen and included 25% Class II malocclusions. Because a large part of the sample exhibited orthodontic abnormalities, the data presented here are limited to transverse width dimensions. For more detailed information derived from the Nymegen Growth Study, and particularly regarding the transition of the anterior and posterior teeth, refer to the literature.4–6, 81, 104, 105, 110, 112–114
Table 17-1 Formation of teeth
| 6th week p.c.* | formation of the dental lamina |
| 8th – 12th week p.c. | I, II, III, IV, V** |
| 4th month p.c. | 6** |
| 5th – 6th month p.c. | 1, 2, 3 |
| 9th month p.c. | 4 |
| 9th month p.n.* | 5, 7 |
| 4th year | 8 (large variation) |
Derived from Stöckli, P.W. Postnataler Wachstumsverlauf, Kieferwachstum und Entwicklung der Dentition. In Zahnmedizin bei Kindern und Jugendlichen, ed. R.P. Hotz. Stuttgart: George Thieme Verlag, 1976.
Source: The data in Tables 17-1 and 17-2 are derived from Meyer, W., Lehrbuch der normalen Histologie und Entwicklungsgeschichte der Zähne des Menschen. München: J.F. Lehrmanns Verlag, 1932; Broadbent, B.H. Angle Orthod. 11(1941):223; Logan, W.H.G., and Kronfeld, R. J.Amer.Dent.Assn. 20(1933):379; Moorrees, C.F.A.; Fanning, E.A.; and Hunt, Jr., E.E. J.Dent.Res. 42(1963):1490, and Nolla, C.M. J.Dent.Child. 27(1960):254.
*p.c. = postconceptionem: after conception; p.n. = postnatal: after birth.
**Roman numerals apply to deciduous teeth; Arabic numerals to permanent teeth.
Table 17-2 Initiation of calcification
| 5th month p.c.* | I, II** |
| 6th month p.c. | IV, III |
| 7th month p.c. | V |
| 9th month p.c. | 6** |
| 6th month p.n.* | −1, +1, −2 |
| 12 months | 3 |
| 18 months | +2 |
| 2.5 years | 4 |
| 3 years | 5 |
| 3.5 years | 7 |
| 10 years | 8 (large variation) |
Derived from Stöckli, see Table 17-1.
Source: See Table 17-1.
*p.c. = postconceptionem: after conception; p.n. = postnatal: after birth.
**Roman numerals apply to deciduous teeth; Arabic numerals to permanent teeth.
+ = in the maxilla; − = in the mandible.
Table 17-3 Times of emergence of deciduous teeth
| 6 – 8 months | −I |
| 9 – 10 months | +I |
| 10 – 14 months | II |
| 14 – 18 months | IV |
| 18 – 24 months | III |
| 24 – 30 months | V |
Derived from Stöckli, P.W. Postnataler Wachstumsverlauf, Kieferwachstum und Entwicklung der Dentition. In Zahnmedizin bei Kindern und Jugendlichen, ed. R.P. Hotz. Stuttgart: George Thieme Verlag, 1976.
Source: Lysell, L.; Magnusson, B.; and Thilander, B. Odont. Revy 13(1962):217; Robinow, M.; Richards, T.W.; and Anderson, M. Growth 6(1942):127.
+ = in the maxilla; − = in the mandible.
Table 17-4 Calculated emergence times of permanent teeth
| Boys | Girls | |||||
| Age | Mean | SD | N | Mean | SD | N |
| Upper jaw | ||||||
| 1 | 7.20 | .80 | 166 | 6.94 | .73 | 224 |
| 2 | 8.22 | .88 | 166 | 7.97 | .96 | 222 |
| 3 | 11.16 | 1.68 | 172 | 10.89 | 1.16 | 250 |
| 4 | 10.27 | 1.38 | 172 | 10.20 | 1.32 | 250 |
| 5 | 10.96 | 1.36 | 172 | 10.88 | 1.52 | 249 |
| 6 | 6.06 | .92 | 161 | 6.10 | .64 | 210 |
| 7 | 11.87 | 1.08 | 172 | 11.35 | 2.22 | 250 |
| Lower jaw | ||||||
| 1 | 6.21 | .72 | 166 | 6.13 | .64 | 221 |
| 2 | 7.36 | .73 | 166 | 7.21 | .75 | 224 |
| 3 | 10.34 | 1.05 | 172 | 9.56 | .98 | 250 |
| 4 | 10.55 | 1.73 | 172 | 10.09 | 1.38 | 250 |
| 5 | 11.44 | 1.87 | 172 | 11.35 | 1.77 | 247 |
| 6 | 6.21 | .68 | 166 | 6.10 | .60 | 215 |
| 7 | 11.31 | 1.79 | 172 | 11.13 | 1.97 | 250 |
Derived from van der Linden, F.P.G.M.; Boersma, H.; and Prahl-Andersen, B. Development of the dentition. In A mixed-longitudinal interdisciplinary study of growth and development, eds. B. Prahl-Andersen, C.J. Kowalski, P.H.J. Heydendael. New York: Academic Press, 1979.
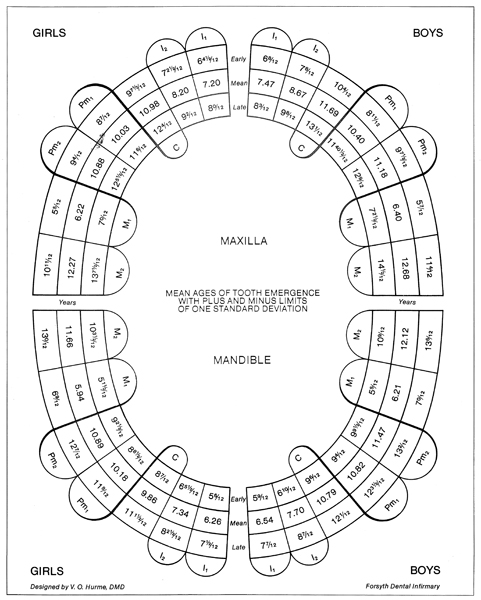
Fig. 17-1 Graphic illustration of early, mean, and late eruption ages for girls (left) and boys (right). Such an age range as depicted would include two-thirds of any sample. (Derived from Hurme, V.O. Ranges of normalcy in the eruption of permanent teeth. J. Dent. Child. 16(1949):11).
The data regarding certain changes in the intercanine distance (Tables 17-13 and 17-14), molar occlusion (Table 17-15), and overjet and overbite (Tables 17-16 and 17-17) are based on material from the University School Growth Study of The University of Michigan.72 In this sample, few and only mild malocclusions are included. Furthermore, these data are not only analyzed on a chronological scale, but also on the basis of biological developmental criteria. An advantage of the latter approach is that derivative values can be plotted against time scales based on certain characteristics of the development of the dentition. This approach has been introduced by Moorrees64 in the study of the development of the dentition. Some illustrations incorporated in this chapter (Figures 17-6 through 17-9) are derived from his classic work: The Dentition of the Growing Child.63 These illustrations clearly demonstrate the large variation in the changes of the intercanine distances. Not all dental arches become wider at the canine region during the transition of the incisors. This observation is in accordance with the large variations that exists in the spatial conditions of the dental arches. The material on which the figures of Moorrees are based also contain, few and only mild malocclusions.
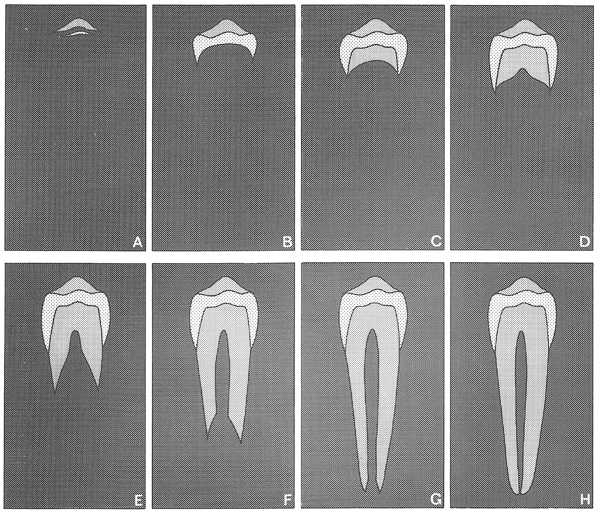
Fig. 17-2 Eight stages of tooth formation of the mandibular first premolar distinguished according to Demerjian et al. 1973.28 (Figure from Prahl-Andersen, B., and van der Linden, F.P.G.M.82)
![]()
Fig. 17-3 Eight stages of tooth formation of the mandibular first permanent molar, distinguished according to Demerjian et al. 1973.28 (Figure from Prahl-Andersen, B., and van der Linden, F.P.G.M.82)
![]()
Fig. 17-4 Estimation of the stages of formation of the mandibular deciduous teeth, presented on a time scale. For the stages of formation, refer to Figures 17-2 and 17-3. (Derived from Prahl-Andersen, B., and van der Linden, F.P.G.M.82)*. di = deciduous tooth e.g., di1 = mandibular and maxillary central deciduous incisors.
![]()
Fig. 17-5 Estimation of the formation stages of the mandibular permanent teeth, presented on a time scale. For the stages of formation, see Figures 17-2 and 17-3. (Derived from Prahl-Andersen, B., and van der Linden, F.P.G.M.82).*
Table 17-5 Mesiodistal crown dimensions
| Deciduous dentition | ||||||
| Tooth | N | Male mean mm | S.D. mm | N | Female mean mm | S.D.mm |
| Maxillary | ||||||
| central incisor | 166 | 6.41 | .43 | 169 | 6.48 | .43 |
| lateral incisor | 189 | 5.26 | .37 | 175 | 5.29 | .43 |
| canine | 212 | 6.76 | .34 | 194 | 6.63 | .35 |
| first molar | 214 | 6.74 | .49 | 195 | 6.61 | .49 |
| second molar | 213 | 8.84 | .53 | 196 | 8.74 | .47 |
| Mandibular | ||||||
| central incisor | 144 | 4.06 | .35 | 144 | 4.10 | .31 |
| lateral incisor | 182 | 4.64 | .43 | 171 | 4.68 | .40 |
| canine | 213 | 5.84 | .33 | 193 | 5.82 | .65 |
| first molar | 209 | 7.82 | .47 | 195 | 7.71 | .46 |
| second molar | 214 | 9.90 | .52 | 196 | 9.73 | .48 |
| Permanent dentition | ||||||
| Tooth | N | Male mean mm | S.D. mm | N | Female mean mm | S.D. mm |
| Maxillary | ||||||
| central incisor | 212 | 8.91 | .59 | 189 | 8.67 | .57 |
| lateral incisor | 201 | 6.88 | .64 | 172 | 6.78 | .64 |
| canine | 152 | 7.99 | .42 | 125 | 7.49 | .36 |
| first premolar | 157 | 6.76 | .47 | 122 | 6.60 | .46 |
| second premolar | 132 | 6.67 | .37 | 99 | 6.50 | .46 |
| first molar | 216 | 10.58 | .56 | 192 | 10.18 | .58 |
| second molar | 121 | 9.50 | .71 | 80 | 8.79 | .73 |
| Mandibular | ||||||
| central incisor | 214 | 5.54 | .32 | 196 | 5.46 | .34 |
| lateral incisor | 208 | 6.04 | .37 | 189 | 5.92 | .34 |
| canine | 170 | 6.96 | .40 | 148 | 6.58 | .34 |
| first premolar | 159 | 6.89 | .63 | 134 | 6.78 | .70 |
| second premolar | 132 | 7.22 | .47 | 100 | 7.07 | .46 |
| first molar | 215 | 10.71 | .60 | 191 | 10.29 | .74 |
| second molar | 115 | 9.98 | .67 | 92 | 9.50 | .59 |
Derived from Moyers, R. E.; van der Linden, F.P.G.M.; Riolo, M.L.; and McNamara, Jr., J.A. Standards of human occlusal development. Monograph No. 5., Craniofacial Growth Series. Center for Human Growth and Development. The University of Michigan, Ann Arbor, 1976.
Table 17-6 Correlations in emergence age of permanent mandibular teeth in females
| I2 | C | Pm1 | Pm2 | M1 | M2 | |
| I1 | .85 | .78 | .64 | .43 | .59 | .44 |
| I2 | .83 | .70 | .53 | .62 | .58 | |
| C | .78 | .59 | .56 | .58 | ||
| Pm1 | .65 | .55 | .58 | |||
| Pm2 | .48 | .64 | ||||
| M1 | .76 |
Derived from Moorrees, C.F.A., and Kent, R.L. Patterns of dental maturation. In The biology of occlusal development, ed. J.A. McNamara, Jr. Monograph No. 7., Craniofacial Growth Series. Center for Human Growth and Development. The University of Michigan, Ann Arbor, 1977.
Table 17-7 Correlation coefficients for mesiodistal crown diameters of deciduous and permanent teeth*
| Tooth | I1 | I2 | C | Pm1 | Pm2 | M1 | M2 |
| Maxilla | |||||||
| di1 | 0.63 | 0.36 | 0.35 | 0.33 | 0.31 | 0.40 | 0.28 |
| di2 | 0.32 | 0.31 | 0.29 | 0.27 | 0.22 | 0.19 | 0.25 |
| dc | 0.27 | 0.26 | 0.29 | 0.42 | 0.31 | 0.25 | 0.35 |
| dm1 | 0.34 | 0.25 | 0.35 | 0.34 | 0.41 | 0.36 | 0.45 |
| dm2 | 0.32 | 0.26 | 0.23 | 0.39 | 0.38 | 0.51 | 0.39 |
| Mandible | |||||||
| di1 | 0.43 | 0.41 | 0.32 | 0.24 | 0.29 | 0.28 | 0.26 |
| di2 | 0.42 | 0.44 | 0.39 | 0.15 | 0.24 | 0.35 | 0.32 |
| dc | 0.30 | 0.30 | 0.26 | 0.25 | 0.36 | 0.25 | 0.34 |
| dm1 | 0.29 | 0.38 | 0.44 | 0.47 | 0.51 | 0.45 | 0.42 |
| dm2 | 0.24 | 0.37 | 0.35 | 0.39 | 0.41 | 0.53 | 0.43 |
Derived from Moorrees, C.F.A., and Reeds, R.B. Correlations among crown diameters of human teeth. Arch. Oral Biol. 9(1964):685.
*The numbers of individuals studied ranged from 121 to 153, except for correlations involving the second permanent second molars (n = 68–72).
Table 17-8 Correlation coefficients for the mesiodistal crown diameters of corresponding groups of deciduous and permanent teeth
| Tooth groups | Males | Females | ||||
| r±S.E.r | Number | r±S.E.r | Number | |||
| Maxilla | ||||||
| di+di2 | I1+I2……. | +0.31±0.11 | 62 | +0.55±0.09 | 58 | |
| dc+dm1+dm2 | C+Pm1+Pm2.. | +0.45±0.10 | 62 | +0.55±0.09 | 58 | |
| Mandible | ||||||
| di1+di2 | I1+I2…… | +0.39±0.11 | 58 | +0.44±0.10 | 61 | |
| dc+dm1+dm2 | C+Pm1+Pm2.. | +0.57±0.09 | 58 | +0.59±0.08 | 61 | |
Derived from Moorrees, C.F.A., and Chadha, J.M. Crown diameters of corresponding tooth groups in the deciduous and permanent dentition. J.Dent.Res. 41(1962):466.
Stay updated, free dental videos. Join our Telegram channel
VIDEdental - Online dental courses


