Introduction
The aim of this study was to investigate the prevalence of tooth wear in adolescents with Class II malocclusion, compared with those with normal occlusion.
Methods
The sample consisted of dental casts obtained from 310 subjects, divided into 3 groups: group 1, 110 subjects with normal occlusion (mean age, 13.51 years); group 2, 100 complete Class II Division 1 patients (mean age, 13.44 years); and group 3, 100 half-cusp Class II Division 1 patients (mean age, 13.17 years). Dental wear was assessed by using a modified version of the tooth-wear index. The 3 groups were compared by means of the Kruskal-Wallis and Dunn tests, considering the frequency and the severity of wear on each surface of each group of teeth. The level of statistical significance was set at 5%.
Results
The normal occlusion group had statistically greater tooth wear on the palatal surfaces of the maxillary central incisors and the incisal surfaces of the maxillary canines than the corresponding surfaces in both Class II malocclusion groups. The complete and half-cusp Class II Division 1 malocclusion groups had statistically greater tooth wear on the occlusal surfaces of the maxillary second premolar and first molar, the occlusal surfaces of the mandibular premolars, and the buccal surfaces of the mandibular posterior teeth compared with the normal occlusion group. The half-cusp Class II Division 1 malocclusion group had significantly greater tooth wear on the incisal surfaces of the mandibular incisors compared with the complete Class II Division 1 malocclusion group.
Conclusions
Subjects with normal occlusion and complete or half-cusp Class II Division 1 malocclusions have different tooth-wear patterns. Tooth wear on the malocclusion subjects should not be considered pathologic but rather consequent to the different interocclusal tooth arrangement.
Because of decreasing dental caries in many societies, more attention has been focused on tooth wear from erosion, abrasion, and attrition. Tooth wear is the loss of mineralized tooth substance from the tooth surface as a result of physical or chemical attack.
Masticatory movements by cooperative interactions among various stomatognathic organs, their proprioceptors, and higher brain centers are closely related to the functional occlusal system. A change in any information related to occlusion, the temporomandibular joint, or the masticatory muscles affects the patterns of the chewing movements. Some researchers have argued that occlusion might influence the masticatory path ; this is supported by 1 investigation. Gradual attrition of the occlusal surfaces of the teeth appears to be a general physiologic phenomenon in all mammals, in every civilization, and at all ages. There are relatively few studies of tooth wear in the literature. This lack of detailed research is partly because of problems involved in measuring techniques.
Measurement of tooth wear is difficult because some wear is normal throughout life, and no single index has been universally accepted. Studies that aimed to analyze dental wear initially focused on clinical evaluation of the lesions, through estimation of their severity and then began to report the distribution of the lesions. Smith and Knight introduced the tooth-wear index (TWI), which attempted to provide a solution to some problems associated with measuring wear at the individual and community levels. The TWI and modified versions of it have been used in many studies; this suggests widespread acceptance. However, it was described as flawed when used in an aging population, because it does not take into account teeth that were restored due to wear.
Some studies indicate that masticatory forces and malocclusion are the primary etiologic factors for noncarious lesion development ; others did not find this correlation. Because of the high prevalence of malocclusions in children and the controversies in the literature, it is relevant to verify the pattern of tooth wear in different occlusal relationships to help professionals to differentiate between physiologic and pathologic processes. The absence of previous studies of tooth wear on specific malocclusions encouraged us to compare the patterns of tooth wear in subjects with complete and half-cusp Class II Division 1 malocclusions, and compare them with subjects with normal occlusion.
Material and methods
The study protocol was approved by the Ethics Committee on Human Research of Bauru Dental School, University of São Paulo, Brazil.
The sample consisted of dental casts obtained from 310 untreated subjects from the files of the Department of Orthodontics at Bauru Dental School, University of São Paulo, Bauru, Brazil, and from the Burlington Growth Centre, Faculty of Dentistry, University of Toronto, Toronto, Canada, divided into 3 groups: group 1 included 110 subjects with normal occlusion (54 girls, 56 boys; mean age, 13.51 years; minimum, 10.31 years; maximum, 17.53 years); group 2 included 100 complete Class II Division 1 patients (51 girls, 49 boys; mean age, 13.44 years; minimum, 11.08 years; maximum, 17.26 years); and group 3 included 100 half-cusp Class II Division 1 patients (56 girls, 44 boys; mean age, 13.17 years; minimum, 10.54 years; maximum, 16.88 years). The dental casts were obtained of subjects with permanent maxillary and mandibular teeth up to the first molars. Additional inclusion criteria included no parafunctional habits, and no temporomandibular joint and airway problems, ascertained from the subjects’ charts. Patients with open bite were not selected.
We used a modification of the TWI, described by Sales-Peres et al. The modifications matched the World Health Organization standard, thus allowing application of the index in broad epidemiologic surveys for both for deciduous and permanent dentitions. The modifications made calibration easier and resulted in greater reproducibility, because the modified TWI does not differentiate the depth of dentin involvement, as does the original TWI. In addition, the modified version includes a code for teeth that have been restored due to wear (code 4) and another code for teeth that cannot be assessed (code 9). The form sheet used to record the evaluations is shown in the Figure . The amount of permanent tooth wear was scored in numbers ( Table I ). A previously calibrated examiner (R.B.S.O.) performed the dental-cast evaluations.
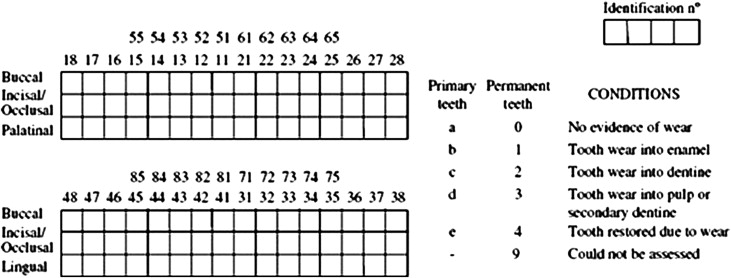
| Degree | Criterion | Description | |
|---|---|---|---|
| Deciduous teeth | Permanent teeth | ||
| A | 0 | Normal, no evidence of wear | No loss of surface features |
| B | 1 | Incipient, tooth wear into enamel | Loss of enamel giving a smooth, glazed, shiny appearance; dentin is not involved |
| C | 2 | Moderate, tooth wear into dentin | Extensive loss of enamel with dentin involvement; exposure of dentin |
| D | 3 | Severe, tooth wear into pulp | Extensive loss of enamel and dentin with secondary dentin or pulp exposure |
| E | 4 | Restored, tooth wear leading to restoration | Tooth received restorative treatment because of wear |
| — | 9 | Could not be assessed | Extensive caries, large restoration, fractured tooth, or missing tooth |
A benchmark dental examiner (gold standard) (S.H.C.S.), skilled in epidemiologic surveys, trained and calibrated the examiner. The calibration process lasted 28 hours. Theoretical activities with discussions on diagnostic criteria of dental wear were performed.
Statistical analyses
To assess the reproducibility of the dental-cast analysis, 30 days after the first evaluation, 10 casts were reevaluated and demonstrated an intraexaminer kappa of 0.80 ( Table II ).
| Tooth wear | Percentage of agreement (%) | Coefficient value | Strength of agreement |
|---|---|---|---|
| Dental casts | 92.85 | 0.80 | Almost perfect |
Tooth surfaces were excluded from the statistical analysis if they were missing, or had extensive caries, large restorations, or fractures (code 9). The amount of tooth wear in the groups was compared with the Kruskal-Wallis test followed by the Dunn post-hoc test. The 3 groups were compared by considering the frequency and severity of wear on each surface of each group of teeth (incisors, canines, premolars, and molars). The level of statistical significance was set at 5%.
Results
In total, 22,320 dental surfaces were evaluated; 73.9% did not have dental wear (code 0), 20.5% had incipient lesions (code 1), 0.3% had moderate lesions (code 2), and 5.3% were excluded (code 9). No severe lesions were found.
The normal occlusion group had statistically greater tooth wear on the palatal surfaces of the maxillary central incisors ( Table III ) and the incisal surfaces of the maxillary canines ( Table IV ) than the corresponding surfaces in both Class II malocclusion groups.
| Tooth † | Normal occlusion | Complete Class II Division 1 |
Half-cusp Class II Division 1 |
P value | |||
|---|---|---|---|---|---|---|---|
| Mean | SD | Mean | SD | Mean | SD | ||
| Inicisal surfaces | |||||||
| Maxillary teeth | |||||||
| 12 | 0.35 a | 0.50 | 0.28 a | 0.45 | 0.33 a | 0.47 | 0.5472 |
| 11 | 0.54 a | 0.50 | 0.49 a | 0.52 | 0.59 a | 0.53 | 0.4130 |
| 21 | 0.50 a | 0.52 | 0.48 a | 0.54 | 0.68 b | 0.51 | 0.0108 ∗ |
| 22 | 0.35 a | 0.48 | 0.36 a | 0.50 | 0.44 a | 0.50 | 0.2770 |
| Mandibular teeth | |||||||
| 42 | 0.83 a | 0.44 | 0.68 b | 0.47 | 0.83 a | 0.40 | 0.0333 ∗ |
| 41 | 0.91 a | 0.42 | 0.65 b | 0.50 | 0.86 a | 0.38 | 0.0003 ∗ |
| 31 | 0.85 a | 0.43 | 0.63 b | 0.49 | 0.90 a | 0.33 | 0.0000 ∗ |
| 32 | 0.69 a | 0.48 | 0.70 a | 0.48 | 0.89 b | 0.35 | 0.0018 ∗ |
| Palatal surfaces | |||||||
| Maxillary teeth | |||||||
| 12 | 0.26 a | 0.44 | 0.24 a | 0.43 | 0.23 a | 0.42 | 0.8595 |
| 11 | 0.37 a | 0.49 | 0.19 b | 0.39 | 0.24 ab | 0.43 | 0.0375 ∗ |
| 21 | 0.46 a | 0.50 | 0.19 b | 0.42 | 0.25 b | 0.44 | 0.0000 ∗ |
| 22 | 0.31 a | 0.46 | 0.15 a | 0.36 | 0.25 a | 0.43 | 0.0501 ∗ |
| Labial surfaces | |||||||
| Mandibular teeth | |||||||
| 42 | 0.05 a | 0.21 | 0.02 a | 0.14 | 0.01 a | 0.10 | 0.2399 |
| 41 | 0.02 a | 0.14 | 0.01 a | 0.10 | 0.04 a | 0.20 | 0.3454 |
| 31 | 0.04 a | 0.19 | 0.01 a | 0.10 | 0.01 a | 0.10 | 0.2598 |
| 32 | 0.03 a | 0.13 | 0.04 a | 0.20 | 0.04 a | 0.20 | 0.5657 |
| Tooth † | Normal occlusion | Complete Class II Division 1 |
Half-cusp Class II Division 1 |
P value | |||
|---|---|---|---|---|---|---|---|
| Mean | SD | Mean | SD | Mean | SD | ||
| Inicisal surfaces | |||||||
| Maxillary teeth | |||||||
| 13 | 0.58 a | 0.53 | 0.24 b | 0.43 | 0.39 b | 0.49 | 0.0000 ∗ |
| 23 | 0.67 a | 0.67 | 0.20 b | 0.40 | 0.37 b | 0.49 | 0.0000 ∗ |
| Mandibular teeth | |||||||
| 43 | 0.72 a | 0.58 | 0.68 a | 0.47 | 0.60 a | 0.55 | 0.2455 |
| 33 | 0.66 a | 0.56 | 0.70 a | 0.48 | 0.68 a | 0.53 | 0.8128 |
| Palatal surfaces | |||||||
| Maxillary teeth | |||||||
| 13 | 0.10 a | 0.30 | 0.08 a | 0.27 | 0.14 a | 0.34 | 0.4906 |
| 23 | 0.14 a | 0.35 | 0.12 a | 0.32 | 0.19 b | 0.40 | 0.3950 |
| Labial surfaces | |||||||
| Mandibular teeth | |||||||
| 43 | 0.08 a | 0.28 | 0.13 a | 0.34 | 0.13 a | 0.34 | 0.4550 |
| 33 | 0.03 a | 0.16 | 0.14 b | 0.35 | 0.07 ab | 0.26 | 0.0091 ∗ |
The complete and half-cusp Class II Division 1 malocclusion groups showed statistically greater wear on the occlusal surfaces of the maxillary second premolar and first molar, the occlusal surfaces of the mandibular premolars, and the buccal surfaces of the mandibular posterior teeth compared with the normal occlusion group ( Table V ). In addition, there was a tendency of greater tooth wear on the palatal surfaces of the maxillary first molars ( Table V ).
| Tooth † | Normal occlusion | Complete Class II Division 1 |
Half-cusp Class II Division 1 | P value | |||
|---|---|---|---|---|---|---|---|
| Mean | SD | Mean | SD | Mean | SD | ||
| Occlusal surfaces | |||||||
| Maxillary teeth | |||||||
| 16 | 0.74 a | 0.44 | 0.90 b | 0.35 | 0.91 b | 0.29 | 0.0001 ∗ |
| 15 | 0.13 a | 0.33 | 0.36 b | 0.48 | 0.29 b | 0.46 | 0.0003 ∗ |
| 14 | 0.40 a | 0.49 | 0.41 a | 0.50 | 0.47 a | 0.52 | 0.6091 |
| 24 | 0.42 a | 0.50 | 0.50 a | 0.50 | 0.45 a | 0.50 | 0.5226 |
| 25 | 0.17 a | 0.37 | 0.40 b | 0.49 | 0.33 b | 0.47 | 0.0006 ∗ |
| 26 | 0.79 a | 0.41 | 0.93 b | 0.28 | 0.88 ab | 0.33 | 0.0044 ∗ |
| Mandibular teeth | |||||||
| 46 | 0.82 a | 0.38 | 0.88 a | 0.34 | 0.93 a | 0.26 | 0.0986 |
| 45 | 0.13 a | 0.33 | 0.55 b | 0.50 | 0.30 c | 0.46 | 0.0000 ∗ |
| 44 | 0.30 a | 0.46 | 0.63 b | 0.49 | 0.48 b | 0.50 | 0.0000 ∗ |
| 34 | 0.29 a | 0.46 | 0.54 b | 0.50 | 0.45 b | 0.50 | 0.0007 ∗ |
| 35 | 0.14 a | 0.35 | 0.55 b | 0.52 | 0.15 a | 0.35 | 0.0000 ∗ |
| 36 | 0.89 a | 0.32 | 0.87 a | 0.37 | 0.92 a | 0.28 | 0.6115 |
| Palatal surfaces | |||||||
| Maxillary teeth | |||||||
| 16 | 0.00 a | 0.00 | 0.05 b | 0.22 | 0.01 ab | 0.10 | 0.0213 ∗ |
| 15 | 0.00 a | 0.00 | 0.00 a | 0.00 | 0.02 a | 0.14 | 0.1228 |
| 14 | 0.00 a | 0.00 | 0.01 a | 0.09 | 0.00 a | 0.00 | 0.3499 |
| 24 | 0.00 a | 0.00 | 0.03 b | 0.17 | 0.00 a | 0.00 | 0.0426 ∗ |
| 25 | 0.00 a | 0.00 | 0.00 a | 0.00 | 0.00 a | 0.00 | 1.0000 |
| 26 | 0.00 a | 0.00 | 0.07 b | 0.26 | 0.06 ab | 0.24 | 0.0214 ∗ |
| Buccal surfaces | |||||||
| Mandibular teeth | |||||||
| 46 | 0.07 a | 0.26 | 0.42 b | 0.50 | 0.24 c | 0.43 | 0.0000 ∗ |
| 45 | 0.00 a | 0.00 | 0.14 b | 0.35 | 0.10 b | 0.30 | 0.0004 ∗ |
| 44 | 0.02 a | 0.13 | 0.07 ab | 0.26 | 0.13 b | 0.34 | 0.0072 ∗ |
| 34 | 0.01 a | 0.10 | 0.14 b | 0.35 | 0.12 b | 0.33 | 0.0014 ∗ |
| 35 | 0.00 a | 0.00 | 0.12 b | 0.33 | 0.09 b | 0.29 | 0.0013 ∗ |
| 36 | 0.06 a | 0.25 | 0.34 b | 0.48 | 0.24 b | 0.43 | 0.0000 ∗ |
Stay updated, free dental videos. Join our Telegram channel
VIDEdental - Online dental courses


