Introduction
Rapid maxillary expansion (RME) is known to improve nasal airway ventilation. Recent evidence suggests that RME is an effective treatment for obstructive sleep apnea in children with maxillary constriction. However, the effect of RME on tongue posture and pharyngeal airway volume in children with nasal airway obstruction is not clear. In this study, we evaluated these effects using cone-beam computed tomography.
Methods
Twenty-eight treatment subjects (mean age 9.96 ± 1.21 years) who required RME treatment had cone-beam computed tomography images taken before and after RME. Twenty control subjects (mean age 9.68 ± 1.02 years) received regular orthodontic treatment. Nasal airway ventilation was analyzed by using computational fluid dynamics, and intraoral airway (the low tongue space between tongue and palate) and pharyngeal airway volumes were measured.
Results
Intraoral airway volume decreased significantly in the RME group from 1212.9 ± 1370.9 mm 3 before RME to 279.7 ± 472.0 mm 3 after RME. Nasal airway ventilation was significantly correlated with intraoral airway volume. The increase of pharyngeal airway volume in the control group (1226.3 ± 1782.5 mm 3 ) was only 41% that of the RME group (3015.4 ± 1297.6 mm 3 ).
Conclusions
In children with nasal obstruction, RME not only reduces nasal obstruction but also raises tongue posture and enlarges the pharyngeal airway.
Nasal breathing allows proper growth and development of the craniofacial complex. In contrast, nasal obstruction that leads to mouth breathing results in lower tongue posture (with greater intraoral airway volume) and a constricted and V-shaped maxillary dental arch.
Rapid maxillary expansion (RME) has been widely used by orthodontists to increase the maxillary transverse dimensions of young patients. Recent studies have suggested that RME also increases nasal width and volume. Therefore, RME is generally thought to diminish the resistance to nasal airflow. Gray investigated the medical results of RME in 310 patients and found that over 80% of them changed their breathing pattern from mouth breathing to nasal breathing. Furthermore, the efficacy of RME to treat obstructive sleep apnea syndrome (OSAS) in children has been reported. However, the mechanism behind the RME effect is not clear. OSAS in children has various causes. Our purpose was to clarify a mechanism by which RME improves the symptoms.
Upper airway obstruction has also been associated with low tongue posture; among its other effects, RME is thought to change tongue posture. Previously, cephalograms were used to evaluate tongue posture, but precise measurements of tongue posture with these methods are difficult because tongue forms differ among patients. Ozbek et al reported that RME in children with maxillary constriction, posterior crossbite, and no signs of respiratory disturbance resulted in higher tongue posture. This result indicates that low tongue posture, without respiratory disturbance, changes when intermolar width is expanded.
Zhao et al compared absolute and percentage changes in the retropalatal and retroglossal airways after RME treatment and found no significant difference between the treated and control groups. However, they did not control tongue position when the cone-beam computed tomography (CBCT) images were taken, and the nasal ventilation condition, which is thought to influence tongue posture, was not considered. Because tongue posture is an important anatomic factor that affects the shape and size of the oropharyngeal airway volume, the absence of control over tongue position when the CBCT images were taken limits the conclusions from their study.
Therefore, further detailed studies are necessary to determine how RME changes tongue posture or pharyngeal airway volume in children with nasal airway obstruction. Thus, we comprehensively evaluated the secondary effects of RME by analyzing nasal airway ventilation, tongue posture, and pharyngeal airway volume from the same CBCT data. The purpose of this study was to clarify the effect of RME on tongue posture and pharyngeal airway volume in children with nasal airway obstruction.
Material and methods
Records from 85 patients who visited a private orthodontic office in Himeji, Japan, to receive orthodontic treatment were screened for this longitudinal retrospective study. Because airway volume is influenced by head posture, craniocervical inclinations of all subjects were examined to ensure that their inclinations were between 90° and 105°. The criteria for selection included (1) Class II skeletal relationship, (2) no previous orthodontic treatment, (3) no craniofacial or growth abnormalities, and (4) no enlarged adenoids or tonsils. Forty-eight patients met these selection criteria.
CBCT data were taken before and after RME treatment (RME group) or at corresponding times but without RME treatment (control group). The RME group consisted of serial CBCT images of 28 subjects (13 boys, 15 girls) with mean ages before and after RME of 9.96 ± 1.21 and 11.23 ± 1.12 years, respectively. They required approximately 5 mm of maxillary expansion as part of their orthodontic treatment. No passive retention appliance was used before full orthodontic treatment. The mean treatment time with the RME appliance was 5.5 ± 1.0 months. The control group consisted of serial CBCT images of 20 subjects (8 boys, 12 girls) with no history of RME appliance treatment. Control CBCT images were taken at age 9.68 ± 1.02 years (corresponding to before RME) and at age 11.13 ± 1.31 years (corresponding to after RME). The control subjects were approximately matched by sex, age, and dentition with the RME subjects.
This study was reviewed and approved by the ethics committee of the Graduate School of Medical and Dental Sciences, Kagoshima University, Kagoshima, Japan.
Each subject was seated in a chair with his or her Frankfort horizontal plane parallel to the floor. Each subject was asked to hold his or her breath after the end of expiration, without swallowing, because the pharyngeal airway caliber when awake is smallest at this time. Breath holding at this moment provides a static pharyngeal airway size that can be recorded consistently in all CBCT scans, thereby reducing variations caused by changes in pharyngeal airway caliber during the respiratory cycle. This position is stable and has high reproducibility for measurement. A CBCT device (CB MercuRay; Hitachi Medical, Tokyo, Japan) was set to maximum 120 kV, maximum 15 mA, and exposure time of 9.6 seconds. Data were sent directly to a personal computer and stored in digital imaging and communications in medicine (DICOM) format.
We made morphologic evaluations of the airways (nasal, intraoral, and pharyngeal) ( Figs 1 and 2 ). Volume rendering software (INTAGE Volume Editor; CYBERNET, Tokyo, Japan) was used to create the 3-dimensional (3D) volume data of the airways. Because the airway is a void surrounded by hard and soft tissues, inversion of the 3D rendered image is required: ie, converting a negative value to a positive value and vice versa. Threshold segmentation was used to select the computed tomography units in the airway. The inverted air space has a significantly greater positive computed tomography unit than do the denser surrounding soft tissues. The distinct high-contrast border produces a clean segmentation of the airway. By modifying the threshold limits, an appropriate range defined the tissues of interest in the volume of interest for a particular scan. By using this concept, a threshold of computed tomography units was selected to isolate all empty spaces in the airway region. Subsequently, by using an appropriate smoothing algorithm with a moving average, the 3D model was converted to a smoothed model without losing the patient-specific character of the airway shape. The rendered volume data was in a 512 × 512 matrix with a voxel size of 0.377 mm.
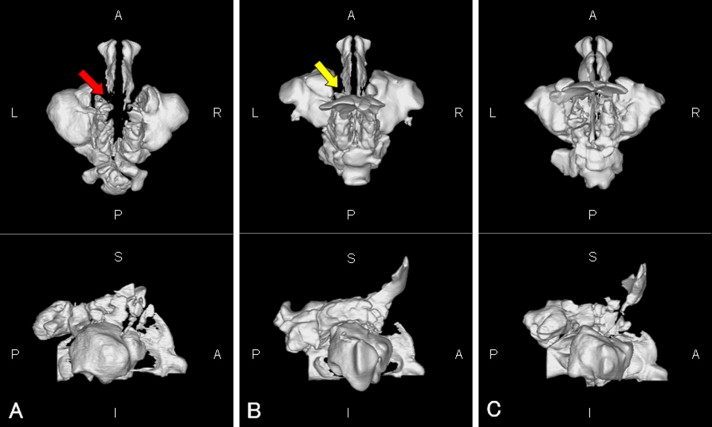
The nasal airway (from the external nares to the choanae, including the paranasal sinuses) is shown in Figure 1 . When the continuity of the bilateral nasal meatus was broken, a 3D obstruction was assumed ( Fig 1 , A ).
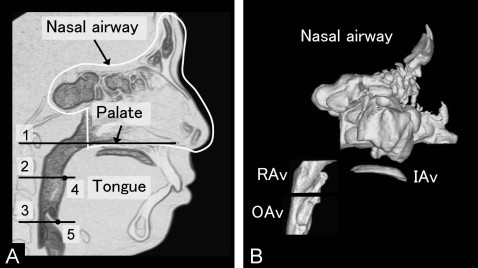
The intraoral and pharyngeal airways are shown in Figure 2 . Intraoral airway volume between the tongue and palate was measured as an indication of vertical tongue position. Pharyngeal airway volumes were also measured.
The cross-sectional planes ( Fig 2 ) included (1) the palatal plane, a plane parallel to the hard palate passing through the posterior nasal spine; (2) the soft palatal plane, a plane parallel to the palatal plane passing through the inferior-most point on the uvula; and (3) the base of the epiglottis plane, a plane parallel to the palatal plane passing through the base of the epiglottis.
The following pharyngeal airway volumes ( Fig 2 ) were measured: (1) total pharyngeal airway volume, the airway between the palatal plane and the epiglottis plane; (2) retropalatal airway volume, the airway between the palatal plane and the soft palatal plane; and (3) oropharyngeal airway volume, the airway between the soft palatal plane and the epiglottis plane.
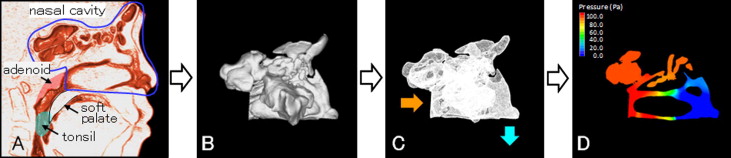
We then evaluated nasal airway ventilation conditions. Computed fluid dynamics were used to determine the presence of any functional obstruction of the nasal airway ( Fig 3 ). This method has been shown to provide a more accurate estimate of any obstruction than CBCT images alone. The constructed 3D images for the nasal airway were exported to fluid-dynamic software (PHOENICS; CHAM-Japan, Tokyo, Japan) in stereolithographic format. This software can simulate and evaluate various kinds of computed fluid dynamics under a set of given conditions. The simulation estimated airflow pressure and velocity.
In our simulation, air flowed from the choana horizontally, and air was exhaled through both nostrils. The flow was assumed to be a newtonian, homogeneous, and incompressible fluid. Elliptic-staggered equations and the continuity equation were used in the study. The computed fluid dynamics of the nasal airway were used under the following conditions with PHOENICS: (1) the volume of airflow with a velocity of 200 m per second, which is the rate of respiration of a subject of this age at rest ; (2) the wall surface was nonslip; and (3) the simulation was repeated 1000 times to calculate the mean values. Convergence was judged by monitoring the magnitude of the absolute residual sources of mass and momentum, normalized by the respective inlet fluxes. The iteration was continued until all residuals fell below 0.2%.
When the 3D CBCT reconstructions indicated nasal airway obstruction, computed fluid dynamics was not used. When computed fluid dynamics indicated a maximal pressure of more than 100 Pa (with an inflow rate of 200 mL/sec) and a maximum velocity of more than 10 m per second, an obstruction was assumed.
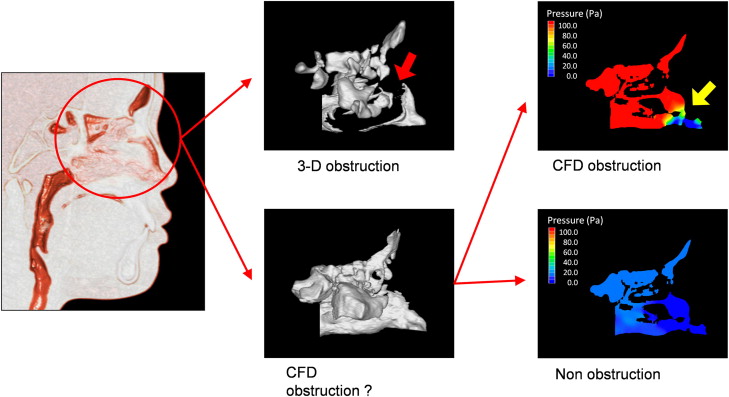
In 1 analysis, the RME subjects were divided into 2 groups by their nasal airway condition before and after RME: (1) the obstruction group included patients in whom a nasal obstruction was detected with the 3D images or the computed fluid dynamics evaluation, and (2) the nonobstruction group included patients in whom no nasal obstruction was found with either method ( Fig 4 ).
In a separate analysis, the RME subjects were classified into 3 groups by the changing pattern of their nasal airway obstruction after RME: (1) the nonimprovement group, with nasal airway obstructions both before and after RME; (2) the improvement group, with nasal airway obstruction before RME but not after RME; and (3) the ventilation group, with no nasal airway obstruction before or after RME.
Statistical analysis
The significance of treatment changes (before and after RME) of all variables (airway volume, nasal ventilation, pressure, and velocity) was determined with the paired t test. When a variable had a nonnormal distribution of data or differing variances, the significance of the treatment changes was determined with the nonparametric Wilcoxon rank test. Comparisons between groups at each time interval were made with the Student t test. All variables compared with this test had normal distributions and similar variances. When a variable had a nonnormal distribution of data or differing variances, the group comparison was made with the nonparametric Mann-Whitney U test. Spearman correlation coefficients were calculated to evaluate the relationships among nasal airway ventilation conditions, intraoral airway volumes, and pharyngeal airway volumes. One-way analysis of variance (ANOVA) and the post-hoc Bonferroni test were used to compare the 3 groups (nonimprovement, improvement, and ventilation). Statistical significance was set at P <0.05.
To assess the measurement error of the airway volume, 10 randomly selected computed tomography images from the 96 had the 3D rendering of the airway measured twice with the manual method by the same operator (T.I.) within 1 week. The differences between paired linear measurements were calculated, and Dahlberg’s error (double determination method) was computed. The errors for airway volume were 83.72 mm 3 for intraoral airway volume, 103.53 mm 3 for total pharyngeal airway volume, 75.36 mm 3 for retropalatal airway volume, and 62.31 mm 3 for oropharyngeal airway volume. Intraclass correlations were used to calculate the reliability between the first and second measurements. The values ranged from 0.965 to 0.998 ( P <0.001; df = 8). According to all repeated analyses, the method errors were considered negligible.
Results
After RME, the intraoral airway volume decreased significantly in the RME group ( Table I ), whereas total pharyngeal airway volume, retropalatal airway volume, and oropharyngeal airway volume all increased significantly in the RME group. In the control group, total pharyngeal and oropharyngeal airway volumes both increased significantly from before to after RME. However, intraoral and retropalatal airway volumes did not change significantly. The intraoral airway volume of the RME group (1212.9 mm 3 ) was significantly greater than that of the control group (415.1 mm 3 ) before RME. The intraoral airway volume treatment change in the RME group (−933.3 mm 3 ) was significantly less than that of the control group (155.1 mm 3 ). As a result, there was no significant difference for intraoral airway volume between the 2 groups after RME.
| Before RME (T1) | After RME (T2) | Treatment change | |||||||||||||
|---|---|---|---|---|---|---|---|---|---|---|---|---|---|---|---|
| RME (n = 28) | Control (n = 20) | Group differences | RME (n = 28) | Control (n = 20) | Group differences | RME (n = 28) | Control (n = 20) | Group differences | |||||||
| Mean | SD | Mean | SD | P | Mean | SD | Mean | SD | P | Mean | SD | Mean | SD | P | |
| Intraoral airway (mm 3 ) | 1212.9 | 1370.9 | 415.1 | 803.1 | 0.024 | 279.7 | 472.0 | 570.2 | 1031.4 | 0.251 | −933.3 | 1308.8 ∗ | 155.1 | 1096.7 | 0.004 |
| Total pharyngeal airway (mm 3 ) | 6370.7 | 2291.7 | 6489.3 | 1946.2 | 0.851 | 9386.1 | 2440.6 | 7715.6 | 2151.1 | 0.018 | 3015.4 | 1297.6 ∗ | 1226.3 | 1782.5 ∗ | <0.001 |
| Retropalatal airway (mm 3 ) | 3315.8 | 1141.9 | 3418.5 | 967.7 | 0.746 | 4729.8 | 1553.7 | 3746.2 | 1129.9 | 0.020 | 1413.9 | 1172.0 ∗ | 327.8 | 958.4 | 0.001 |
| Oropharyngeal airway (mm 3 ) | 3054.9 | 1633.4 | 3070.8 | 1206.6 | 0.971 | 4656.3 | 1607.2 | 3969.3 | 1731.8 | 0.164 | 1601.4 | 1459.9 ∗ | 898.5 | 1335.9 ∗ | 0.095 |
The total pharyngeal airway volume treatment change in the RME group (3015.4 mm 3 ) was significantly greater than that of the control group (1226.3 mm 3 ), and the retropalatal airway volume treatment change of the RME group (1413.9 mm 3 ) was significantly greater than that of the control group (327.8 mm 3 ). However, the oropharyngeal airway volume treatment change of the RME group (1601.4 mm 3 ) did not differ significantly from that of the control group (898.5 mm 3 ).
Among the patients without a morphologic obstruction, the pressure after RME (89.08 ± 72.27 Pa; n = 27) was significantly lower than before RME (120.91 ± 84.18 Pa; n = 22) ( Table II ). Similarly, the velocity after RME (10.72 ± 6.38 m/sec; n = 27) was significantly lower than before RME (12.27 ± 5.99 m/sec; n = 22). There were no significant maximum pressure or velocity changes in the control group at the 2 measurement times. The maximum pressure of the RME group was significantly greater than that of the control group both before and after RME, and the treatment change was also significantly larger. The maximum velocity of the RME group was significantly greater than that of the control group before RME.
| Before RME (T1) | After RME (T2) | Treatment change | |||||||||||||
|---|---|---|---|---|---|---|---|---|---|---|---|---|---|---|---|
| RME † (n = 22) | Control ‡ (n = 19) | Group differences | RME ‡ (n = 27) | Control (n = 20) | Group differences | RME † (n = 22) | Control ‡ (n = 19) | Group differences | |||||||
| Mean | SD | Mean | SD | P | Mean | SD | Mean | SD | P | Mean | SD | Mean | SD | P | |
| Maximum pressure (Pa) | 120.91 | 84.18 | 42.56 | 24.02 | <0.001 | 89.08 | 72.27 | 39.41 | 20.35 | 0.026 | −47.25 | 62.37 ∗ | −3.00 | 23.79 | 0.014 |
| Maximum velocity (m/sec) | 12.27 | 5.99 | 7.87 | 3.88 | 0.016 | 10.72 | 6.38 | 7.41 | 3.28 | 0.106 | −2.68 | 5.19 ∗ | −0.44 | 4.36 | 0.129 |
∗ Significant change between T1 and T2 ( P <0.05).
Table III shows the correlations between nasal airway ventilation conditions and intraoral airway volume. Before and after RME, maximum pressure and velocity were significantly correlated with intraoral airway volume. The treatment changes in maximum pressure and velocity were significantly correlated with intraoral airway volume. However, at each interval and treatment change, maximum pressure and velocity were not significantly correlated with any other pharyngeal airway volume (total, retropalatal, or oropharyngeal). At each interval and treatment change, intraoral airway volume was not significantly correlated with any other pharyngeal airway volume.
| Before RME | After RME | Treatment change | ||||
|---|---|---|---|---|---|---|
| Maximum pressure | Maximum velocity | Maximum pressure | Maximum velocity | Maximum pressure | Maximum velocity | |
| Intraoral airway volume before RME (n = 22) † | 0.617 (0.002) ∗ | 0.630 (0.002) ∗ | – | – | – | – |
| Intraoral airway volume after RME (n = 27) ‡ | – | – | 0.473 (0.013) ∗ | 0.518 (0.006) ∗ | – | – |
| Intraoral airway volume treatment change (n = 22) † | – | – | – | – | 0.599 (0.003) ∗ | 0.520 (0.013) ∗ |
∗ Statistically significant at P <0.05.
Stay updated, free dental videos. Join our Telegram channel
VIDEdental - Online dental courses


